



USD/CAD Price Forecast: Approaches 20-day EMA on the back of US-Canada trade dispute
- USD/CAD rises to near 1.3870 as the US-Canada trade war continues to pressure the Canadian Dollar.
- Canada announces upto 50% retaliatory tariffs on USD 20 billion of imports from the US.
- Investors await the US PCE Inflation data for July.
The US Dollar (USD) trades 0.2% higher at around 1.3870 against the Canadian Dollar (USD) during the European trading session on Wednesday. The Loonie pair strengthens as the Canadian Dollar underperforms due to trade tensions between the United States (US) and Canada.
Last week, President Donald Trump announced 50% tariffs on a range of Canadian goods took effect on Saturday after both nations failed to reach a trade deal. In retaliation, Canadian Prime Minister (PM) Mark Carney said earlier this week that the country would impose its own retaliatory tariffs beginning on September 8, CNBC reported.
US-Canada trade spat deepens as retaliatory tariffs cloud outlook
Strategists at Danske Bank note that US-Canada trade frictions have intensified after Ottawa moved to respond to Washington’s latest actions. In their words, “trade tensions have escalated further after Canada announced retaliatory tariffs of up to 50% on USD 20 billion of imports from the US, following Trump's plan to raise taxes on cars and auto parts from Canada.” Danske argues the Canadian measures “appear proportional and aimed at strengthening Canada's negotiating position,” yet cautions that they “add uncertainty for businesses on both sides of the border and risk further pressure on prices and supply chains.” The bank also highlights that as Canada goes “tit-for-tat” in its response, “the Trump administration is said to be weighing additional measures against it,” underscoring the risk of a more entrenched and disruptive trade dispute.
Meanwhile, the US Dollar trades slightly higher ahead of the United States (US) Personal Consumption Expenditure Price Index (PCE) data for July, which will be published at 12:30 GMT.
The US core PCE inflation, which is closely tracked by Federal Reserve (Fed) officials, is expected to have remained steady at 3.3% Year-on-Year (YoY), with monthly figures rising at a 0.2% pace, faster than the June reading of 0.1%.
USD/CAD Technical Analysis
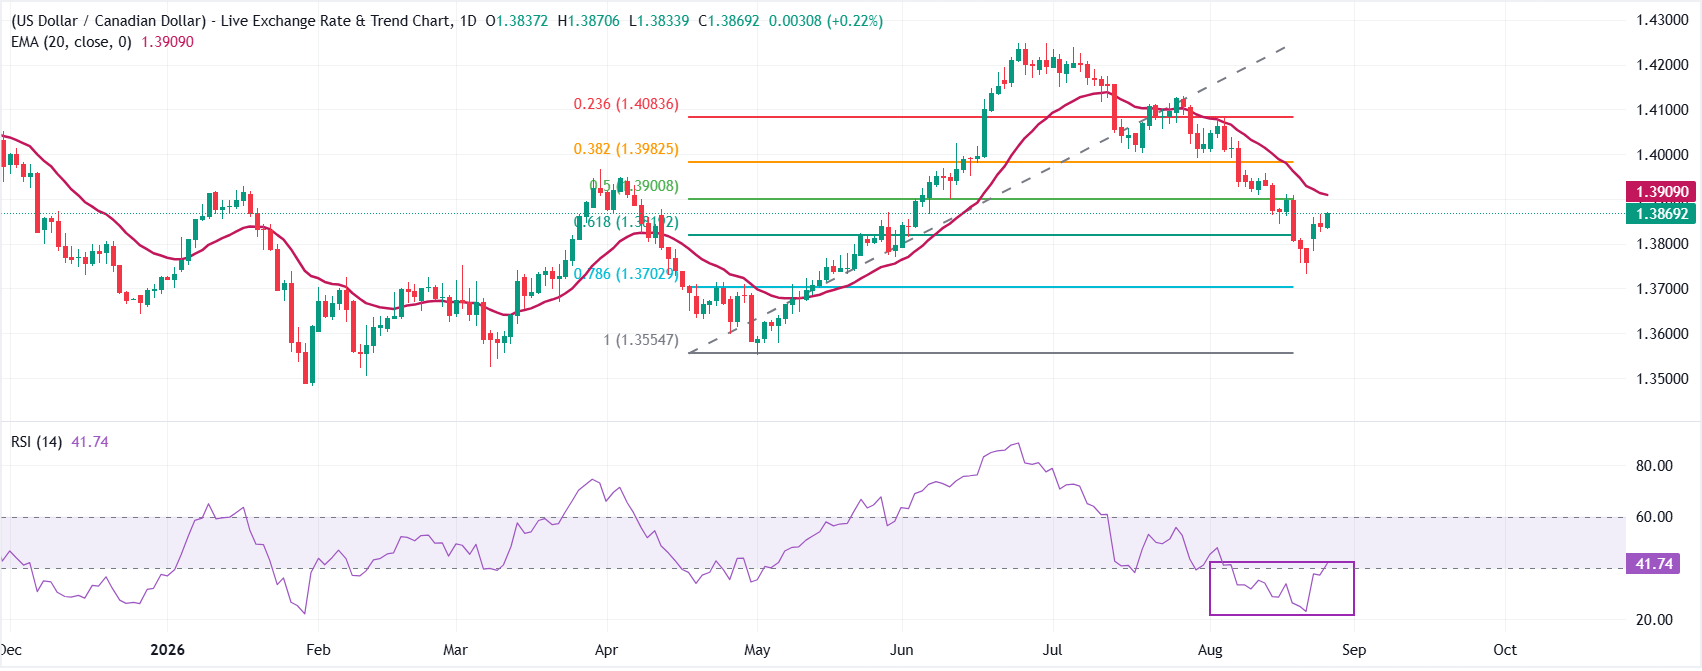
In the daily chart, USD/CAD trades at 1.3869, holding below the 20-period exponential moving average (EMA) at 1.3909 and the 50.0% Fibonacci retracement at 1.3901, which keeps the near-term bias bearish. The pair has slipped under the mid-range of the recent upswing, while the Relative Strength Index (RSI) at 41.7 remains below the neutral 50 line, hinting at subdued bullish momentum rather than an imminent reversal.
On the downside, immediate support is aligned with the 61.8% Fibonacci retracement at 1.3819, ahead of a deeper structural floor at the 78.6% level near 1.3703 and the prior cycle base marked by the 100% retracement at 1.3555. On the topside, initial resistance is clustered around the 50.0% retracement at 1.3901 and the overhanging 20-EMA at 1.3909, followed by the 38.2% retracement at 1.3983 and the 23.6% level at 1.4084; only a sustained break above these layers would ease the current downside pressure.
(The technical analysis of this story was written with the help of an AI tool. Know more.)
Economic Indicator
Core Personal Consumption Expenditures - Price Index (YoY)
The Core Personal Consumption Expenditures (PCE), released by the US Bureau of Economic Analysis on a monthly basis, measures the changes in the prices of goods and services purchased by consumers in the United States (US). The PCE Price Index is also the Federal Reserve’s (Fed) preferred gauge of inflation. The YoY reading compares the prices of goods in the reference month to the same month a year earlier. The core reading excludes the so-called more volatile food and energy components to give a more accurate measurement of price pressures." Generally, a high reading is bullish for the US Dollar (USD), while a low reading is bearish.
Read more.Next release: Wed Aug 26, 2026 12:30
Frequency: Monthly
Consensus: 3.3%
Previous: 3.3%
Source: US Bureau of Economic Analysis
After publishing the GDP report, the US Bureau of Economic Analysis releases the Personal Consumption Expenditures (PCE) Price Index data alongside the monthly changes in Personal Spending and Personal Income. FOMC policymakers use the annual Core PCE Price Index, which excludes volatile food and energy prices, as their primary gauge of inflation. A stronger-than-expected reading could help the USD outperform its rivals as it would hint at a possible hawkish shift in the Fed’s forward guidance and vice versa.
Nothing in this material constitutes investment advice, personal recommendation, investment research, an offer, or a solicitation to buy or sell any financial instrument. The content has been prepared without consideration of your individual investment objectives, financial situation, or needs, and should not be treated as such.
Past performance is not a reliable indicator of future performance and/or results. Forward-looking scenarios or forecasts are not a guarantee of future performance. Actual results may differ materially from those anticipated.
Mitrade makes no representation or warranty as to the accuracy or completeness of the information provided and accepts no liability for any loss arising from reliance on such information.
Recommended Articles


