



USD/JPY Price Forecast: 20-day EMA becomes dynamic support now
- USD/JPY rises to near 160.00 as the US Dollar gains due to rising US Treasury Yields.
- US fiscal concerns and the Fed’s credibility risks prompt bond yields.
- The BoJ is anticipated to raise interest rates this month.
The US Dollar (USD) is up 0.15% to near 160.00 against the Japanese Yen (JPY) during the European trading session on Tuesday. The USD/JPY pair strengthens as the US Dollar outperforms due to surging United States (US) Treasury Yields amid fiscal concerns and questions over the credibility of the Federal Reserve’s (Fed) decision-making.
As of writing, the US Dollar Index (DXY), which gauges the Greenback’s value against six major currencies, trades 0.2% higher to near 99.60. 10-year US Treasury Yields hit a fresh 19-month high at 4.78% and are approaching the multi-year high of 4.81%.
US Dollar Price Today
The table below shows the percentage change of US Dollar (USD) against listed major currencies today. US Dollar was the strongest against the New Zealand Dollar.
| USD | EUR | GBP | JPY | CAD | AUD | NZD | CHF | |
|---|---|---|---|---|---|---|---|---|
| USD | 0.18% | 0.05% | 0.10% | 0.10% | 0.34% | 0.37% | 0.19% | |
| EUR | -0.18% | -0.12% | -0.06% | -0.09% | 0.15% | 0.17% | 0.00% | |
| GBP | -0.05% | 0.12% | 0.04% | 0.08% | 0.27% | 0.30% | 0.13% | |
| JPY | -0.10% | 0.06% | -0.04% | 0.00% | 0.23% | 0.28% | 0.09% | |
| CAD | -0.10% | 0.09% | -0.08% | -0.01% | 0.23% | 0.24% | 0.08% | |
| AUD | -0.34% | -0.15% | -0.27% | -0.23% | -0.23% | 0.04% | -0.15% | |
| NZD | -0.37% | -0.17% | -0.30% | -0.28% | -0.24% | -0.04% | -0.17% | |
| CHF | -0.19% | -0.01% | -0.13% | -0.09% | -0.08% | 0.15% | 0.17% |
The heat map shows percentage changes of major currencies against each other. The base currency is picked from the left column, while the quote currency is picked from the top row. For example, if you pick the US Dollar from the left column and move along the horizontal line to the Japanese Yen, the percentage change displayed in the box will represent USD (base)/JPY (quote).
US curve reprices hawkish Fed as long-end selloff flags fiscal and credibility fears
Strategists at BNY Markets highlight that, although he “stopped short of explicit forward guidance in his Jackson Hole address,” Fed Chair Kevin Warsh “stepped as close to the line as possible in advocating a hike,” with the market now “pricing an almost two-thirds probability for one at the FOMC’s September 16 meeting.” Beyond that decision, they note that “the view is murkier,” but futures still “see at least an additional hike into early 2027 and more upside – although not a full hike – beyond that, with a total of about two-and-a-half currently priced.”
BNY observes that the rate repricing has been accompanied by a notable move at the back end of the curve: “The long end has sold off, betraying the view of many (including ours) that a more hawkish Fed would help bring yields lower as credibility would be seen to be enhanced.” Instead, “both the 10y and 30y yields have moved much higher since Friday,” a development that “continues to reinforce for us the view that the long end of the curve is being led by something other than mere inflation expectations and policy conjectures.” BNY concludes, “We think of fiscal concerns and doubts about institutional credibility as the culprits.”
Meanwhile, the Japanese Yen struggles to attract bids even as market experts are confident about the Bank of Japan (BoJ) raising interest rates in the policy meeting this month.
Yen under pressure as markets ramp up BoJ hike expectations
Analysts at Danske Bank highlight that the latest commentary from the BoJ has sharpened market expectations for further tightening. They note that “markets were already pricing a high likelihood of a 25bp hike to 1.25% at the September meeting,” but stress that “the remarks added to the pressure with markets now pricing a rate hike by 70%.”
USD/JPY Technical Analysis
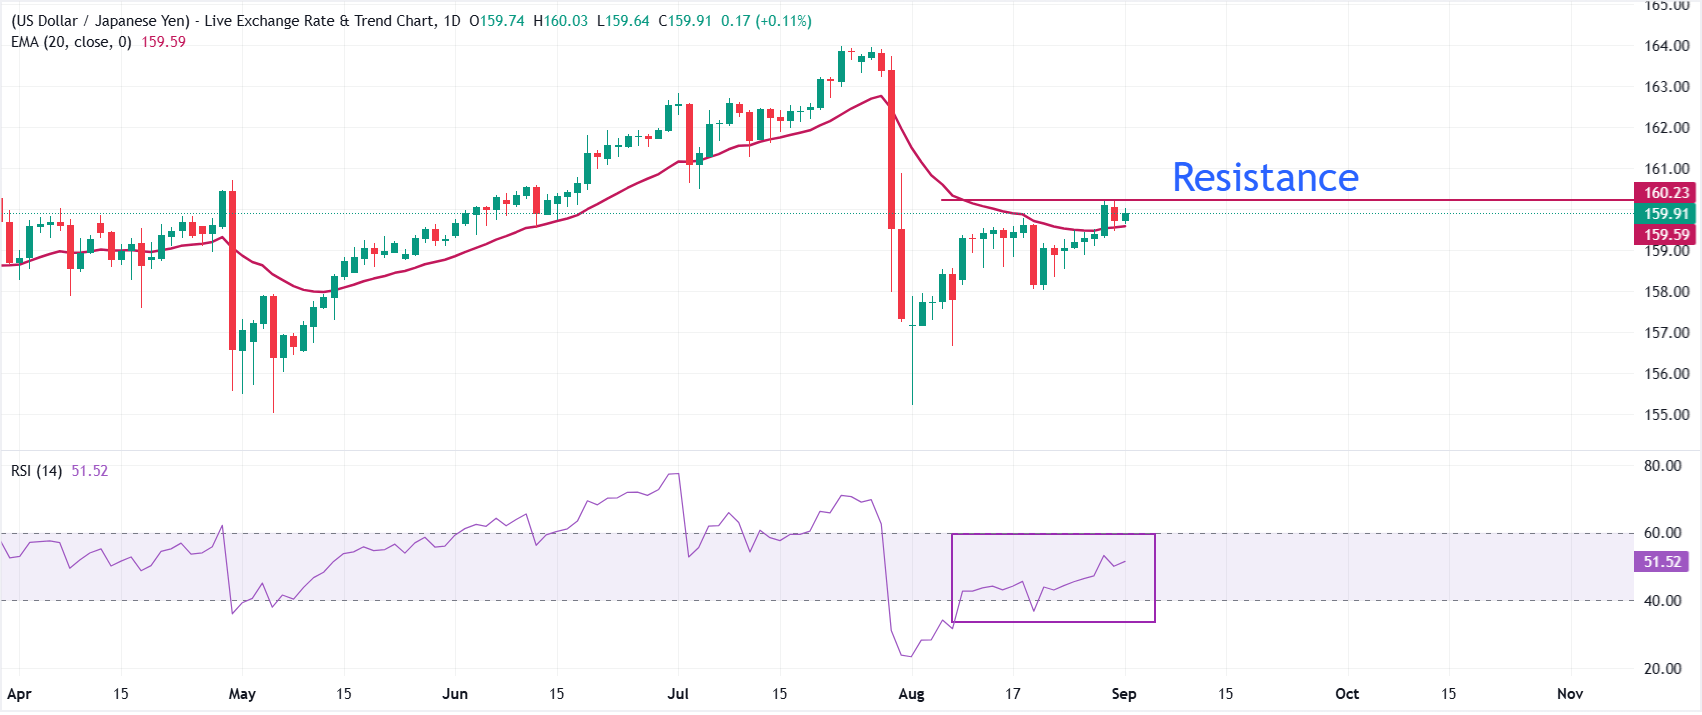
In the daily chart, USD/JPY trades at 159.91. The pair holds above the 20-day exponential moving average (EMA) at 159.59, which suggests that the near-term bias remains mildly bullish as price respects trend support. Momentum is constructive rather than aggressive, with the 14-day Relative Strength Index (RSI) hovering near 51, hinting at a modest upside tilt after recovering from previously oversold readings.
On the downside, immediate support is located at the 20-day EMA around 159.59, where buyers have scope to defend the current upswing. On the upside, the pair needs a decisive break above the August 28 high at 160.20 to extend the rally towards the July 31 high at 160.88.
(The technical analysis of this story was written with the help of an AI tool. Know more.)
US Dollar FAQs
The US Dollar (USD) is the official currency of the United States of America, and the ‘de facto’ currency of a significant number of other countries where it is found in circulation alongside local notes. It is the most heavily traded currency in the world, accounting for over 88% of all global foreign exchange turnover, or an average of $6.6 trillion in transactions per day, according to data from 2022. Following the second world war, the USD took over from the British Pound as the world’s reserve currency. For most of its history, the US Dollar was backed by Gold, until the Bretton Woods Agreement in 1971 when the Gold Standard went away.
The most important single factor impacting on the value of the US Dollar is monetary policy, which is shaped by the Federal Reserve (Fed). The Fed has two mandates: to achieve price stability (control inflation) and foster full employment. Its primary tool to achieve these two goals is by adjusting interest rates. When prices are rising too quickly and inflation is above the Fed’s 2% target, the Fed will raise rates, which helps the USD value. When inflation falls below 2% or the Unemployment Rate is too high, the Fed may lower interest rates, which weighs on the Greenback.
In extreme situations, the Federal Reserve can also print more Dollars and enact quantitative easing (QE). QE is the process by which the Fed substantially increases the flow of credit in a stuck financial system. It is a non-standard policy measure used when credit has dried up because banks will not lend to each other (out of the fear of counterparty default). It is a last resort when simply lowering interest rates is unlikely to achieve the necessary result. It was the Fed’s weapon of choice to combat the credit crunch that occurred during the Great Financial Crisis in 2008. It involves the Fed printing more Dollars and using them to buy US government bonds predominantly from financial institutions. QE usually leads to a weaker US Dollar.
Quantitative tightening (QT) is the reverse process whereby the Federal Reserve stops buying bonds from financial institutions and does not reinvest the principal from the bonds it holds maturing in new purchases. It is usually positive for the US Dollar.
Nothing in this material constitutes investment advice, personal recommendation, investment research, an offer, or a solicitation to buy or sell any financial instrument. The content has been prepared without consideration of your individual investment objectives, financial situation, or needs, and should not be treated as such.
Past performance is not a reliable indicator of future performance and/or results. Forward-looking scenarios or forecasts are not a guarantee of future performance. Actual results may differ materially from those anticipated.
Mitrade makes no representation or warranty as to the accuracy or completeness of the information provided and accepts no liability for any loss arising from reliance on such information.
Recommended Articles


