



Silver Price Forecasts: XAG/USD dips to $59.00 amid high yields, geopolitical tensions
- XAG/USD fails to hold above $60 and nears two-month lows at $59.00.
- Precious metals are struggling amid rising Oil prices and high Treasury yields.
- Below $59.00, bears would have the path towards the mid-$56.00s range clear.
Silver (XAG/USD) reverses on Thursday’s European session opening times, following a frail recovery attempt in Asian trading, and falls to the $59.30 area after being capped near $60.60 earlier in the day. The white metal has turned negative in the daily chart, as market sentiment deteriorates with growing tensions in the Middle East pushing Oil prices higher.
Reports of a new wave of attacks on Saudi Arabian airports by the Iran-backed Houthis have pushed the price of Brent Oil to levels above $101.50, more than 5% above Tuesday's lows. Concerns about a further escalation of hostilities in the region have also pushed shipping costs higher, altogether souring market sentiment and providing a fresh impulse to the safe-haven US Dollar.
Oil’s rally is also boosting Treasury yields across the globe, amid hopes that the higher energy prices will force the major central banks to tighten their monetary policies further. The US 10-year yield remains above 5.30%, despite a strong auction on Wednesday, and the 30-yield note pays above 5.7%, a few percentage points below 24-year highs, levels consistent with weak speculative demand for precious metals.
Technical Analysis: Support at the $59.00 area is under pressure
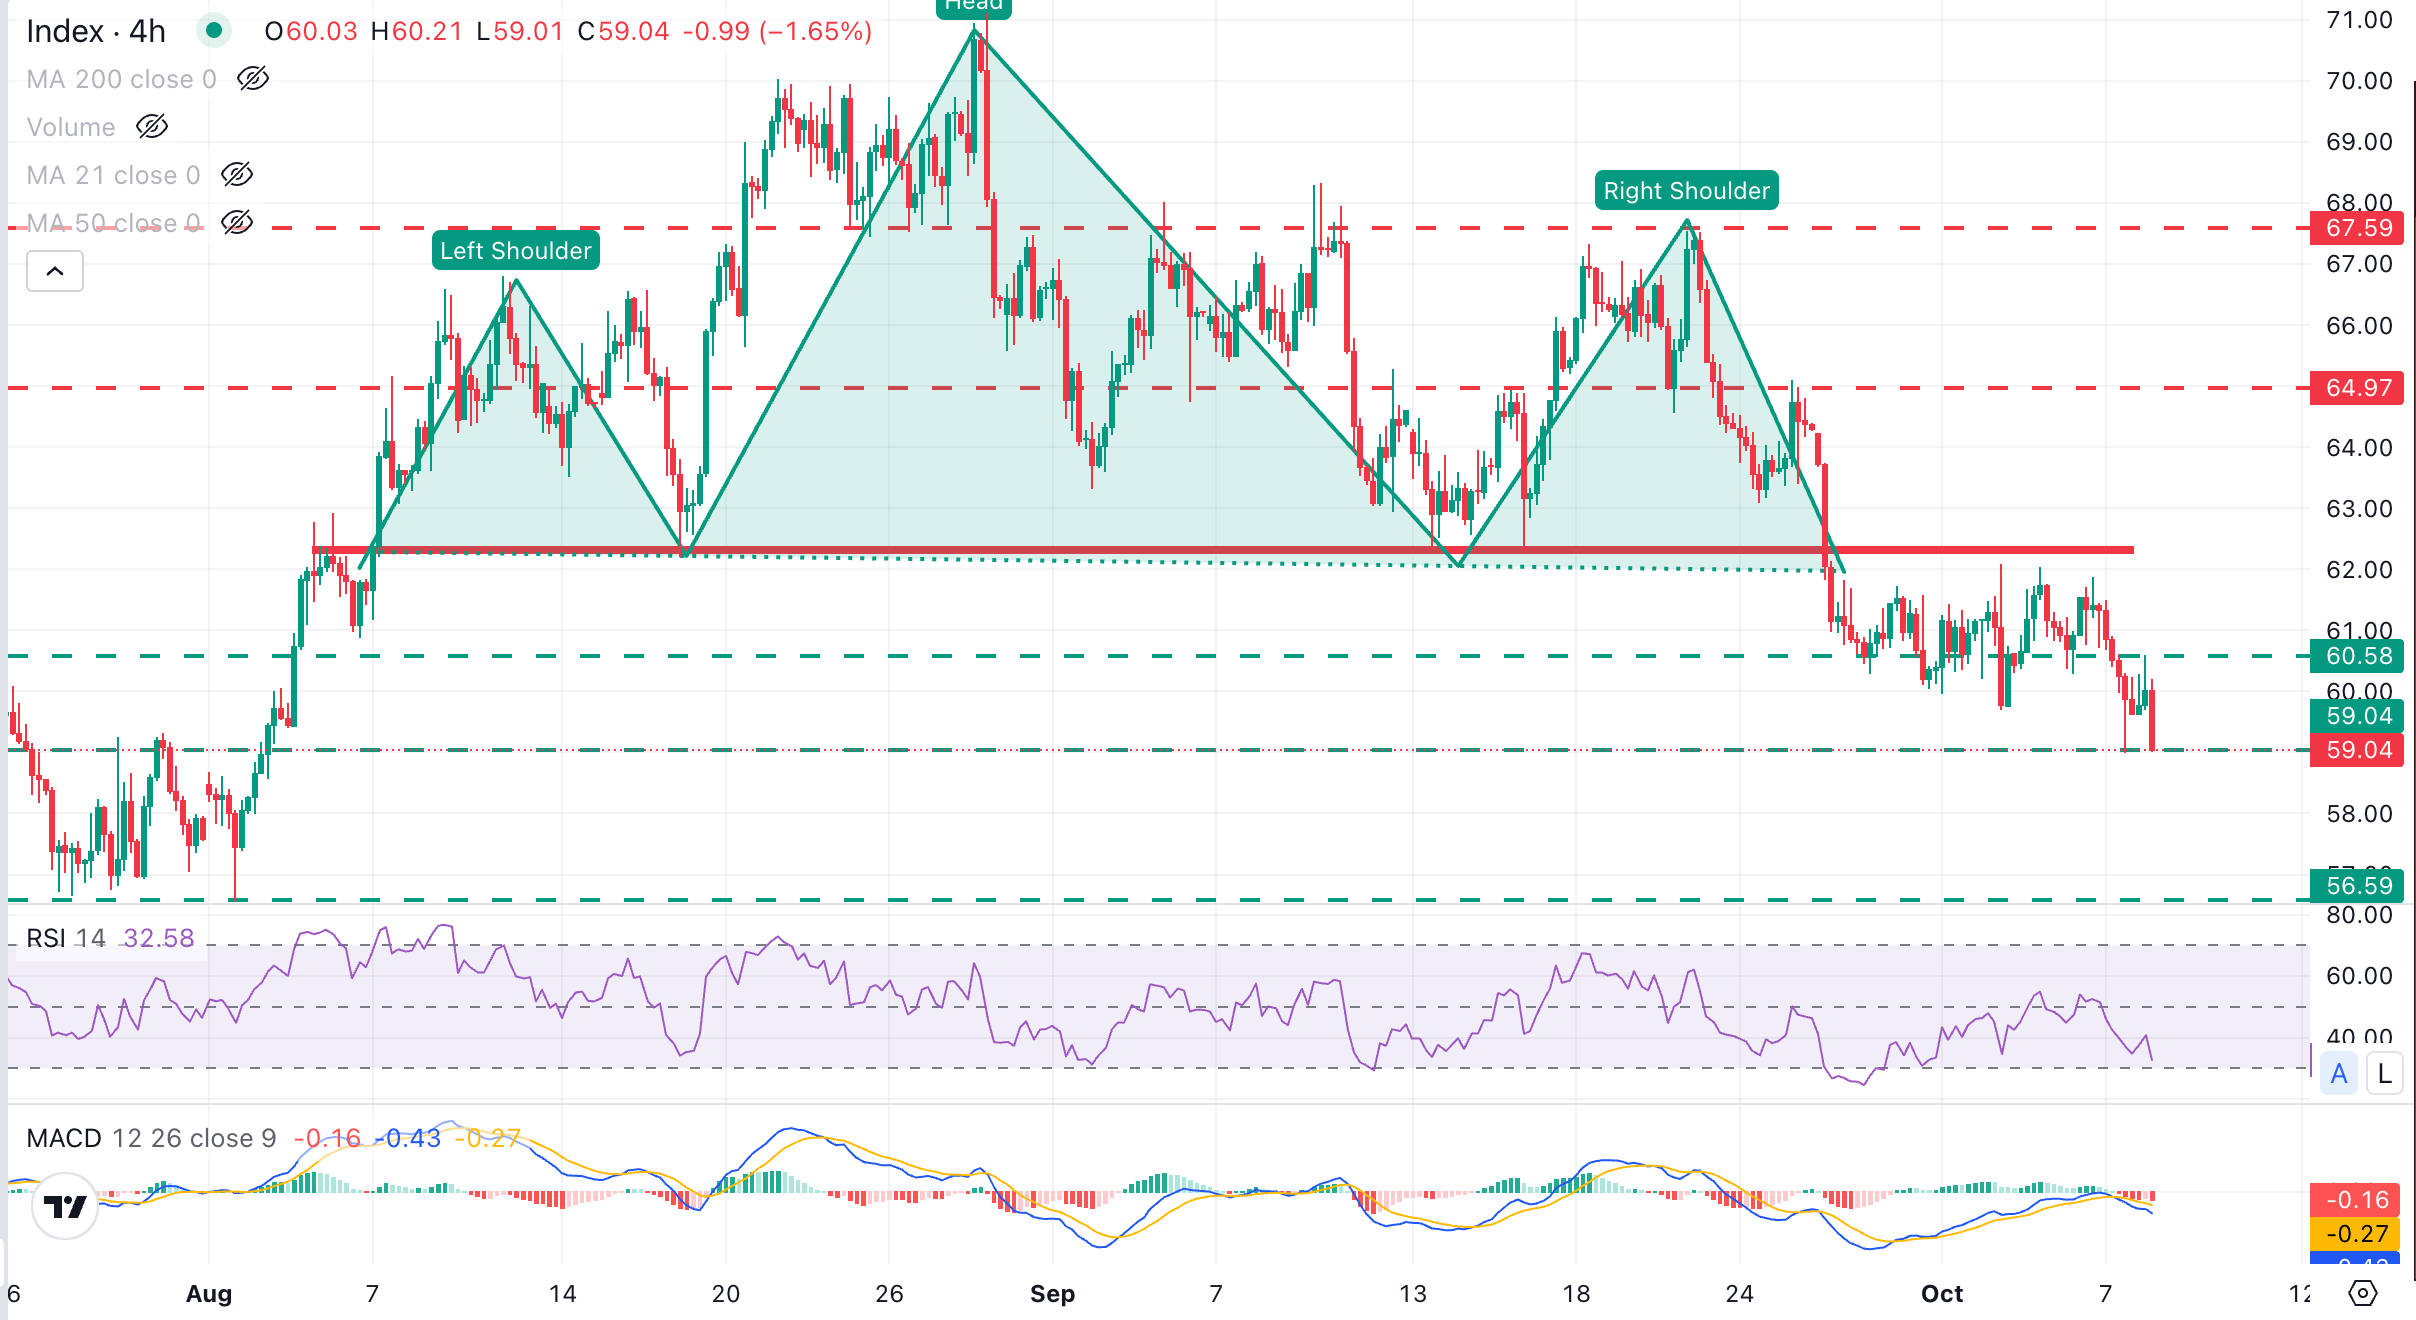
The XAG/USD technical picture shows the pair extending its reversal from late August highs above $70.00, with bulls capped below the neckline of a bearish Head & Shoulders pattern (H&S), leaving the door iopen for a further downleg. Momentum indicators in the 4-hour chart support this view as the Relative Strength Index (14) dips further below 35 and the Moving Average Convergence Divergence (MACD) turns negative.
Bears are aiming for the two-month low at the $59.00 area hit on Wednesday, with the next target at the late July and early August lows near $56.50. On the topside, any recovery would first need to reclaim the mentioned H&S neckline at the $62.00 area to shift the focus towards the September 25 high in the $65.00 area
(The technical analysis of this story was written with the help of an AI tool. Know more.)
Nothing in this material constitutes investment advice, personal recommendation, investment research, an offer, or a solicitation to buy or sell any financial instrument. The content has been prepared without consideration of your individual investment objectives, financial situation, or needs, and should not be treated as such.
Past performance is not a reliable indicator of future performance and/or results. Forward-looking scenarios or forecasts are not a guarantee of future performance. Actual results may differ materially from those anticipated.
Mitrade makes no representation or warranty as to the accuracy or completeness of the information provided and accepts no liability for any loss arising from reliance on such information.
Recommended Articles


