

Gold rallies towards $5,300 as Mideast war, Oil spike stoke haven bid
- Gold rallies as escalation of the US-Iran war heightens geopolitical risk.
- DXY climbs near 98.70, yet haven flows and oil-driven inflation fears underpin bullion.
- Markets still price an easing by the Federal Reserve despite reduced dovish bets.
Gold prices advance over 1% on Monday, as geopolitical risks rise due to the escalation of the conflict in the Middle East that sparked an attack from the US and Israel on Iran. At the time of writing, XAU/USD trades at $5,341 after hitting a one-month high of $5,419 earlier in the day.
Geopolitics drive XAU’s price action
The attack that began targeting the elimination of Iran’s Ayatollah Ali Khamenei has broadened. Attacks from Hezbollah on Israel triggered a retaliation from the latter, while Tehran launched missiles and drones at Israel, the Gulf states and a UK airbase near Cyprus.
Recently, US President Donald Trump said the operation is going very well. “We’re knocking the crap out of them,” he stated in an interview with CNN. He was asked about how long the war might last, Trump commented that he thought four weeks, but added that they’re ahead of schedule.
Geopolitical uncertainty amidst the Middle East conflict and the lack of progress in peace talks between Ukraine and Russia are likely to underpin bullion prices.
Also, the jump in Oil prices stoked inflation fears, triggering a move in tandem with Gold and the Greenback, according to the US Dollar Index (DXY). The DXY, which tracks the buck’s performance against six currencies, is up 1%, at 98.67 at the time of writing.
Further Gold’s upside as Fed dovish bets weaken the Greenback
Speculation that the Federal Reserve (Fed) policy will ease is a tailwind for Gold price. Money market players are pricing in 49 basis points of easing, down from 61 basis points, according to Prime Market Terminal.
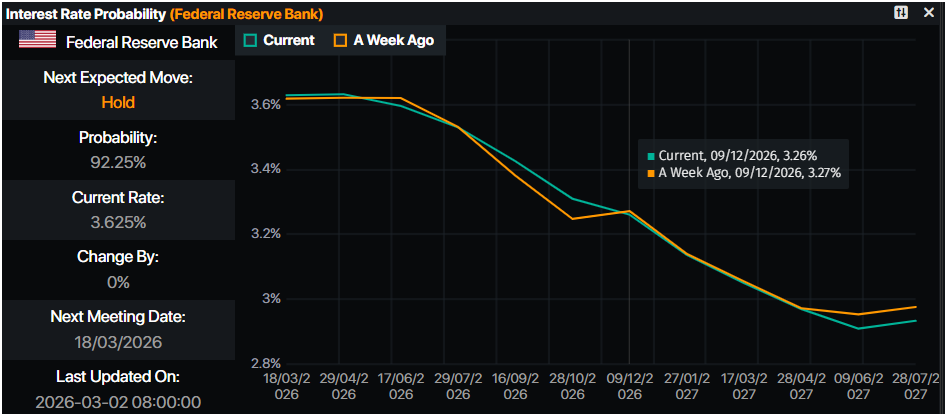
However, traders seem confident that the Fed will reduce rates at least twice in 2026.
The ISM revealed that the Manufacturing Purchasing Managers Index (PMI) in February remained at expansion territory for the second straight month. The ISM revealed that business activity dipped from 52.6 to 52.4. The ISM Prices Paid subcomponent jumped to its highest level in three and a half years, a sign that import tariffs are pushing up input costs.
Analysts at BNP Paribas commented that physical Gold investment demand is a key driver this year. Gold-backed ETFs are showing an accumulation of 2 million so far this year and expect more purchases by Chinese investors than in 2026.
Ahead of the US economic docket will feature speeches by Federal Reserve officials John Williams of the New York Fed, and Kansas City Fed President Jeffrey Schmid.
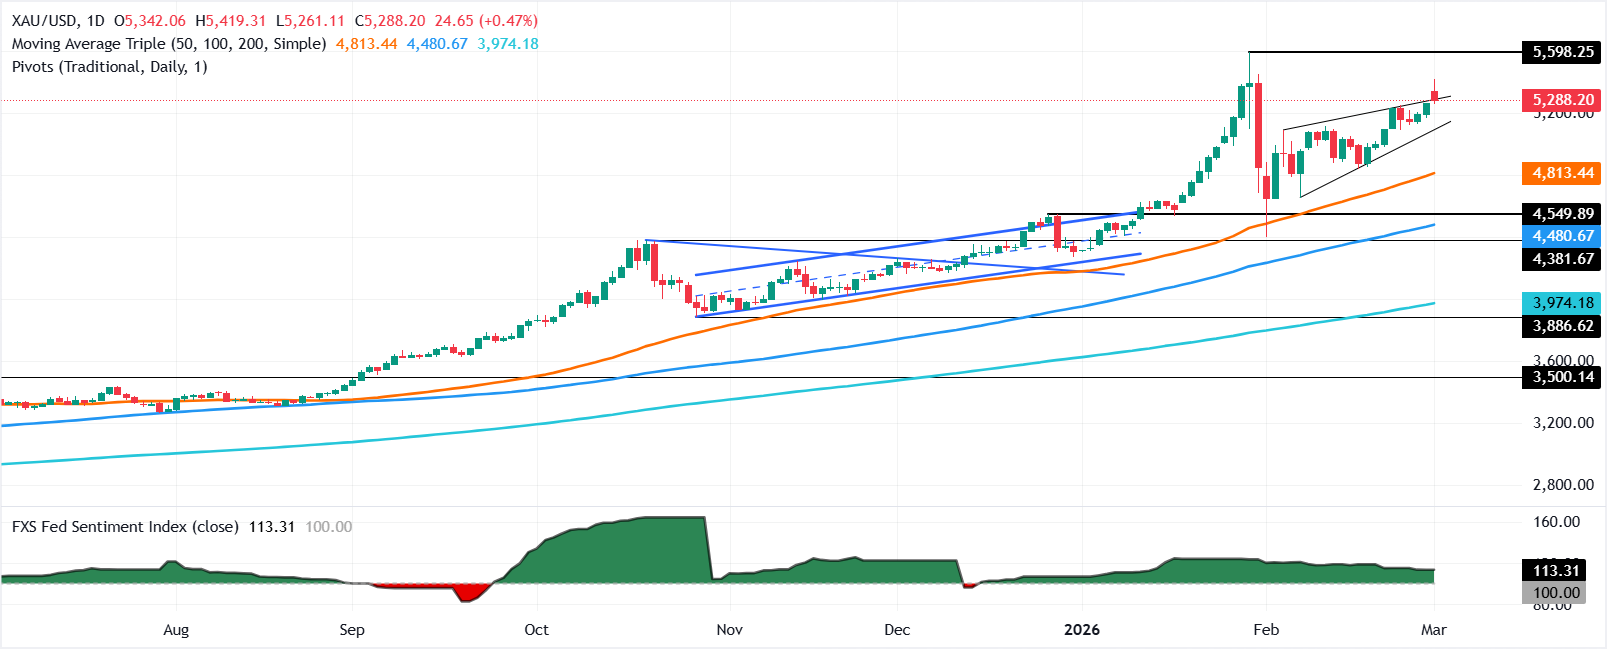
XAU/USD Technical outlook: Gold retreats from three-week high, eyes on $5,300
Gold’s uptrend remains intact, yet price action shows that bulls are booking profits as the yellow metal has retreated from four-week highs hit during Monday’s European session past $5,400. Momentum remains positive for Gold as depicted by the relative Strength Index (RSI), which remains in bullish territory, far from overbought.
If XAU/USD rises past $5,350, the first resistance would be $5,400, followed by the day’s high at $5,419. Overhead, the next area of interest would be $5,451, the January 30 high, ahead of the record high near $5,600.
Conversely, if Gold tumbles below $5,300, the first support would be the February 27 daily high turned support at $5,279, followed by $5,250. Once surpassed, the next stop would be $5,200.
Gold FAQs
Gold has played a key role in human’s history as it has been widely used as a store of value and medium of exchange. Currently, apart from its shine and usage for jewelry, the precious metal is widely seen as a safe-haven asset, meaning that it is considered a good investment during turbulent times. Gold is also widely seen as a hedge against inflation and against depreciating currencies as it doesn’t rely on any specific issuer or government.
Central banks are the biggest Gold holders. In their aim to support their currencies in turbulent times, central banks tend to diversify their reserves and buy Gold to improve the perceived strength of the economy and the currency. High Gold reserves can be a source of trust for a country’s solvency. Central banks added 1,136 tonnes of Gold worth around $70 billion to their reserves in 2022, according to data from the World Gold Council. This is the highest yearly purchase since records began. Central banks from emerging economies such as China, India and Turkey are quickly increasing their Gold reserves.
Gold has an inverse correlation with the US Dollar and US Treasuries, which are both major reserve and safe-haven assets. When the Dollar depreciates, Gold tends to rise, enabling investors and central banks to diversify their assets in turbulent times. Gold is also inversely correlated with risk assets. A rally in the stock market tends to weaken Gold price, while sell-offs in riskier markets tend to favor the precious metal.
The price can move due to a wide range of factors. Geopolitical instability or fears of a deep recession can quickly make Gold price escalate due to its safe-haven status. As a yield-less asset, Gold tends to rise with lower interest rates, while higher cost of money usually weighs down on the yellow metal. Still, most moves depend on how the US Dollar (USD) behaves as the asset is priced in dollars (XAU/USD). A strong Dollar tends to keep the price of Gold controlled, whereas a weaker Dollar is likely to push Gold prices up.
Nothing in this material constitutes investment advice, personal recommendation, investment research, an offer, or a solicitation to buy or sell any financial instrument. The content has been prepared without consideration of your individual investment objectives, financial situation, or needs, and should not be treated as such.
Past performance is not a reliable indicator of future performance and/or results. Forward-looking scenarios or forecasts are not a guarantee of future performance. Actual results may differ materially from those anticipated.
Mitrade makes no representation or warranty as to the accuracy or completeness of the information provided and accepts no liability for any loss arising from reliance on such information.
Recommended Articles


