



Gold slips as markets weigh renewed US-Iran escalation amid ongoing negotiations
- Gold edges lower as fresh US military action in southern Iran clouds hopes for an immediate peace deal.
- Hawkish Federal Reserve expectations driven by elevated Oil prices continue to weigh on the non-yielding metal.
- Technically, weak momentum indicators on the 4-hour chart suggest XAU/USD remains stuck in a consolidative bearish phase.
Gold (XAU/USD) loses ground on Tuesday as the US Dollar (USD) and Oil prices rebound after renewed US military strikes in southern Iran dampen hopes for a quick end to the Middle East war. At the time of writing, XAU/USD is trading around $4,511, easing from an intraday high of $4,580.
The US Central Command said on Monday that US forces carried out “defensive strikes” in southern Iran targeting missile sites and Iranian boats allegedly attempting to place naval mines near the Strait of Hormuz. Meanwhile, Iran’s Islamic Revolutionary Guard Corps (IRGC) said it had downed a US MQ-9 Reaper drone after it entered Iranian airspace.
The fresh military developments came as the United States (US) and Iran continue working toward a deal that could extend the ceasefire by 60 days and reopen the Strait of Hormuz, while negotiations over Iran’s nuclear program would continue.
Iran’s Tasnim News Agency, citing a source close to the negotiation team, reported that Tehran wants the United States (US) to release $24 billion in frozen Iranian funds as part of a potential deal. Iran is also seeking at least half of that amount to be released immediately after the agreement is announced.
Lingering uncertainty surrounding the negotiations keeps market sentiment cautious, leaving Gold largely range-bound near recent lows, as a firmer US Dollar and higher-for-longer interest rate expectations continue to limit the upside.
Elevated Oil prices have slowed the disinflation progress in the United States (US), pushing inflation further away from the Federal Reserve’s (Fed) 2% target and increasing pressure on the central bank to maintain a restrictive monetary policy stance. A higher-interest-rate environment tends to weigh on non-yielding assets such as Gold.
Markets are currently pricing in nearly a 40% chance of a 25 basis point Fed rate hike at the December meeting, according to the CME FedWatch Tool. Traders now await the US Personal Consumption Expenditures (PCE) inflation report due on Thursday for fresh clues on the central bank’s monetary policy outlook.
Looking ahead, the US economic calendar remains relatively light on Tuesday, keeping market focus firmly on geopolitical developments in the Middle East. Later in the American session, traders will monitor the Conference Board (CB) Consumer Confidence data for May.
Technical Analysis: Weak momentum keeps XAU/USD under pressure near recent lows
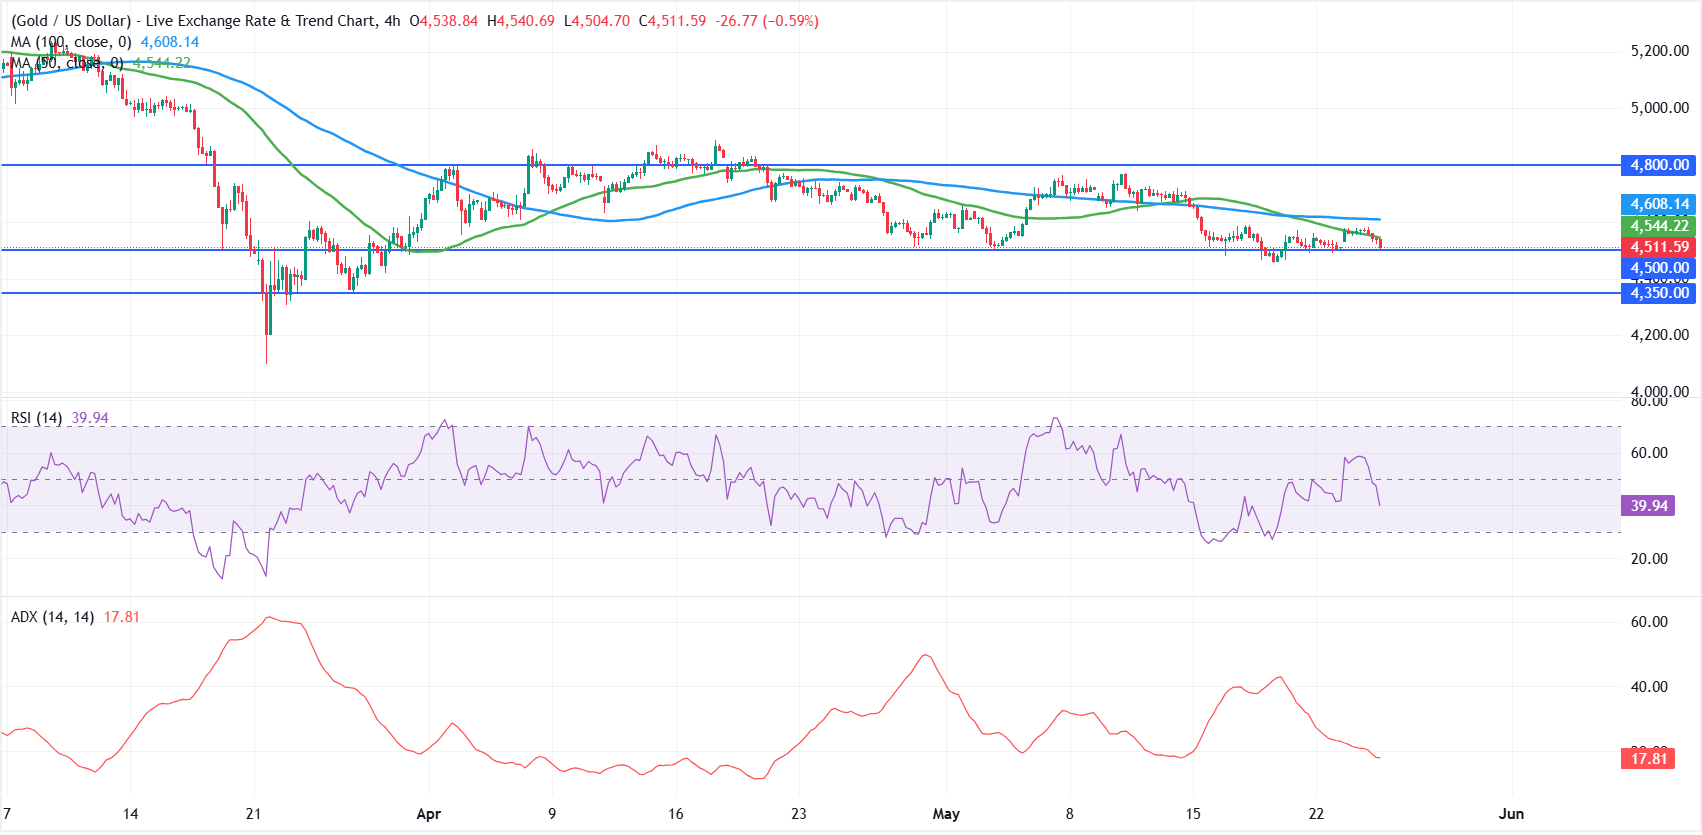
On the 4-hour chart, XAU/USD retains a mild bearish bias as it holds below both the 50- and 100-period Simple Moving Averages (SMAs). The inability to reclaim these moving averages suggests rallies remain capped for now, while the Relative Strength Index (RSI) around 44 points to consolidative, slightly negative momentum and the soft Average Directional Index (ADX) near 18 hints at a weak underlying trend rather than an impulsive move.
On the topside, initial resistance is located at the nearby 50-period SMA at $4,544, followed by the 100-period SMA at $4,608, with a stronger barrier emerging at the horizontal level of $4,800.
On the downside, immediate support sits at the horizontal floor around $4,500, ahead of a deeper cushion at $4,350, where buyers would be expected to show stronger interest if the metal extends its pullback.
(The technical analysis of this story was written with the help of an AI tool.)
US Dollar Price Today
The table below shows the percentage change of US Dollar (USD) against listed major currencies today. US Dollar was the strongest against the New Zealand Dollar.
| USD | EUR | GBP | JPY | CAD | AUD | NZD | CHF | |
|---|---|---|---|---|---|---|---|---|
| USD | 0.02% | 0.13% | 0.16% | 0.00% | 0.08% | 0.43% | 0.22% | |
| EUR | -0.02% | 0.14% | 0.15% | 0.00% | 0.10% | 0.44% | 0.21% | |
| GBP | -0.13% | -0.14% | 0.02% | -0.13% | -0.04% | 0.30% | 0.09% | |
| JPY | -0.16% | -0.15% | -0.02% | -0.15% | -0.05% | 0.27% | 0.10% | |
| CAD | -0.00% | -0.00% | 0.13% | 0.15% | 0.11% | 0.44% | 0.24% | |
| AUD | -0.08% | -0.10% | 0.04% | 0.05% | -0.11% | 0.34% | 0.13% | |
| NZD | -0.43% | -0.44% | -0.30% | -0.27% | -0.44% | -0.34% | -0.21% | |
| CHF | -0.22% | -0.21% | -0.09% | -0.10% | -0.24% | -0.13% | 0.21% |
The heat map shows percentage changes of major currencies against each other. The base currency is picked from the left column, while the quote currency is picked from the top row. For example, if you pick the US Dollar from the left column and move along the horizontal line to the Japanese Yen, the percentage change displayed in the box will represent USD (base)/JPY (quote).
Nothing in this material constitutes investment advice, personal recommendation, investment research, an offer, or a solicitation to buy or sell any financial instrument. The content has been prepared without consideration of your individual investment objectives, financial situation, or needs, and should not be treated as such.
Past performance is not a reliable indicator of future performance and/or results. Forward-looking scenarios or forecasts are not a guarantee of future performance. Actual results may differ materially from those anticipated.
Mitrade makes no representation or warranty as to the accuracy or completeness of the information provided and accepts no liability for any loss arising from reliance on such information.
Recommended Articles


