



Crude Oil prices the mines, not the barrels
- WTI trades near $85.00, up 2.5%, still inside the August range.
- Two launchers hit, no production lost, no barrel confirmed missing.
- Hormuz transits down to about five a day over the weekend.
Crude Oil trades near $85.00 and 2.5% higher on the session, after American forces struck two Iranian rocket launchers on Larak Island and Tehran answered with missile and drone attacks on two air bases in Jordan. West Texas Intermediate (WTI) opened near $84.00, ran to a session high just short of $86.00, and has held most of that ground. Nothing that happened over the weekend removed a barrel from the market.
What two launchers actually threatened
The military content of Sunday's strike rounds to nothing. Two mobile launchers on a small island do not change the balance of anything, and Central Command described the action as limited and precise, which is the language of a traffic stop rather than a campaign. What the launchers were carrying is the entire story.
Sea mines are the only cheap instrument capable of closing the Strait of Hormuz, and Central Command had cleared the last batch out of the international shipping lanes the week before. Iran was reloading. The barrel is repricing the odds that a waterway just declared clear gets mined again, which is a transit risk rather than a production loss, and the two behave very differently in a curve.
Shipping data agrees that transit is where the damage sits. Visible commodity vessels crossing the strait fell to roughly five a day over the weekend, and British maritime authorities reported a tanker struck by a projectile on an inbound run on Saturday. About a fifth of the world's Crude Oil moved through that water before the war began at the end of February.
The supply shock nobody can locate
The loudest supply claim of the weekend arrived with no evidence attached. President Trump posted that Kharg Island, the terminal handling almost all Iranian Crude Oil exports, was being destroyed, and the post carried an artificially generated clip and no further detail. No independent confirmation that the island was under attack has surfaced since.
The flow numbers have meanwhile been improving rather than collapsing. Bank estimates put Gulf exports at roughly 15 million to 16 million barrels a day, well up from the 5 million to 6 million trough in March and still short of a prewar 22 million to 24 million. A market genuinely discounting a fresh catastrophe would not be sitting two thirds of the way back to normal.
The tape sides with the flow numbers rather than the headline. A 2.5% session that stops short of the late-August peak, inside a band the barrel has not escaped since the first week of the month, is a risk premium being topped up rather than a supply loss being discounted.
The mechanism that actually removes barrels this quarter is administrative rather than kinetic. The Treasury sanctioned close to 60 entities, individuals and vessels on Monday, and the secretary has signalled a fresh secondary package roughly every week from here. Sanctions take longer to bite than a missile and they do not photograph well, which is why the tape keeps paying for the strike and discounting the paperwork.
The week the barrel writes its own ceiling
Pricing for a September Federal Reserve increase sits near 60% after Friday's Jackson Hole keynote, against roughly 35% before it, and a barrel through $85.00 is among the reasons it stays there. The Institute for Supply Management (ISM) manufacturing Purchasing Managers Index (PMI) lands Tuesday at 14:00 GMT with prices paid forecast at 72 against 71.1 prior, and the services equivalent follows Thursday with that line last at 70.3.
Those two subindices are where an energy shock registers before it reaches any inflation release, which makes this week a feedback loop rather than a calendar. Energy lifts prices paid, prices paid lifts hike odds, hike odds lift the Dollar, and a firmer Dollar caps the barrel that started the sequence.
Friday's employment report is the week's last event, with August payrolls forecast at 58K after a 23K contraction and hourly earnings accelerating to 0.3% MoM from 0.1%. The private payroll count lands Wednesday at 12:15 GMT at a forecast 47K, and the Beige Book follows at 18:00 GMT the same day. None of it changes the supply picture, and all of it changes the rate that supply picture is discounted against.
Levels to watch
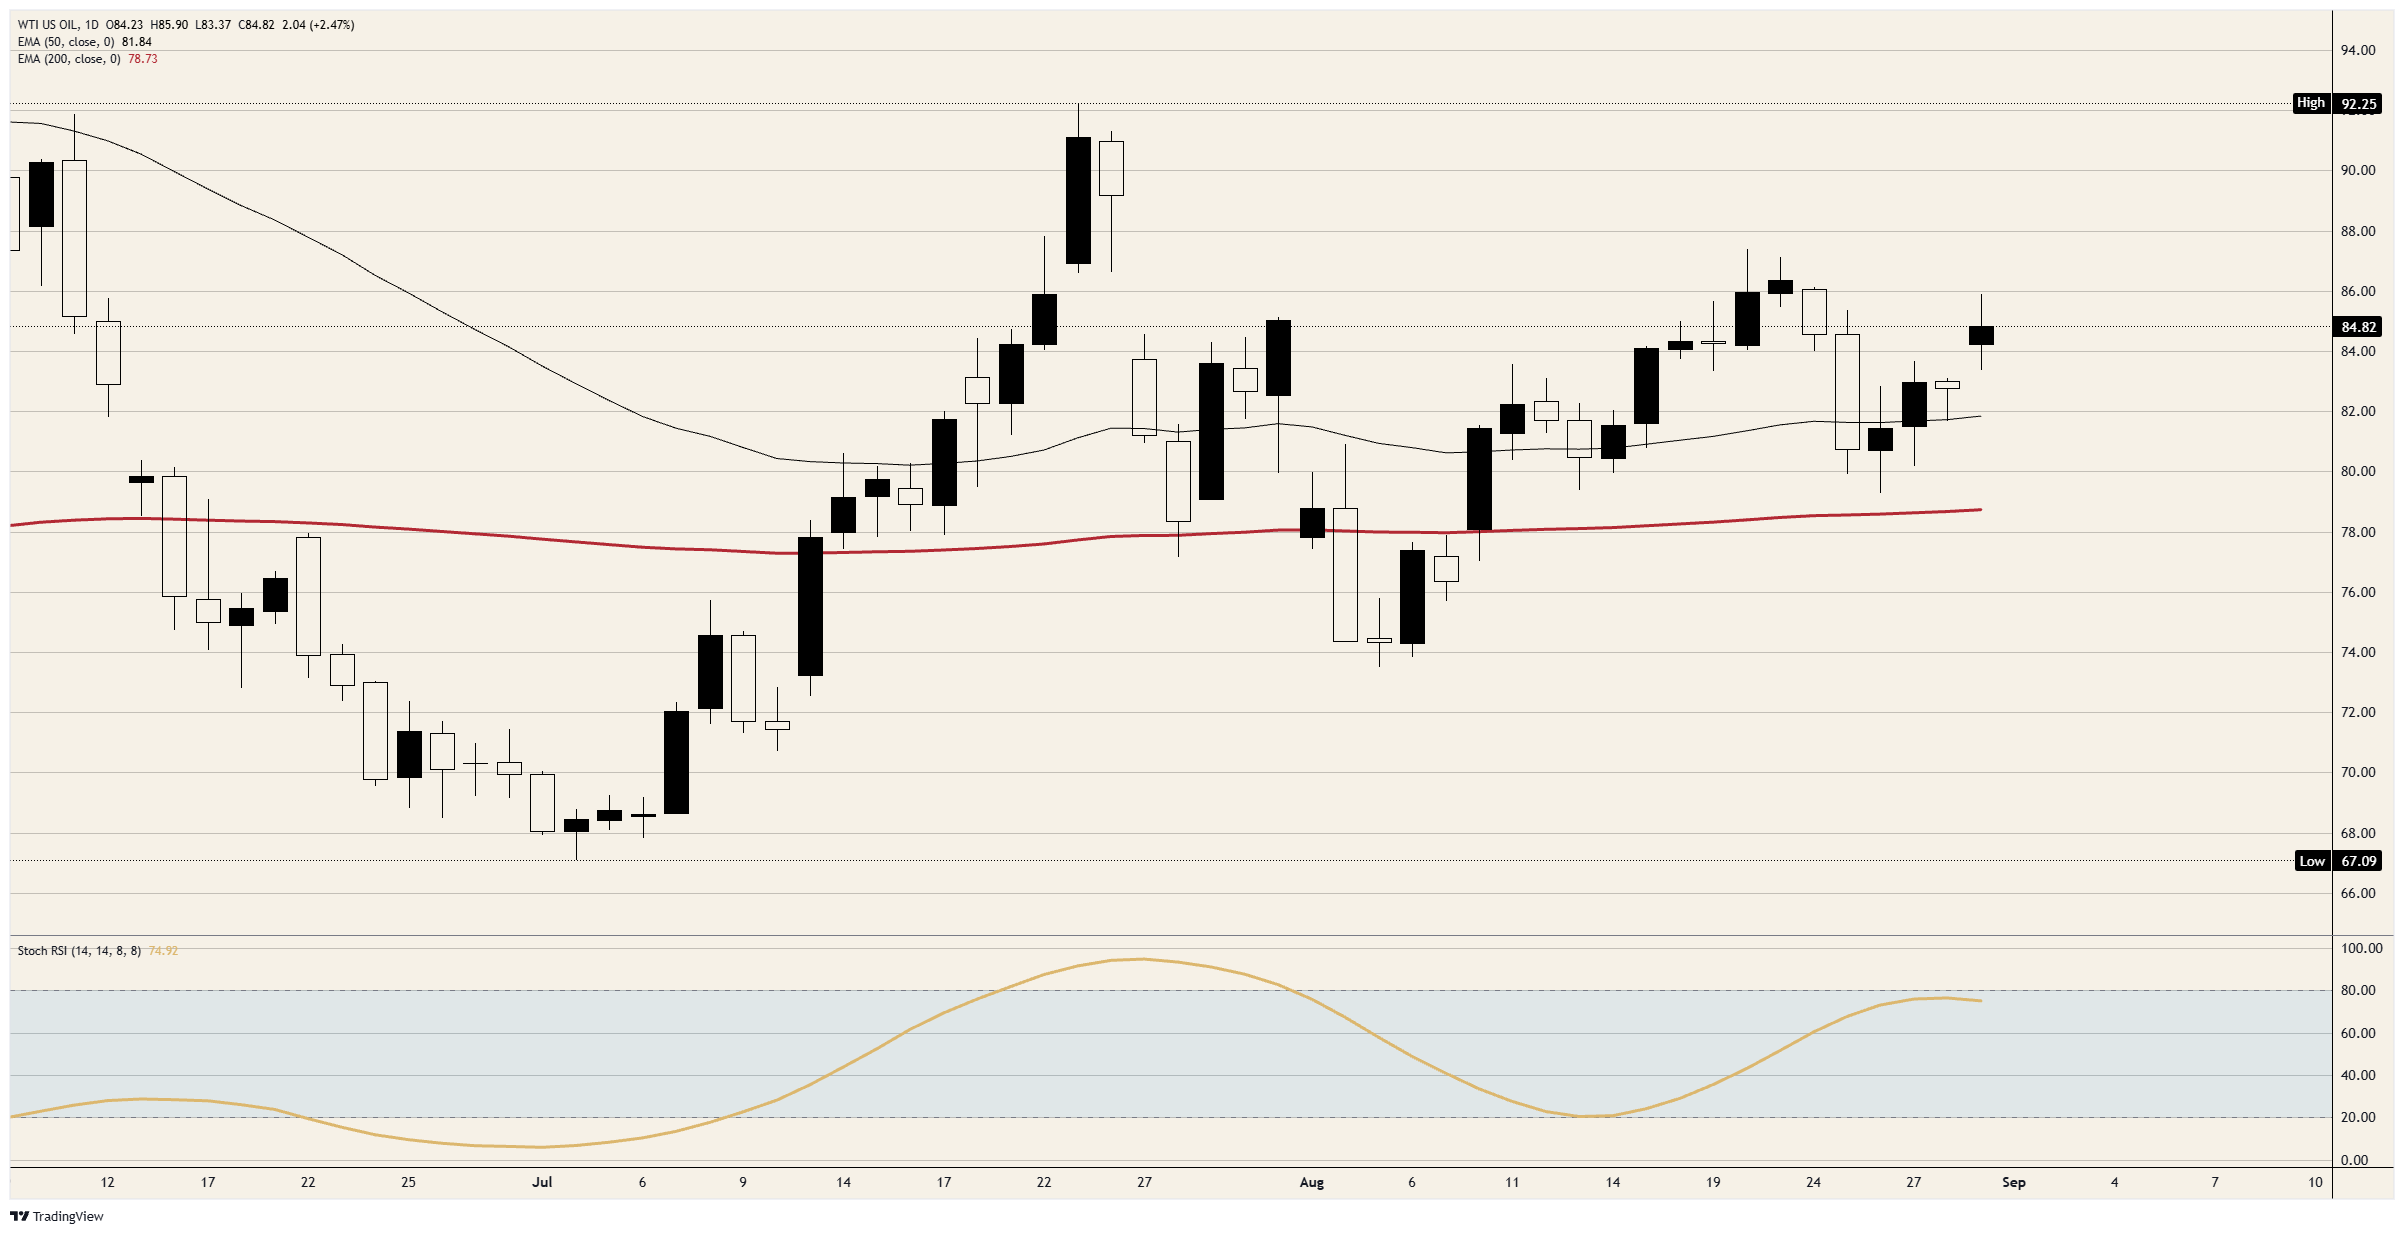
Resistance: The session high just short of $86.00 is the first line, with the late-August peak near $86.50 above it. Beyond there the August ceiling near $87.00 has turned back every attempt this month, and the July spike high just above $92.00 is the only reference left in the window.
Support: The session floor sits in the $83.50 area, with the 50-day Exponential Moving Average (EMA) near $82.00 the next line beneath it. Below there the 200-day EMA near $78.50 has not been tested since the first week of August, and the base near $74.00 anchors the month.
Bias: Bullish while the $83.50 area holds, with objectives at $86.00 and then $86.50. The daily Stochastic Relative Strength Index (Stoch RSI) near 75 is climbing toward the overbought band with room still above it, and the sequence of higher lows since early August remains intact. Invalidation on a daily close beneath
WTI daily chart
WTI Oil FAQs
WTI Oil is a type of Crude Oil sold on international markets. The WTI stands for West Texas Intermediate, one of three major types including Brent and Dubai Crude. WTI is also referred to as “light” and “sweet” because of its relatively low gravity and sulfur content respectively. It is considered a high quality Oil that is easily refined. It is sourced in the United States and distributed via the Cushing hub, which is considered “The Pipeline Crossroads of the World”. It is a benchmark for the Oil market and WTI price is frequently quoted in the media.
Like all assets, supply and demand are the key drivers of WTI Oil price. As such, global growth can be a driver of increased demand and vice versa for weak global growth. Political instability, wars, and sanctions can disrupt supply and impact prices. The decisions of OPEC, a group of major Oil-producing countries, is another key driver of price. The value of the US Dollar influences the price of WTI Crude Oil, since Oil is predominantly traded in US Dollars, thus a weaker US Dollar can make Oil more affordable and vice versa.
The weekly Oil inventory reports published by the American Petroleum Institute (API) and the Energy Information Agency (EIA) impact the price of WTI Oil. Changes in inventories reflect fluctuating supply and demand. If the data shows a drop in inventories it can indicate increased demand, pushing up Oil price. Higher inventories can reflect increased supply, pushing down prices. API’s report is published every Tuesday and EIA’s the day after. Their results are usually similar, falling within 1% of each other 75% of the time. The EIA data is considered more reliable, since it is a government agency.
OPEC (Organization of the Petroleum Exporting Countries) is a group of 12 Oil-producing nations who collectively decide production quotas for member countries at twice-yearly meetings. Their decisions often impact WTI Oil prices. When OPEC decides to lower quotas, it can tighten supply, pushing up Oil prices. When OPEC increases production, it has the opposite effect. OPEC+ refers to an expanded group that includes ten extra non-OPEC members, the most notable of which is Russia.
Nothing in this material constitutes investment advice, personal recommendation, investment research, an offer, or a solicitation to buy or sell any financial instrument. The content has been prepared without consideration of your individual investment objectives, financial situation, or needs, and should not be treated as such.
Past performance is not a reliable indicator of future performance and/or results. Forward-looking scenarios or forecasts are not a guarantee of future performance. Actual results may differ materially from those anticipated.
Mitrade makes no representation or warranty as to the accuracy or completeness of the information provided and accepts no liability for any loss arising from reliance on such information.
Recommended Articles


