



WTI struggles to hold above $90 despite material supply risks
- The oil price gives back early gains and turns slightly negative to near $89.50.
- Iran attacked three oil tankers using the unauthorized route near the Hormuz Strait.
- The OPEC+ left its oil output policy unchanged for October.
West Texas Intermediate (WTI), futures on NYMEX, turns upside down to near $89.50 during the European trading session on Monday. The oil price continues to face selling pressure above the $90 mark even as financial markets see prolonged global energy supply risks amid ongoing tensions between the United States (US) and Iran.
In the latest bout, Iran was seen attacking three oil tankers that attempted to pass the Strait of Hormuz, a critical chokepoint to almost 20% of global energy supply, over the weekend, in retaliation for the US attacking Iranian tankers, Bloomberg reported.
Analysts at Danske Bank note that renewed US-Iran strikes on commercial shipping around the Hormuz raise concerns over prolonged disruptions to Middle East energy flows.
Strategists at ING also see the oil market remaining “well-supported with little sign of a peace between the US and Iran," as geopolitical risks in the Persian Gulf intensify. They added that Tehran’s plans to enforce a new restricted zone outside the Hormuz could put “additional vessels in the Gulf of Oman at risk”.
Meanwhile, the OPEC+ kept oil output policy unchanged for October on Sunday.
According to a Reuters report, the group is likely to pause further output increases in Q4 while it reviews 2027 quota baselines.
Danske Bank cautions that “OPEC+'s ability to steer actual supply and prices remains limited as long as the Iran conflict continues to disrupt flows through the Strait of Hormuz”.
WTI Technical Analysis
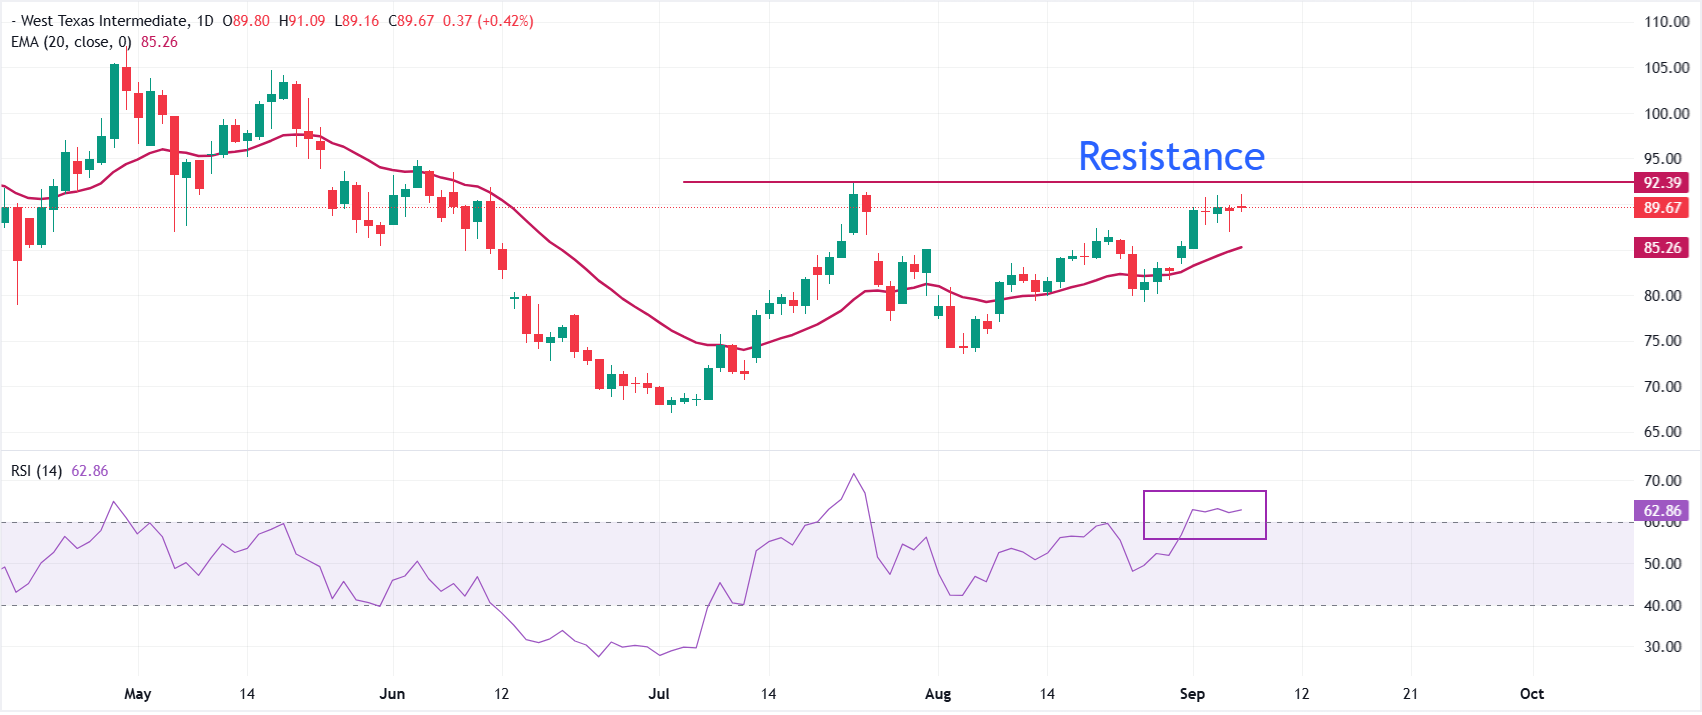
In the daily chart, WTI US Oil trades at $89.74, maintaining a bullish near-term bias as it holds well above the 20-day Exponential Moving Average (EMA) at roughly $85.27.
The rising EMA suggests an underlying uptrend, while the Relative Strength Index (RSI) around 63 points to firm but not yet overbought bullish momentum, implying that dips are likely to attract buying interest while price stays above the short-term average.
On the downside, immediate support is seen at the recent price pivot near $89.74, with stronger technical backing at the 20-day EMA around $85.27 if a deeper pullback unfolds. On the upside, the intraday high at $91.09 is the immediate resistance zone, followed by an almost three-month high at $92.25.
(The technical analysis of this story was written with the help of an AI tool. Know more.)
WTI Oil FAQs
WTI Oil is a type of Crude Oil sold on international markets. The WTI stands for West Texas Intermediate, one of three major types including Brent and Dubai Crude. WTI is also referred to as “light” and “sweet” because of its relatively low gravity and sulfur content respectively. It is considered a high quality Oil that is easily refined. It is sourced in the United States and distributed via the Cushing hub, which is considered “The Pipeline Crossroads of the World”. It is a benchmark for the Oil market and WTI price is frequently quoted in the media.
Like all assets, supply and demand are the key drivers of WTI Oil price. As such, global growth can be a driver of increased demand and vice versa for weak global growth. Political instability, wars, and sanctions can disrupt supply and impact prices. The decisions of OPEC, a group of major Oil-producing countries, is another key driver of price. The value of the US Dollar influences the price of WTI Crude Oil, since Oil is predominantly traded in US Dollars, thus a weaker US Dollar can make Oil more affordable and vice versa.
The weekly Oil inventory reports published by the American Petroleum Institute (API) and the Energy Information Agency (EIA) impact the price of WTI Oil. Changes in inventories reflect fluctuating supply and demand. If the data shows a drop in inventories it can indicate increased demand, pushing up Oil price. Higher inventories can reflect increased supply, pushing down prices. API’s report is published every Tuesday and EIA’s the day after. Their results are usually similar, falling within 1% of each other 75% of the time. The EIA data is considered more reliable, since it is a government agency.
OPEC (Organization of the Petroleum Exporting Countries) is a group of 12 Oil-producing nations who collectively decide production quotas for member countries at twice-yearly meetings. Their decisions often impact WTI Oil prices. When OPEC decides to lower quotas, it can tighten supply, pushing up Oil prices. When OPEC increases production, it has the opposite effect. OPEC+ refers to an expanded group that includes ten extra non-OPEC members, the most notable of which is Russia.
Nothing in this material constitutes investment advice, personal recommendation, investment research, an offer, or a solicitation to buy or sell any financial instrument. The content has been prepared without consideration of your individual investment objectives, financial situation, or needs, and should not be treated as such.
Past performance is not a reliable indicator of future performance and/or results. Forward-looking scenarios or forecasts are not a guarantee of future performance. Actual results may differ materially from those anticipated.
Mitrade makes no representation or warranty as to the accuracy or completeness of the information provided and accepts no liability for any loss arising from reliance on such information.
Recommended Articles


