



Have Fed Rate Hike Headwinds Been Priced In? Gold Rebounds Strongly Toward $4,400, Poised for a New Rally
TradingKey - As of the European session on September 18, gold prices (XAUUSD) extended Thursday's rebound, rising strongly in intraday trading to $4,399.75 today, just shy of the $4,400 psychological mark. Following the Federal Reserve's announcement of a 25-basis-point rate hike on Wednesday, spot gold plunged rapidly from above $4,365 to a low of $4,235; subsequently, gold prices rebounded over two consecutive trading sessions, gaining nearly $150.
The Fed raised the target range for the federal funds rate to 3.75%-4.00% this time and hinted that further rate hikes remain possible in the future, which theoretically exerts pressure on gold, a non-yielding asset. However, the 25-basis-point rate hike had already been widely anticipated by the market. Gold's rapid decline to around $4,235 after the decision was more like a short-term repricing following the concentrated release of hawkish expectations. As the rate hike materialized, some previously established gold short positions began to cover. Reuters cited market views saying that as rate hike expectations continued to heat up, the market may have engaged in noticeable front-running, and these positions began adjusting after the decision was finalized.
Meanwhile, gold's rebound was also supported by a pullback in the US dollar and US Treasury yields. On Thursday, the US dollar pulled back from a seven-week high, while the 10-year US Treasury yield moved lower. Coupled with a continuous weakness in oil prices, market concerns about energy prices driving inflation further worse eased somewhat. Spot gold rose over 2% that day, reclaiming $4,360. This indicates that the initial shock of the Fed's rate hike itself on gold prices has diminished significantly, and market focus is shifting toward whether future rate hikes can truly be sustained.
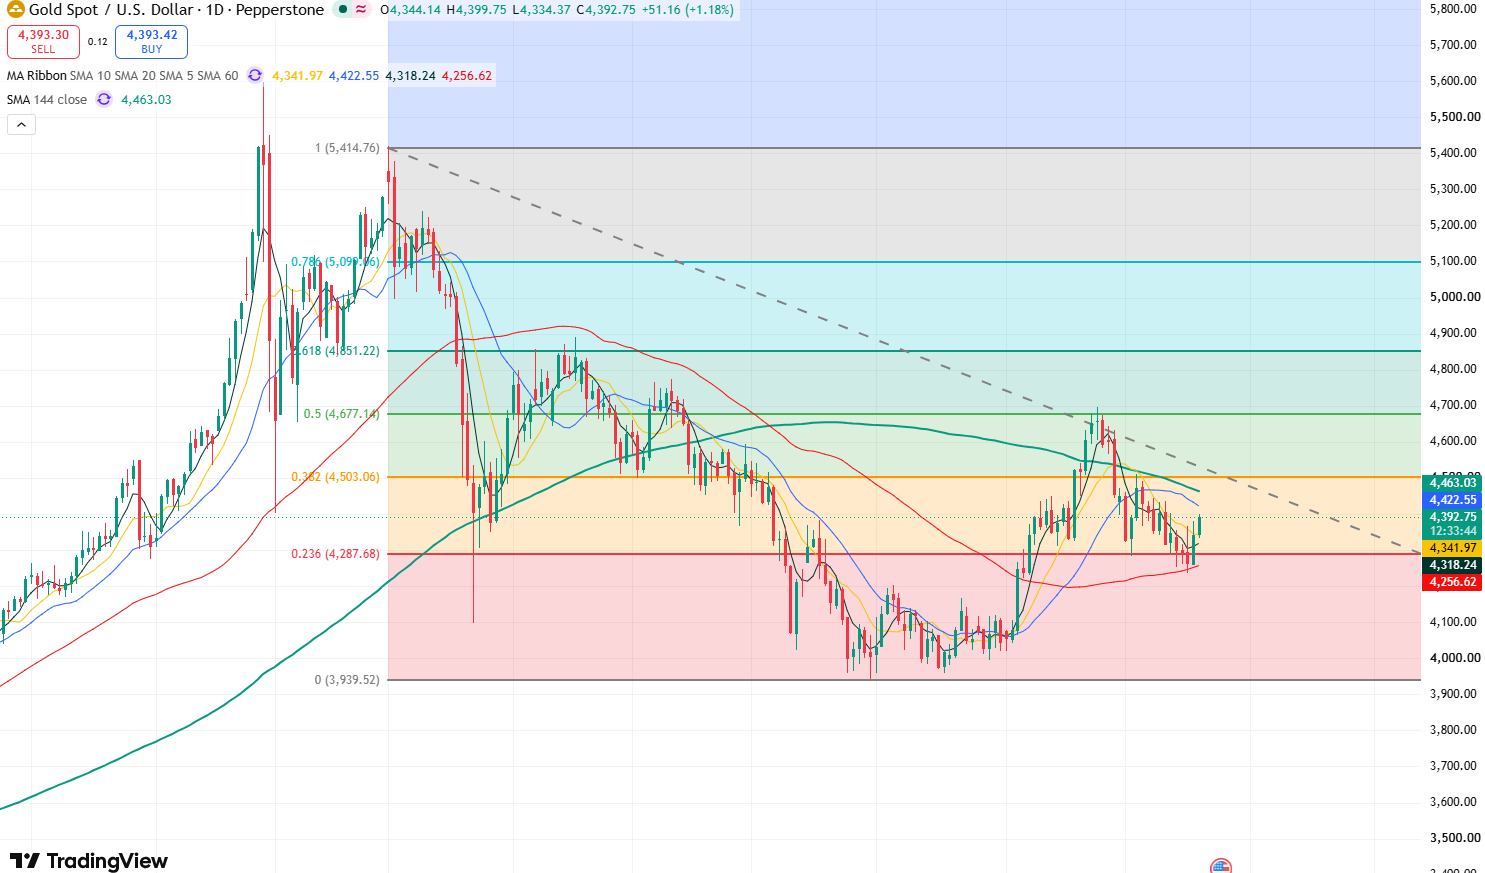
Gold Price Daily Chart, Source: TradingView
From gold's daily chart, the price slumped to near $4,235 following the Fed's interest rate decision on Wednesday before starting a rapid rebound. The 4-hour chart shows a V-shaped reversal pattern, reclaiming $4,300 and $4,350, indicating a significant strengthening of buying interest at lower levels.
At present, the most critical short-term resistance has shifted to the $4,400-$4,440 area. The $4,400 mark is both a psychological round number and an important area previously contested multiple times. If gold can effectively break through and hold firm above $4,440, this rebound starting from $4,235 may extend further toward $4,500-$4,510. If gold breaks above $4,510, it will further open up upside space toward $4,700. Only when gold successfully breaks above and consolidates above $4,700 will there be hope of resuming the medium-to-long-term bullish trend and further challenging the $5,000 mark.
Nothing in this material constitutes investment advice, personal recommendation, investment research, an offer, or a solicitation to buy or sell any financial instrument. The content has been prepared without consideration of your individual investment objectives, financial situation, or needs, and should not be treated as such.
Past performance is not a reliable indicator of future performance and/or results. Forward-looking scenarios or forecasts are not a guarantee of future performance. Actual results may differ materially from those anticipated.
Mitrade makes no representation or warranty as to the accuracy or completeness of the information provided and accepts no liability for any loss arising from reliance on such information.
Recommended Articles


