


CFDs are complex instruments and come with a high risk of losing money rapidly due to leverage. 80% of retail investor accounts lose money when trading CFDs with this provider. You should consider whether you understand how CFDs work and whether you can afford to take the high risk of losing your money.

SanDisk Stock Price Prediction: Correction Over? Up Over 6% in a Single Day, SNDK Stock Poised to Challenge $2,000 Again

Source Tradingkey

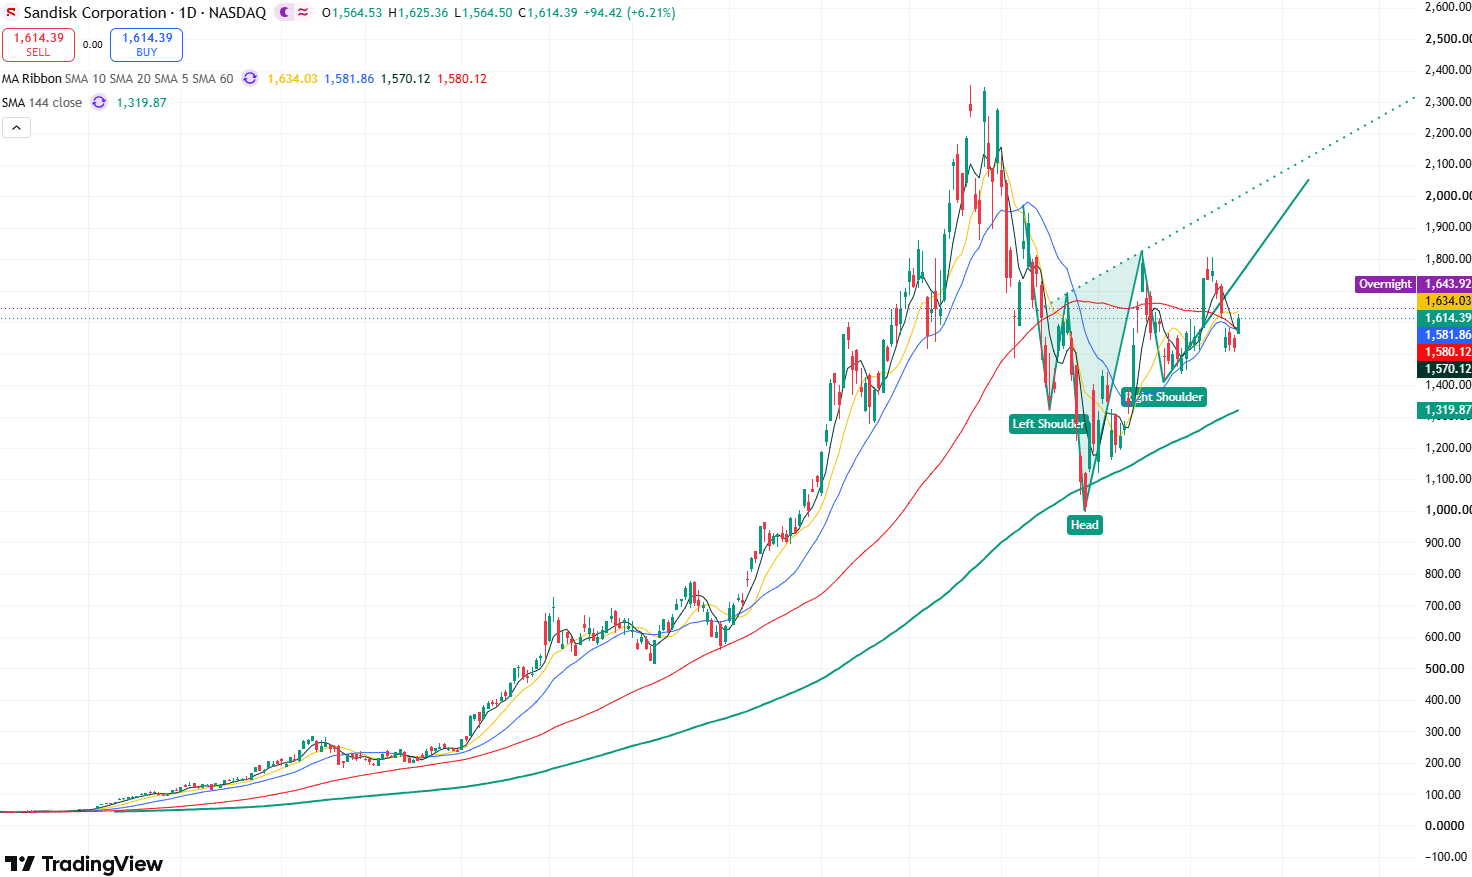
TradingKey - As of the close on September 17 Eastern Time, SanDisk (SNDK) stock rose 6.21% in a single day to $1,614.39, reaching an intraday high of $1,625.36, ending its previous continuous pullback.
sndk-b65e819ba7994b39b890c4023dee1ff3

SanDisk daily stock price chart, Source: TradingView

Looking at the daily chart of SanDisk's stock price, the stock has reclaimed the 20-day moving average ($1,582) and the 60-day moving average ($1,580), improving its short-term bullish structure. Meanwhile, the candlestick remains above the 144-day moving average, showing that the medium- to long-term bullish trend has not been damaged.

In terms of technical indicators, the Relative Strength Index (RSI) is at 52.85, in a neutral-to-bullish zone, indicating that market bullish sentiment holds the upper hand and a short-term price increase is likely. However, short-term MACD momentum has not yet fully recovered, suggesting that the current move is closer to a post-decline rebound and repair rather than a confirmed start of a new primary uptrend.

Currently, the overall candlestick structure has formed an inverse head-and-shoulders pattern, with the future trend remaining bullish. The first upside target will test the August 17 high of $1,827.99. If the price breaks through and consolidates above this level, it will open up upside room toward the $2,000 mark.

On the downside, key attention should be paid to the August 24 low of $1,416.56. If the stock falls below this level, it may test support near the 144-day moving average ($1,320). If this level is lost, the price could drop further toward the $1,000 mark.

Disclaimer: The content available on Mitrade Insights is provided for informational and marketing purposes only. It has not been prepared in accordance with legal requirements designed to promote the independence of investment research and is not subject to any prohibition on dealing ahead of the dissemination of investment research
Nothing in this material constitutes investment advice, personal recommendation, investment research, an offer, or a solicitation to buy or sell any financial instrument. The content has been prepared without consideration of your individual investment objectives, financial situation, or needs, and should not be treated as such.
Past performance is not a reliable indicator of future performance and/or results. Forward-looking scenarios or forecasts are not a guarantee of future performance. Actual results may differ materially from those anticipated.
Mitrade makes no representation or warranty as to the accuracy or completeness of the information provided and accepts no liability for any loss arising from reliance on such information.
placeholder
Meme Coins Price Prediction: Dogecoin, Shiba Inu, Pepe in a freefall, echoing Bitcoin’s dropMeme coins, such as Dogecoin (DOGE), Shiba Inu (SHIB), and Pepe (PEPE), extend the decline from last week, with a roughly 3% drop on Monday. The meme coins trade below the crucial moving averages, aiming for the immediate support to potentially reset the momentum.
Author  FXStreet
Jan 19, Mon
Meme coins, such as Dogecoin (DOGE), Shiba Inu (SHIB), and Pepe (PEPE), extend the decline from last week, with a roughly 3% drop on Monday. The meme coins trade below the crucial moving averages, aiming for the immediate support to potentially reset the momentum.
placeholder
Silver price today: Silver rises, according to FXStreet dataSilver prices (XAG/USD) rose on Monday, according to FXStreet data. Silver trades at $81.78 per troy ounce, up 5.54% from the $77.48 it cost on Friday.
Author  FXStreet
Feb 09, Mon
Silver prices (XAG/USD) rose on Monday, according to FXStreet data. Silver trades at $81.78 per troy ounce, up 5.54% from the $77.48 it cost on Friday.
placeholder
WTI drops below $64.00, Middle East tensions in focusWest Texas Intermediate (WTI), the US crude oil benchmark, is trading around $63.80 during the early Asian trading hours on Tuesday. The WTI price falls as concerns about supply disruptions in the Middle East have faded.
Author  FXStreet
Feb 10, Tue
West Texas Intermediate (WTI), the US crude oil benchmark, is trading around $63.80 during the early Asian trading hours on Tuesday. The WTI price falls as concerns about supply disruptions in the Middle East have faded.
placeholder
The Trumponomics Ebook: Oil Price Volatility in the Iran War Understand how the Strait of Hormuz shock moved markets, and what CFD traders watched next.
Author  Rachel Weiss
Aug 18, Tue
Understand how the Strait of Hormuz shock moved markets, and what CFD traders watched next.
placeholder
Ripple and Stellar outlook: XRP ETF demand strengthens, XLM RWA market hits $4 billion milestoneRipple (XRP) and Stellar (XLM) are showing signs of recovery on Tuesday after rebounding slightly the previous day, following double-digit corrections last week.
Author  FXStreet
Sep 01, Tue
Ripple (XRP) and Stellar (XLM) are showing signs of recovery on Tuesday after rebounding slightly the previous day, following double-digit corrections last week.
goTop
quote