CFDs are complex instruments and come with a high risk of losing money rapidly due to leverage. 74% of retail investor accounts lose money when trading CFDs with this provider. You should consider whether you understand how CFDs work and whether you can afford to take the high risk of losing your money.

Memecoins Price Prediction: Dogecoin, Shiba Inu test key resistance levels ahead of FOMC meeting

Source Fxstreet
  • Dogecoin could test $0.180 if it flips a descending trendline resistance and the 20-day EMA.
  • SHIB eyes a rise to $0.0000097, but must clear $0.0000087 and the 50-day EMA.
  • A rate cut in the upcoming FOMC meeting could put DOGE and SHIB under pressure.

Memecoins Dogecoin (DOGE) and Shiba Inu (SHIB) are testing key resistance levels ahead of the Federal Open Market Committee (FOMC) interest rate decision on Wednesday. With market participants expecting a 25-basis-point rate cut, both memecoins could face pressure near key levels.

DOGE could flip descending trendline resistance

Dogecoin is looking to rise above the $0.142 level, but it faces a key descending trendline resistance extending from October 27. The resistance is strengthened by the 20-day Exponential Moving Average (EMA), which DOGE has failed to sustain a rise above since the October 10 crash.

A firm move above the descending trendline could see DOGE rise past the 50-day EMA to test the $0.180 resistance.

DOGE/USDT daily chart

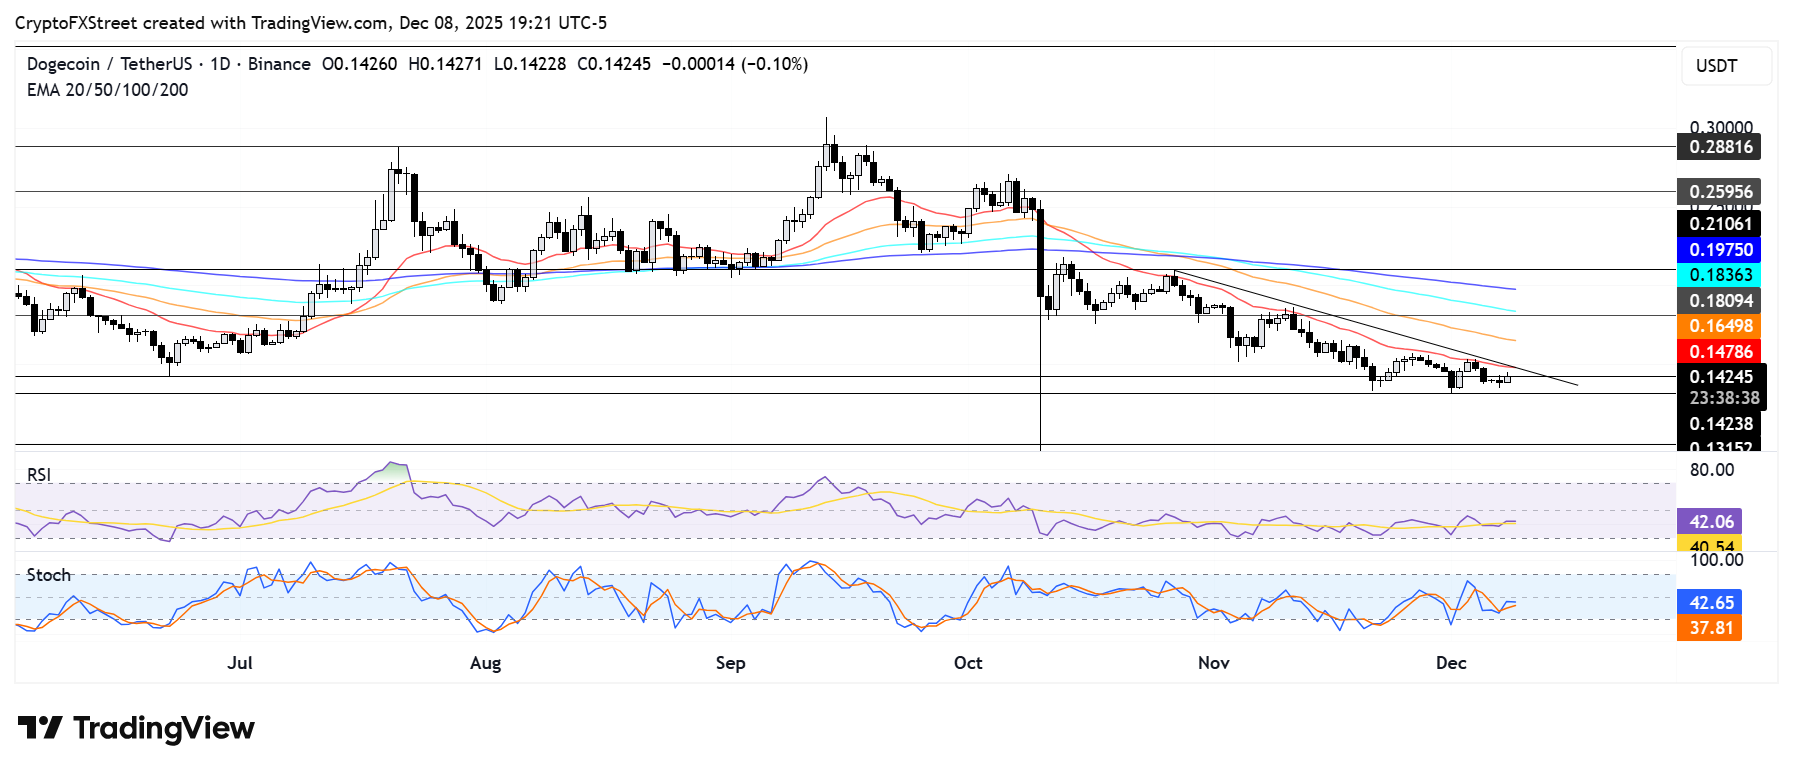
On the downside, DOGE could find support near $0.131. The top memecoin risks a further decline to the $0.100 psychologically important level if it breaks below $0.131.

The Relative Strength Index (RSI) and Stochastic Oscillator (Stoch) are approaching their neutral level. A firm cross above will flip the momentum toward bullish dominance.

SHIB eyes $0.0000097 but faces EMAs’ test

Shiba Inu is testing the $0.0000087 resistance level. The level coincides with the 20-day Exponential Moving Average (EMA), which has proven a critical resistance over the past two months. 

A move above $0.0000087 and the 20-day EMA could see SHIB rise to test the $0.0000097 resistance. However, it has to clear the 50-day EMA on the way up. Further up, SHIB faces resistance at the 100-day and 200-day EMAs before it can stage a move to $0.0000123.

SHIB/USDT daily chart

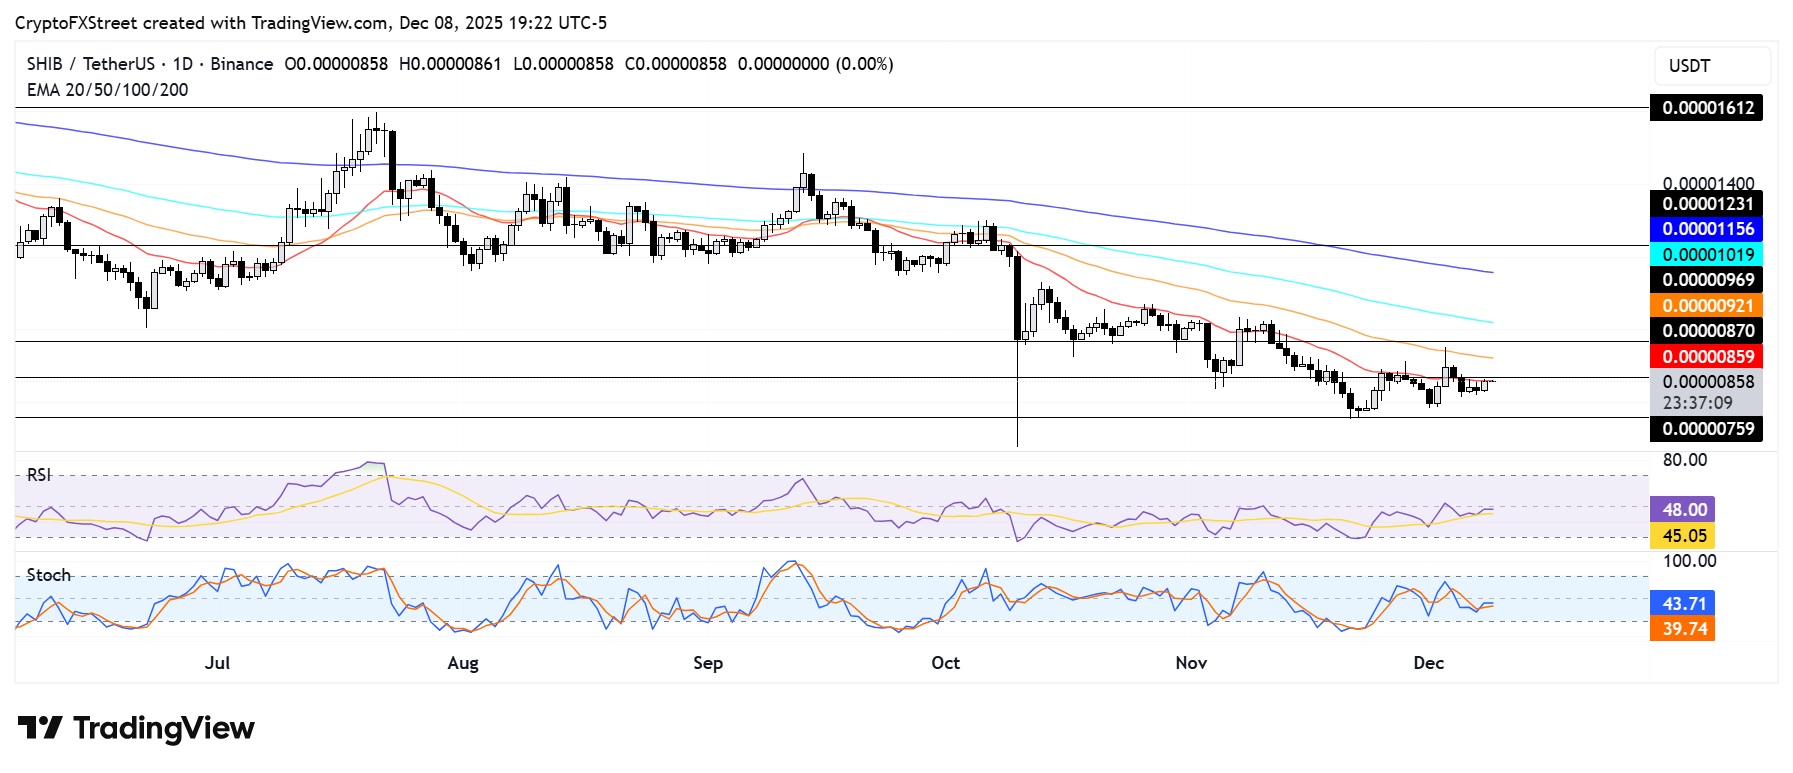
On the downside, SHIB could decline to $0.0000076 if it sees a rejection at $0.0000087.

The Relative Strength Index (RSI) and Stochastic Oscillator (Stoch) are testing their neutral levels. A cross above will accelerate a dominant bullish momentum.

Disclaimer: The content available on Mitrade Insights is provided for informational and marketing purposes only. It has not been prepared in accordance with legal requirements designed to promote the independence of investment research and is not subject to any prohibition on dealing ahead of the dissemination of investment research
Nothing in this material constitutes investment advice, personal recommendation, investment research, an offer, or a solicitation to buy or sell any financial instrument. The content has been prepared without consideration of your individual investment objectives, financial situation, or needs, and should not be treated as such.
Past performance is not a reliable indicator of future performance and/or results. Forward-looking scenarios or forecasts are not a guarantee of future performance. Actual results may differ materially from those anticipated.
Mitrade makes no representation or warranty as to the accuracy or completeness of the information provided and accepts no liability for any loss arising from reliance on such information.
placeholder
WTI hovers below $59.00 as US-Iran tensions ease, weekly loss loomsWest Texas Intermediate (WTI) Oil price moves little after two days of more than 3% losses, trading around $58.80 during the Asian hours on Friday. WTI price faces challenges as geopolitical risk premiums faded following easing fears of a possible US military strike on Iran.
Author  FXStreet
14 hours ago
West Texas Intermediate (WTI) Oil price moves little after two days of more than 3% losses, trading around $58.80 during the Asian hours on Friday. WTI price faces challenges as geopolitical risk premiums faded following easing fears of a possible US military strike on Iran.
placeholder
Cardano Price Forecast: Rejection at 50-day EMA tightens bearish gripCardano (ADA) edges lower by over 3% at press time on Thursday, extending the second rejection from the 50-day Exponential Moving Average (EMA) so far this month. A bearish side in the retail interest leads to a decline in Open Interest and lowered funding rates.
Author  FXStreet
Yesterday 07: 55
Cardano (ADA) edges lower by over 3% at press time on Thursday, extending the second rejection from the 50-day Exponential Moving Average (EMA) so far this month. A bearish side in the retail interest leads to a decline in Open Interest and lowered funding rates.
placeholder
Hedera Price Forecast: HBAR extends gains as ETF inflows boost sentiment Hedera (HBAR) is trading at around $0.127 on Wednesday, approaching a key resistance level; a breakout above this level would signal further gains. Institutional demand continues to strengthen this week, with spot HBAR Exchange-Traded Funds (ETFs) recording three consecutive days of inflows.
Author  FXStreet
Jan 14, Wed
Hedera (HBAR) is trading at around $0.127 on Wednesday, approaching a key resistance level; a breakout above this level would signal further gains. Institutional demand continues to strengthen this week, with spot HBAR Exchange-Traded Funds (ETFs) recording three consecutive days of inflows.
placeholder
WTI declines below $61.00 as US stockpile builds, Venezuelan exports resumeWest Texas Intermediate (WTI), the US crude oil benchmark, is trading around $60.70 during the Asian trading hours on Wednesday. The WTI price declines as Venezuela resumes exports and the American Petroleum Institute (API) shows a big build in US crude inventories.
Author  FXStreet
Jan 14, Wed
West Texas Intermediate (WTI), the US crude oil benchmark, is trading around $60.70 during the Asian trading hours on Wednesday. The WTI price declines as Venezuela resumes exports and the American Petroleum Institute (API) shows a big build in US crude inventories.
placeholder
BNB Price Forecast: On the verge of breakout as derivatives traders bet on gainsBNB (BNB), formerly known as Binance Coin, is trading above $910 at the time of writing on Tuesday, nearing the upper consolidation boundary. The two months of sideways price action could end, with improving sentiment in the derivatives market suggesting potential upside.
Author  FXStreet
Jan 13, Tue
BNB (BNB), formerly known as Binance Coin, is trading above $910 at the time of writing on Tuesday, nearing the upper consolidation boundary. The two months of sideways price action could end, with improving sentiment in the derivatives market suggesting potential upside.
Related Instrument
goTop
quote