CFDs are complex instruments and come with a high risk of losing money rapidly due to leverage. 74% of retail investor accounts lose money when trading CFDs with this provider. You should consider whether you understand how CFDs work and whether you can afford to take the high risk of losing your money.

Pi Network Price Forecast: PI consolidates as momentum shift flashes downside risk

Source Fxstreet
  • Pi Network drifts above $0.20 on Friday, stabilizing after a 2% drop on the previous day.
  • PiScan data shows large PI deposits to exchanges as Pioneers trim holdings.
  • The technical outlook for PI flashes downside bias as the MACD indicator signals a bearish crossover.

Pi Network (PI) is trading near the $0.2000 psychological support level at press time on Friday, extending its nearly month-long consolidation. Large deposits over centralized exchanges accepting PI tokens suggest a sell-side bias among holders. Technically, Pi Network flashes downside bias as the MACD indicator inches toward a bearish crossover.

Large PI deposits warn of increased overhead pressure

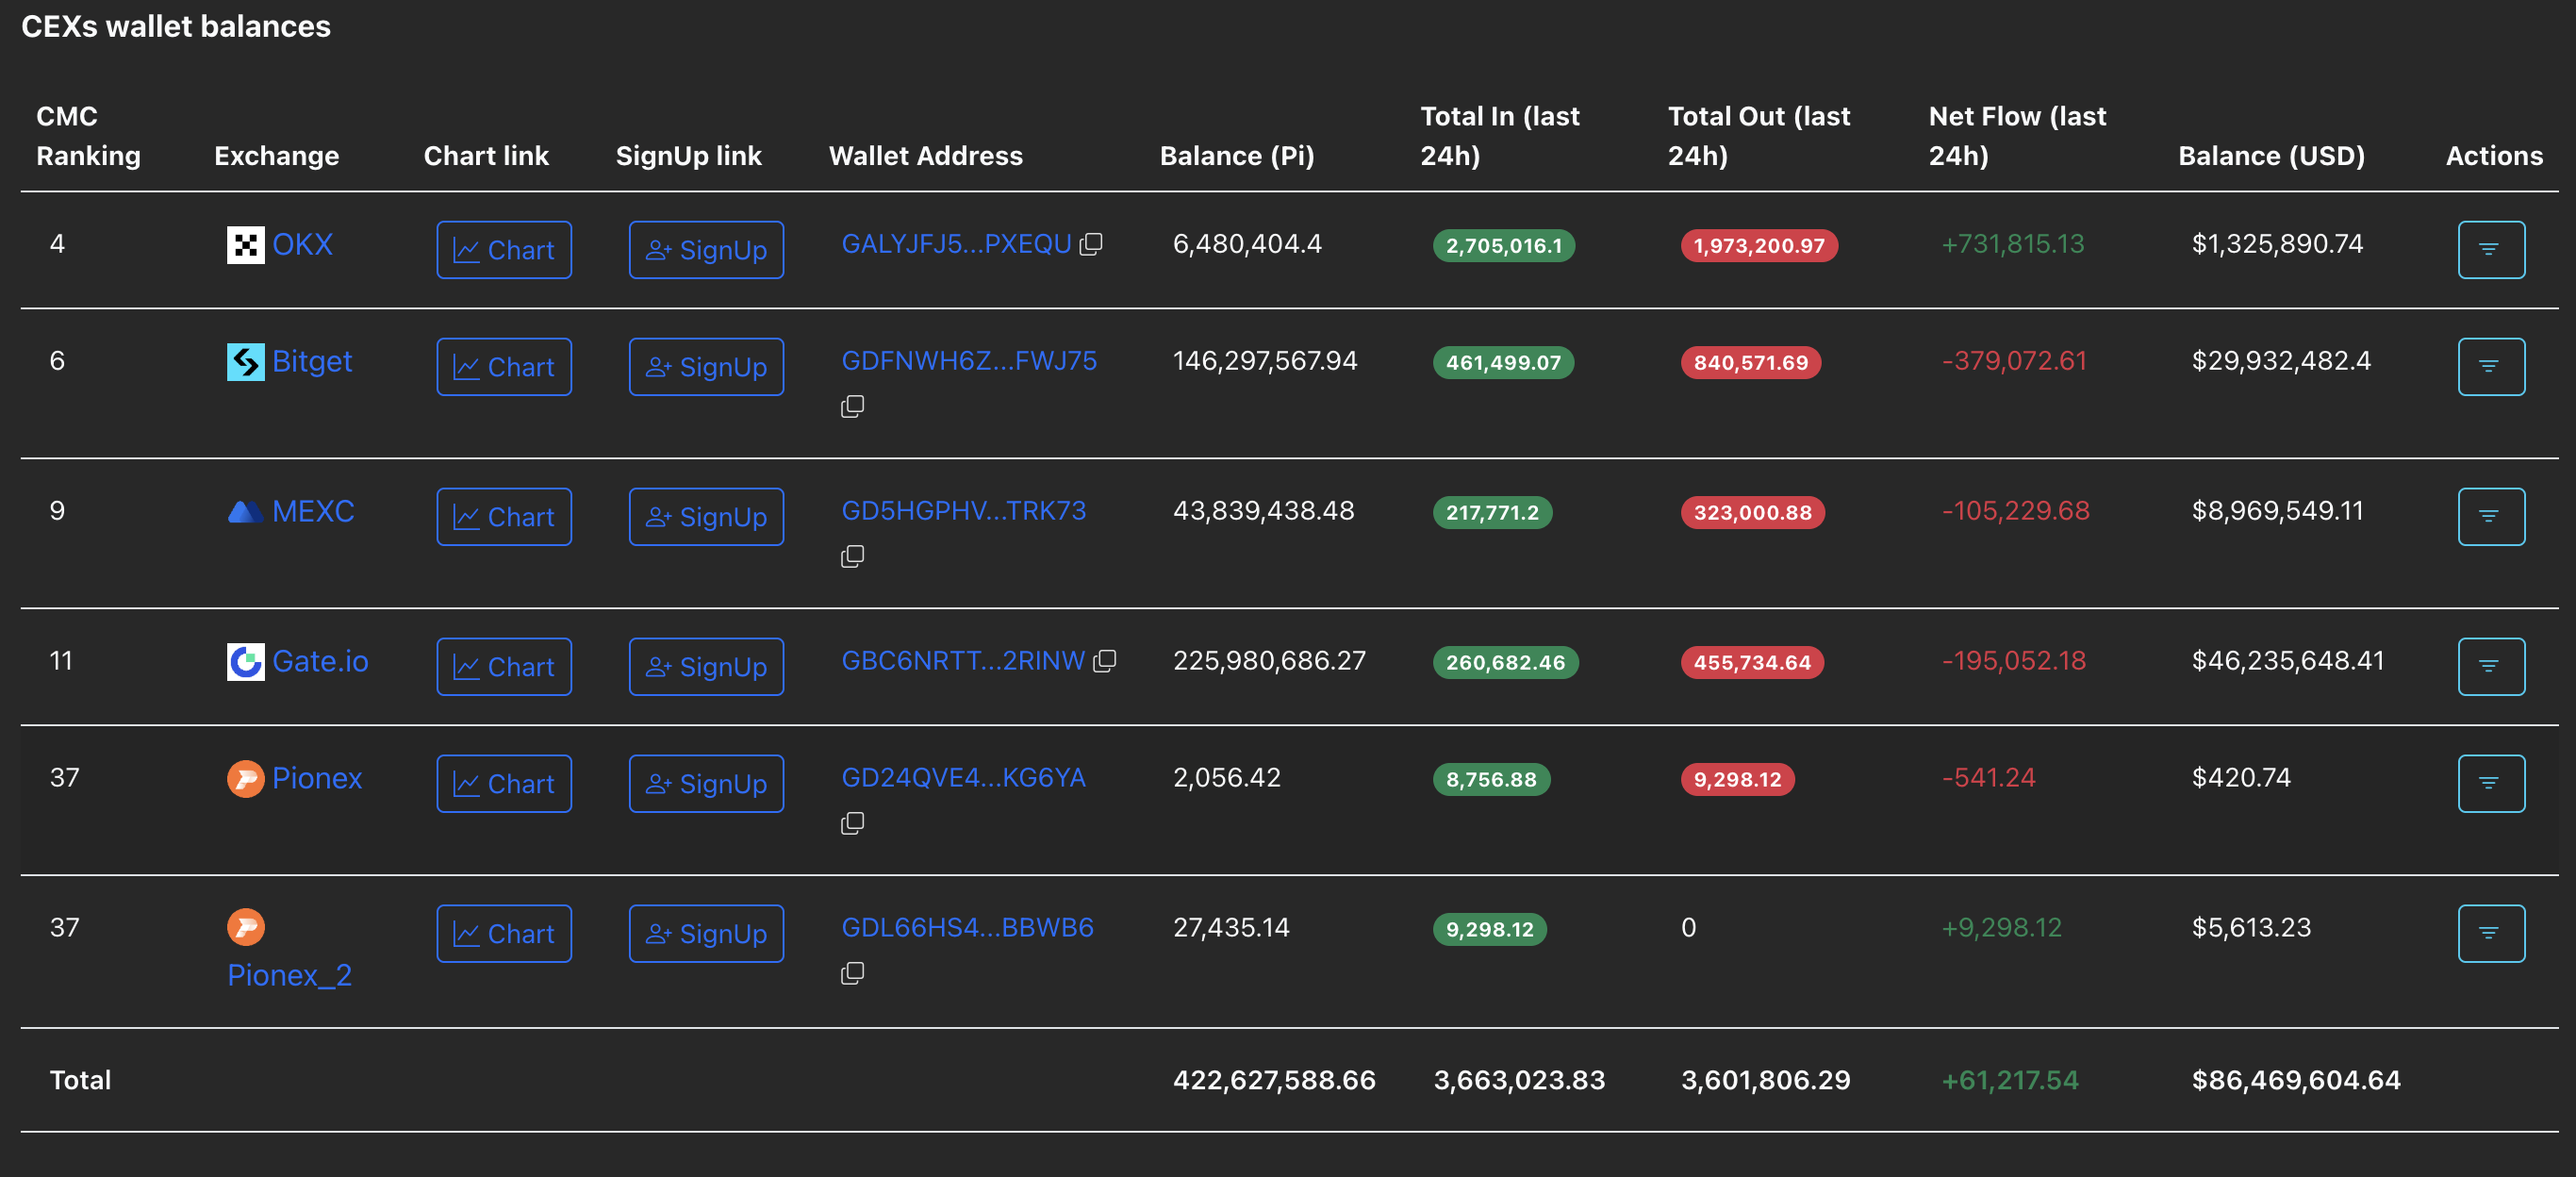
PiScan data shows that two out of the three largest transactions on Pi Network over the last 24 hours involved deposits of 1.03 million PI tokens. This suggests a decline in large wallet holders, confirming a decline in sentiment. 

Pi Network transactions data. Source: PiScan

The CEX wallet balances have effectively increased by 61,217 PI tokens, with OKX exchange recording the largest inflow of 2.70 million PI tokens. This increase in CEX reserves could reflect rising potential supply pressure. 

CEX reserves data. Source: PiScan.

Will Pi Network sustain above a key support?

Pi Network trades above $0.2000 at press time on Friday, but faces headwinds from the 20-day and 50-day Exponential Moving Averages (EMAs) at $0.2082 and $0.2141, respectively. If PI exceeds the 20-day and the 50-day EMAs, and the December 19 high at $0.2177, it would improve the upside potential, opening the path toward the September 23 low at $0.2613, which is a support-turned-resistance level. 

However, the Moving Average Convergence Divergence (MACD) indicator contracts toward the signal line on the daily chart, risking a bearish crossover. The declining trend in histograms toward the zero line suggests fading bullish momentum. 

At the same time, the Relative Strength Index (RSI) is at 41, consistent with the increasing bearish pressure. 

PI/USDT daily price chart.

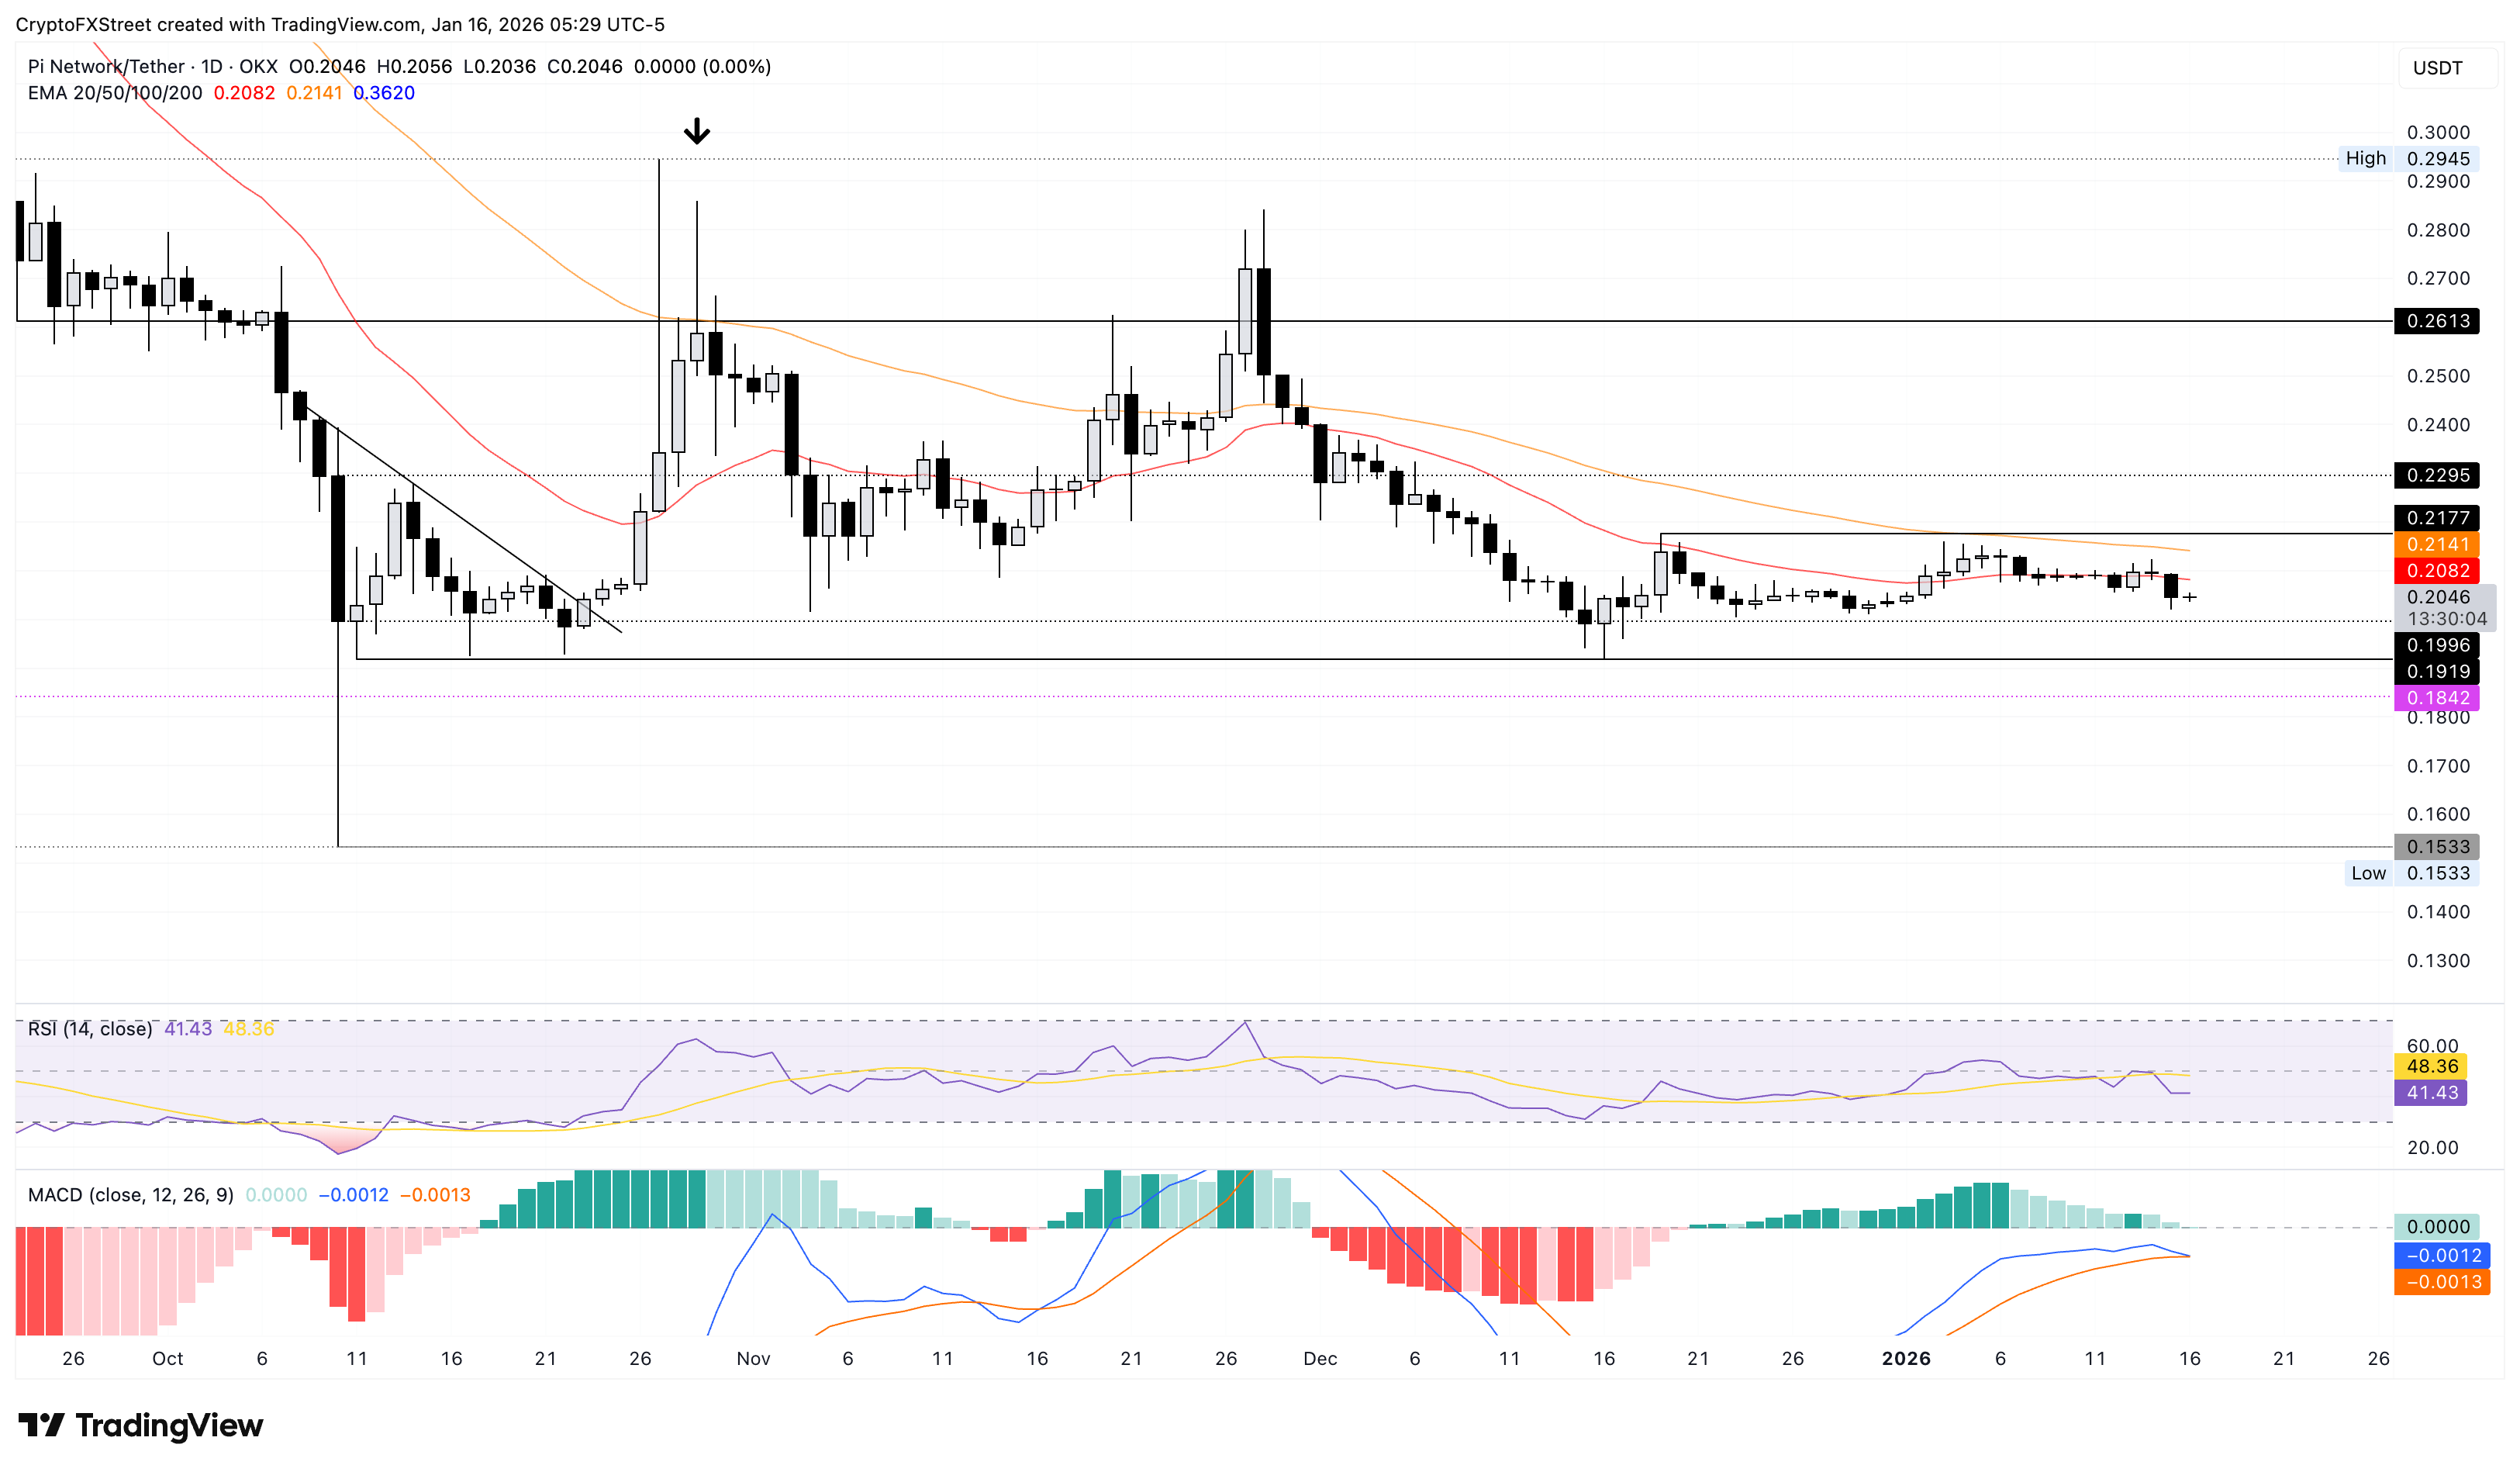
A close below the $0.2000 could increase the selling pressure, targeting $0.1919 and a deeper zone at $0.1842, marked by the October 11 and September 22 lows, respectively.

Disclaimer: The content available on Mitrade Insights is provided for informational and marketing purposes only. It has not been prepared in accordance with legal requirements designed to promote the independence of investment research and is not subject to any prohibition on dealing ahead of the dissemination of investment research
Nothing in this material constitutes investment advice, personal recommendation, investment research, an offer, or a solicitation to buy or sell any financial instrument. The content has been prepared without consideration of your individual investment objectives, financial situation, or needs, and should not be treated as such.
Past performance is not a reliable indicator of future performance and/or results. Forward-looking scenarios or forecasts are not a guarantee of future performance. Actual results may differ materially from those anticipated.
Mitrade makes no representation or warranty as to the accuracy or completeness of the information provided and accepts no liability for any loss arising from reliance on such information.
placeholder
WTI hovers below $59.00 as US-Iran tensions ease, weekly loss loomsWest Texas Intermediate (WTI) Oil price moves little after two days of more than 3% losses, trading around $58.80 during the Asian hours on Friday. WTI price faces challenges as geopolitical risk premiums faded following easing fears of a possible US military strike on Iran.
Author  FXStreet
12 hours ago
West Texas Intermediate (WTI) Oil price moves little after two days of more than 3% losses, trading around $58.80 during the Asian hours on Friday. WTI price faces challenges as geopolitical risk premiums faded following easing fears of a possible US military strike on Iran.
placeholder
Cardano Price Forecast: Rejection at 50-day EMA tightens bearish gripCardano (ADA) edges lower by over 3% at press time on Thursday, extending the second rejection from the 50-day Exponential Moving Average (EMA) so far this month. A bearish side in the retail interest leads to a decline in Open Interest and lowered funding rates.
Author  FXStreet
Yesterday 07: 55
Cardano (ADA) edges lower by over 3% at press time on Thursday, extending the second rejection from the 50-day Exponential Moving Average (EMA) so far this month. A bearish side in the retail interest leads to a decline in Open Interest and lowered funding rates.
placeholder
Hedera Price Forecast: HBAR extends gains as ETF inflows boost sentiment Hedera (HBAR) is trading at around $0.127 on Wednesday, approaching a key resistance level; a breakout above this level would signal further gains. Institutional demand continues to strengthen this week, with spot HBAR Exchange-Traded Funds (ETFs) recording three consecutive days of inflows.
Author  FXStreet
Jan 14, Wed
Hedera (HBAR) is trading at around $0.127 on Wednesday, approaching a key resistance level; a breakout above this level would signal further gains. Institutional demand continues to strengthen this week, with spot HBAR Exchange-Traded Funds (ETFs) recording three consecutive days of inflows.
placeholder
WTI declines below $61.00 as US stockpile builds, Venezuelan exports resumeWest Texas Intermediate (WTI), the US crude oil benchmark, is trading around $60.70 during the Asian trading hours on Wednesday. The WTI price declines as Venezuela resumes exports and the American Petroleum Institute (API) shows a big build in US crude inventories.
Author  FXStreet
Jan 14, Wed
West Texas Intermediate (WTI), the US crude oil benchmark, is trading around $60.70 during the Asian trading hours on Wednesday. The WTI price declines as Venezuela resumes exports and the American Petroleum Institute (API) shows a big build in US crude inventories.
placeholder
BNB Price Forecast: On the verge of breakout as derivatives traders bet on gainsBNB (BNB), formerly known as Binance Coin, is trading above $910 at the time of writing on Tuesday, nearing the upper consolidation boundary. The two months of sideways price action could end, with improving sentiment in the derivatives market suggesting potential upside.
Author  FXStreet
Jan 13, Tue
BNB (BNB), formerly known as Binance Coin, is trading above $910 at the time of writing on Tuesday, nearing the upper consolidation boundary. The two months of sideways price action could end, with improving sentiment in the derivatives market suggesting potential upside.
goTop
quote