CFDs are complex instruments and come with a high risk of losing money rapidly due to leverage. 74% of retail investor accounts lose money when trading CFDs with this provider. You should consider whether you understand how CFDs work and whether you can afford to take the high risk of losing your money.

Dash Price Forecast: DASH defies headwinds, paces toward $100

Source Fxstreet
  • Dash extends its rally, reaching an intraday high of $96.85 despite the broader crypto market correcting.
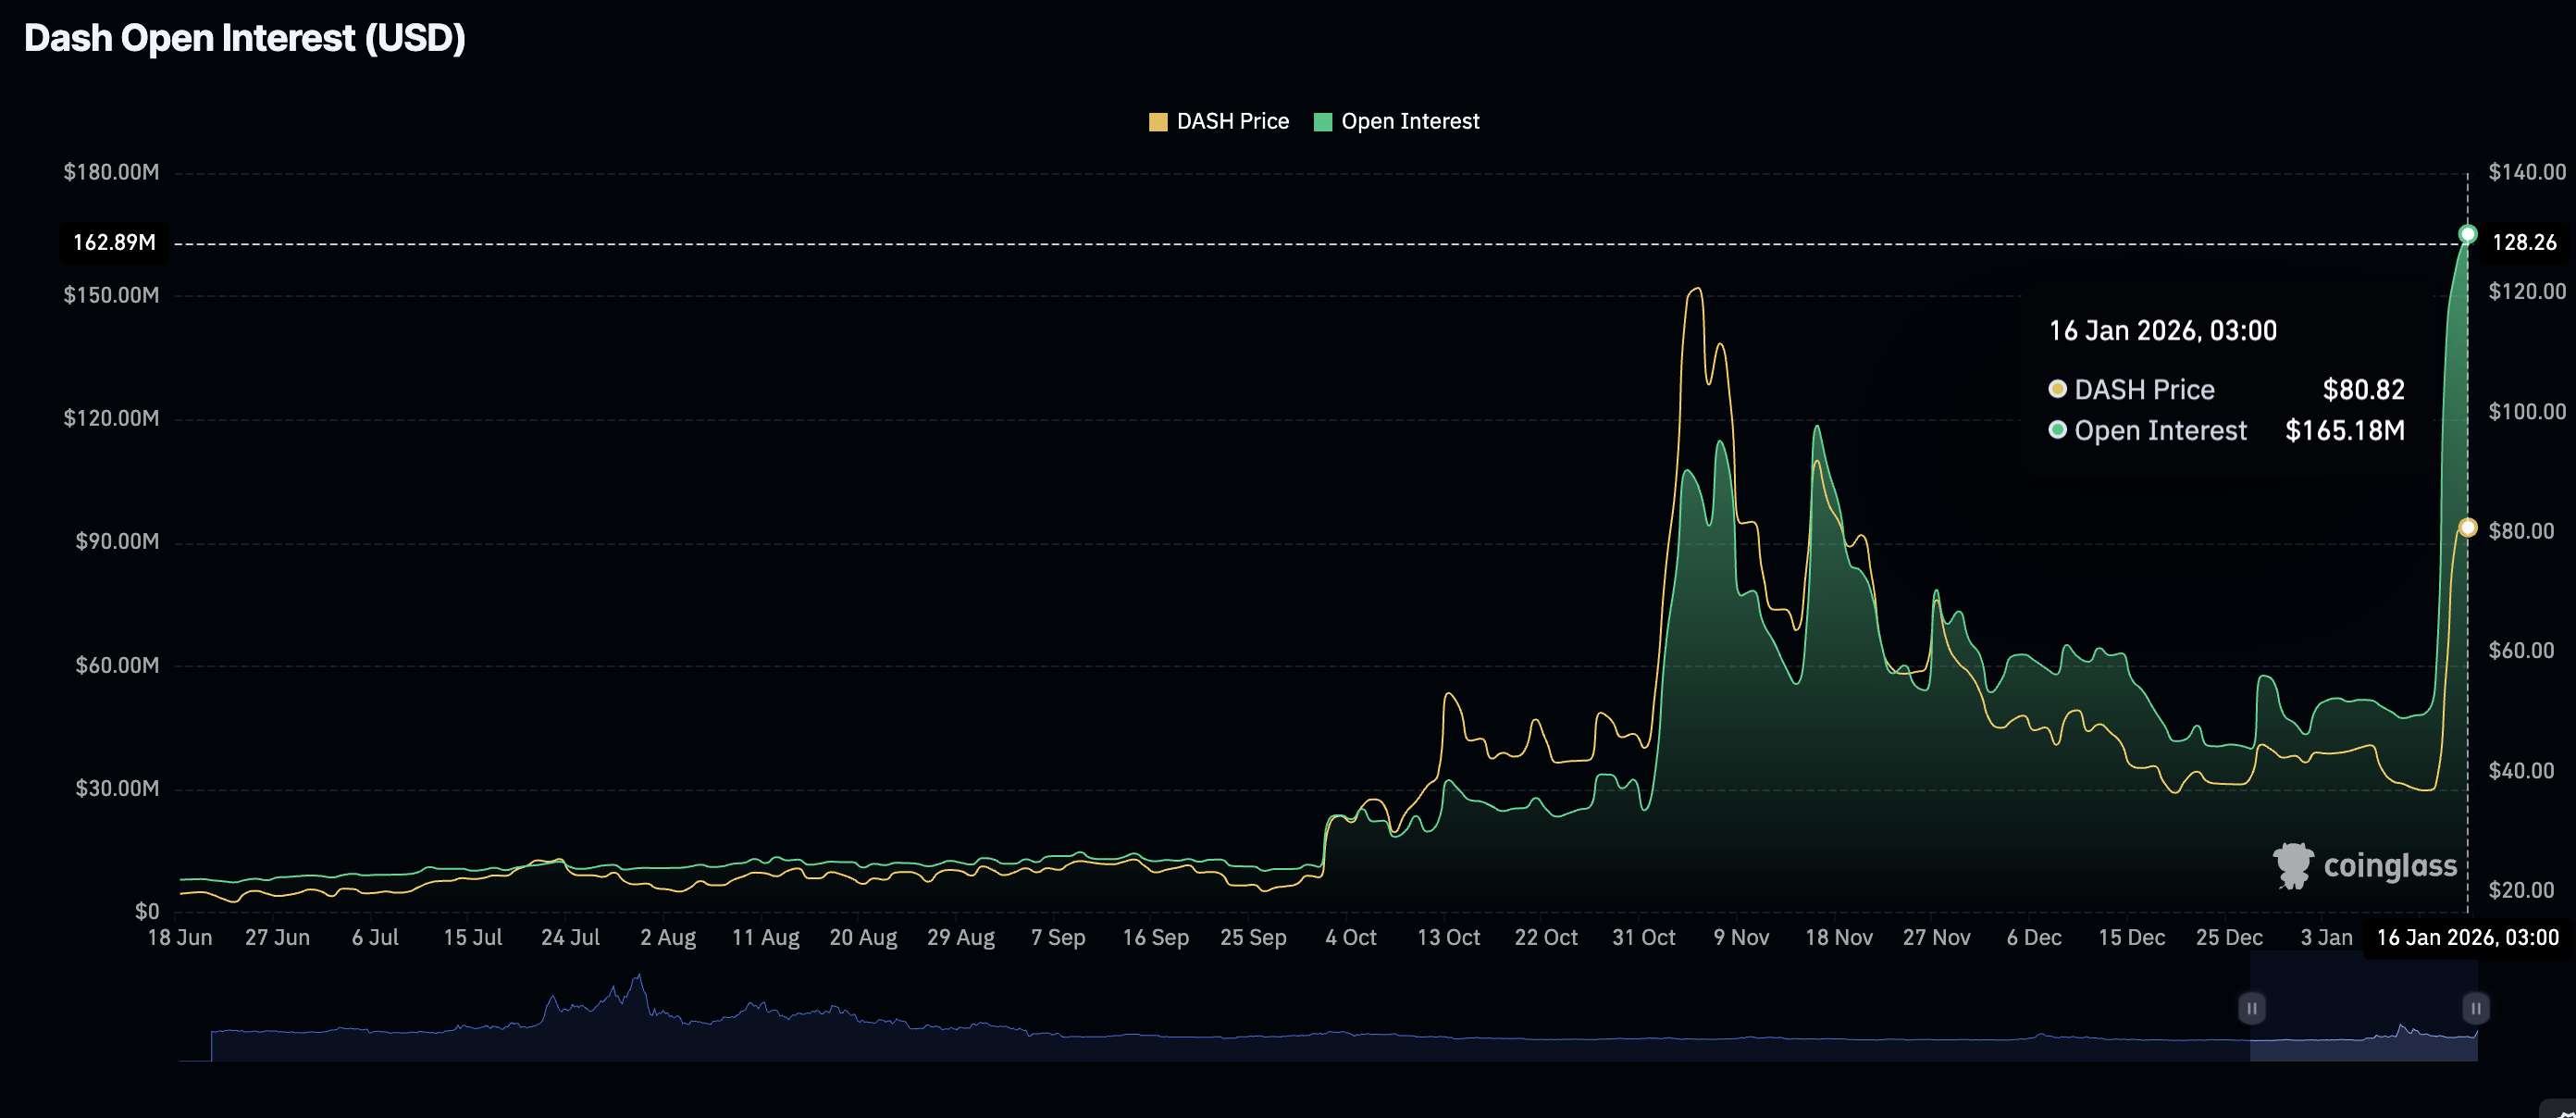
  • Retail interest in DASH explodes as futures Open Interest soars to $165 million.
  • The MACD indicator supports DASH’s short-term bullish outlook, but an overbought RSI signals a correction could be in the offing.

Dash (DASH) is showing strength, trading at $88.47 at the time of writing on Friday, as interest in the privacy-focused token surges with a six-day rising strike. Although the price has corrected from an intraday high of $96.85, DASH is still up over 7%. A strong technical structure supports Dash’s short-term bullish outlook.

Retail demand ignites Dash rally 

The Dash derivatives market has experienced massive growth since the week started, with futures Open Interest (OI) reaching $165 million on Friday from $158 million the previous day. CoinGlass data shows that OI averaged $48 million on Monday.

OI is a metric that represents the total notional value of outstanding futures contracts. Consequently, consistent increases in OI often indicate growing investor interest and market participation in the token. 

Dash Futures Open Interest | Source: CoinGlass

Technical outlook: Dash bulls tighten their grip 

The token has sustained its uptrend for six consecutive days, reflecting the increased retail demand mentioned above and support from strong technical levels.

The Moving Average Convergence Divergence (MACD) indicator has also maintained a buy signal triggered on January 13. The MACD remains above the signal line and, along with the histogram expanding above the mean line, reinforces DASH’s short-term technical outlook.

DASH/USDT daily chart

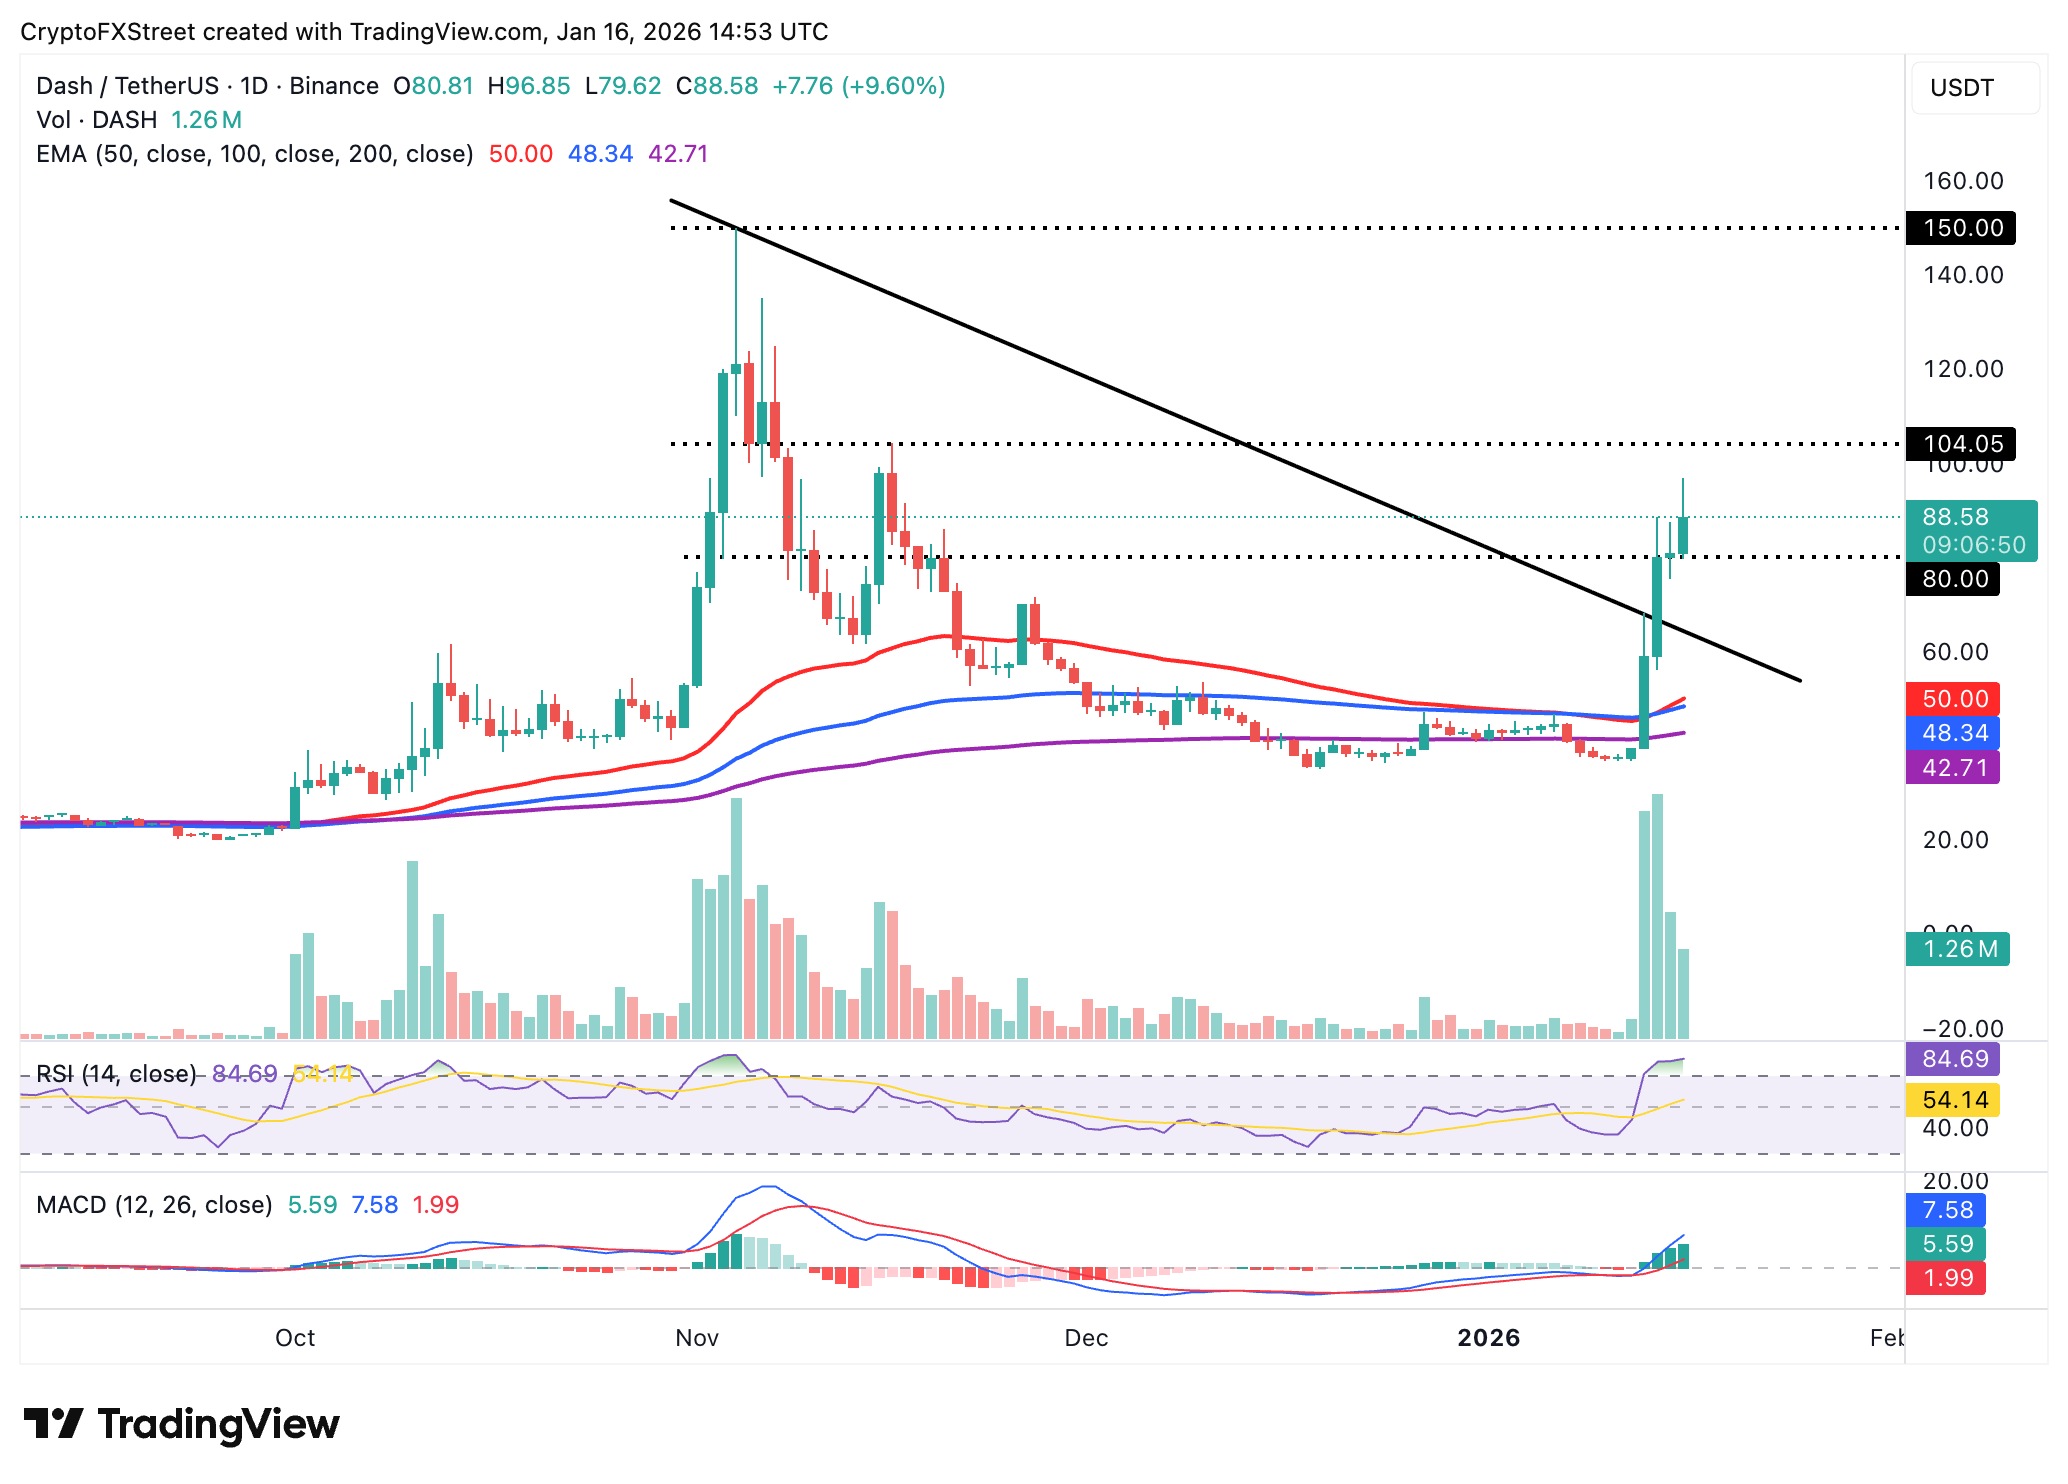
Closing above the immediate hurdle at $90.00 would keep the bulls on track and ease pressure from the short-term support at $80.00. 

The Relative Strength Index (RSI) is at 85 on the daily chart, highlighting Dash’s overbought conditions. If the RSI moves higher, bullish momentum will increase, prompting the price to push above the psychological $100.00 level. However, an overbought RSI indicates that the asset may be overextended and vulnerable to a near-term correction.

Open Interest, funding rate FAQs

Higher Open Interest is associated with higher liquidity and new capital inflow to the market. This is considered the equivalent of increase in efficiency and the ongoing trend continues. When Open Interest decreases, it is considered a sign of liquidation in the market, investors are leaving and the overall demand for an asset is on a decline, fueling a bearish sentiment among investors.

Funding fees bridge the difference between spot prices and prices of futures contracts of an asset by increasing liquidation risks faced by traders. A consistently high and positive funding rate implies there is a bullish sentiment among market participants and there is an expectation of a price hike. A consistently negative funding rate for an asset implies a bearish sentiment, indicating that traders expect the cryptocurrency’s price to fall and a bearish trend reversal is likely to occur.


Disclaimer: The content available on Mitrade Insights is provided for informational and marketing purposes only. It has not been prepared in accordance with legal requirements designed to promote the independence of investment research and is not subject to any prohibition on dealing ahead of the dissemination of investment research
Nothing in this material constitutes investment advice, personal recommendation, investment research, an offer, or a solicitation to buy or sell any financial instrument. The content has been prepared without consideration of your individual investment objectives, financial situation, or needs, and should not be treated as such.
Past performance is not a reliable indicator of future performance and/or results. Forward-looking scenarios or forecasts are not a guarantee of future performance. Actual results may differ materially from those anticipated.
Mitrade makes no representation or warranty as to the accuracy or completeness of the information provided and accepts no liability for any loss arising from reliance on such information.
placeholder
WTI hovers below $59.00 as US-Iran tensions ease, weekly loss loomsWest Texas Intermediate (WTI) Oil price moves little after two days of more than 3% losses, trading around $58.80 during the Asian hours on Friday. WTI price faces challenges as geopolitical risk premiums faded following easing fears of a possible US military strike on Iran.
Author  FXStreet
12 hours ago
West Texas Intermediate (WTI) Oil price moves little after two days of more than 3% losses, trading around $58.80 during the Asian hours on Friday. WTI price faces challenges as geopolitical risk premiums faded following easing fears of a possible US military strike on Iran.
placeholder
Cardano Price Forecast: Rejection at 50-day EMA tightens bearish gripCardano (ADA) edges lower by over 3% at press time on Thursday, extending the second rejection from the 50-day Exponential Moving Average (EMA) so far this month. A bearish side in the retail interest leads to a decline in Open Interest and lowered funding rates.
Author  FXStreet
Yesterday 07: 55
Cardano (ADA) edges lower by over 3% at press time on Thursday, extending the second rejection from the 50-day Exponential Moving Average (EMA) so far this month. A bearish side in the retail interest leads to a decline in Open Interest and lowered funding rates.
placeholder
Hedera Price Forecast: HBAR extends gains as ETF inflows boost sentiment Hedera (HBAR) is trading at around $0.127 on Wednesday, approaching a key resistance level; a breakout above this level would signal further gains. Institutional demand continues to strengthen this week, with spot HBAR Exchange-Traded Funds (ETFs) recording three consecutive days of inflows.
Author  FXStreet
Jan 14, Wed
Hedera (HBAR) is trading at around $0.127 on Wednesday, approaching a key resistance level; a breakout above this level would signal further gains. Institutional demand continues to strengthen this week, with spot HBAR Exchange-Traded Funds (ETFs) recording three consecutive days of inflows.
placeholder
WTI declines below $61.00 as US stockpile builds, Venezuelan exports resumeWest Texas Intermediate (WTI), the US crude oil benchmark, is trading around $60.70 during the Asian trading hours on Wednesday. The WTI price declines as Venezuela resumes exports and the American Petroleum Institute (API) shows a big build in US crude inventories.
Author  FXStreet
Jan 14, Wed
West Texas Intermediate (WTI), the US crude oil benchmark, is trading around $60.70 during the Asian trading hours on Wednesday. The WTI price declines as Venezuela resumes exports and the American Petroleum Institute (API) shows a big build in US crude inventories.
placeholder
BNB Price Forecast: On the verge of breakout as derivatives traders bet on gainsBNB (BNB), formerly known as Binance Coin, is trading above $910 at the time of writing on Tuesday, nearing the upper consolidation boundary. The two months of sideways price action could end, with improving sentiment in the derivatives market suggesting potential upside.
Author  FXStreet
Jan 13, Tue
BNB (BNB), formerly known as Binance Coin, is trading above $910 at the time of writing on Tuesday, nearing the upper consolidation boundary. The two months of sideways price action could end, with improving sentiment in the derivatives market suggesting potential upside.
goTop
quote