CFDs are complex instruments and come with a high risk of losing money rapidly due to leverage. 74% of retail investor accounts lose money when trading CFDs with this provider. You should consider whether you understand how CFDs work and whether you can afford to take the high risk of losing your money.

Cardano Price Forecast: ADA dips below $0.37, hitting two-month low as bearish momentum builds

Source Fxstreet
  • Cardano price hovers around $0.36 on Thursday after falling more than 7% so far this week.
  • On-chain data indicate bearish sentiment, as social dominance declines while dormant wallet activity rises.
  • The technical outlook suggests further downside, as momentum indicators show bearish pressure gaining traction.

Cardano (ADA) price trades in the red, slipping below $0.37 on Thursday after correcting more than 7% so far this week. The ongoing pullback could deepen further as ADA’s social dominance declines and dormant wallet activity rises, suggesting bearish sentiment among traders. On the technical side, deteriorating momentum indicators suggest further downside.

Cardano’s on-chain signals turn bearish

Santiment’s Social Dominance metric for Cardano supports a bearish outlook. The index measures the share of ADA-related discussions across the cryptocurrency media. It has consistently fallen since mid-November, reaching an annual low of 0.032% on Thursday. This fall indicates fading market interest and weakening sentiment among Cardano investors.

ADA Social Dominance chart. Source: Santiment

Santiment’s Age Consumed index, shown below, also hints at bearish signs. The spikes in this index suggest dormant tokens (tokens stored in wallets for a long time) are in motion, and it can be used to spot short-term local tops or bottoms. 

As in the case of Cardano, history shows that a decline followed the spikes in ADA’s price as holders moved their tokens from wallets to exchanges, thereby increasing selling pressure. The most recent upticks on December 10 and Monday suggested that ADA was ready for a downtrend.

Cardano’s Age Consumed chart. Source: Santiment

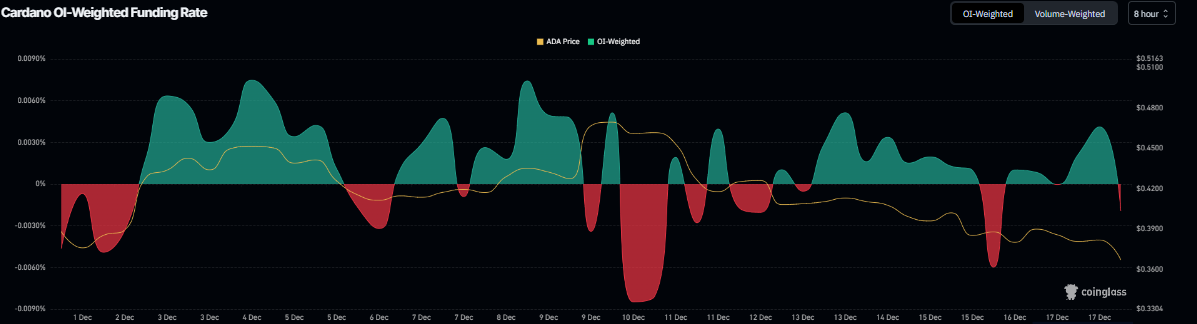
On the derivatives front, data further supports a negative outlook for Cardano. Coinglass’s OI-Weighted Funding Rate data show that the number of traders betting that the price of ADA will slide further exceeds those anticipating a price increase.

The metric turned negative on Thursday, down 0.0019%, suggesting that shorts are paying longs. Historically, when the funding rates have flipped negative, ADA prices have fallen sharply.

Cardano’s funding rates chart. Source: Coinglass

Cardano Price Forecast: ADA bears are in control of the momentum

Cardano price was rejected from the upper trendline of the falling wedge pattern (formed by connecting multiple highs and lows with two trendlines since mid-October) on December 9 and declined 21.8% through Wednesday. At the time of writing on Thursday, ADA is trading down, reaching a two-month low of $0.36.

If ADA continues its downward trend, it could extend the fall toward the October 10 low of $0.27.

The Relative Strength Index (RSI) on the daily chart reads 32, nearing oversold territory, indicating strong bearish momentum. Additionally, the Moving Average Convergence Divergence (MACD) indicator showed a bearish crossover on Wednesday, further supporting the negative outlook.

ADA/USDT daily chart

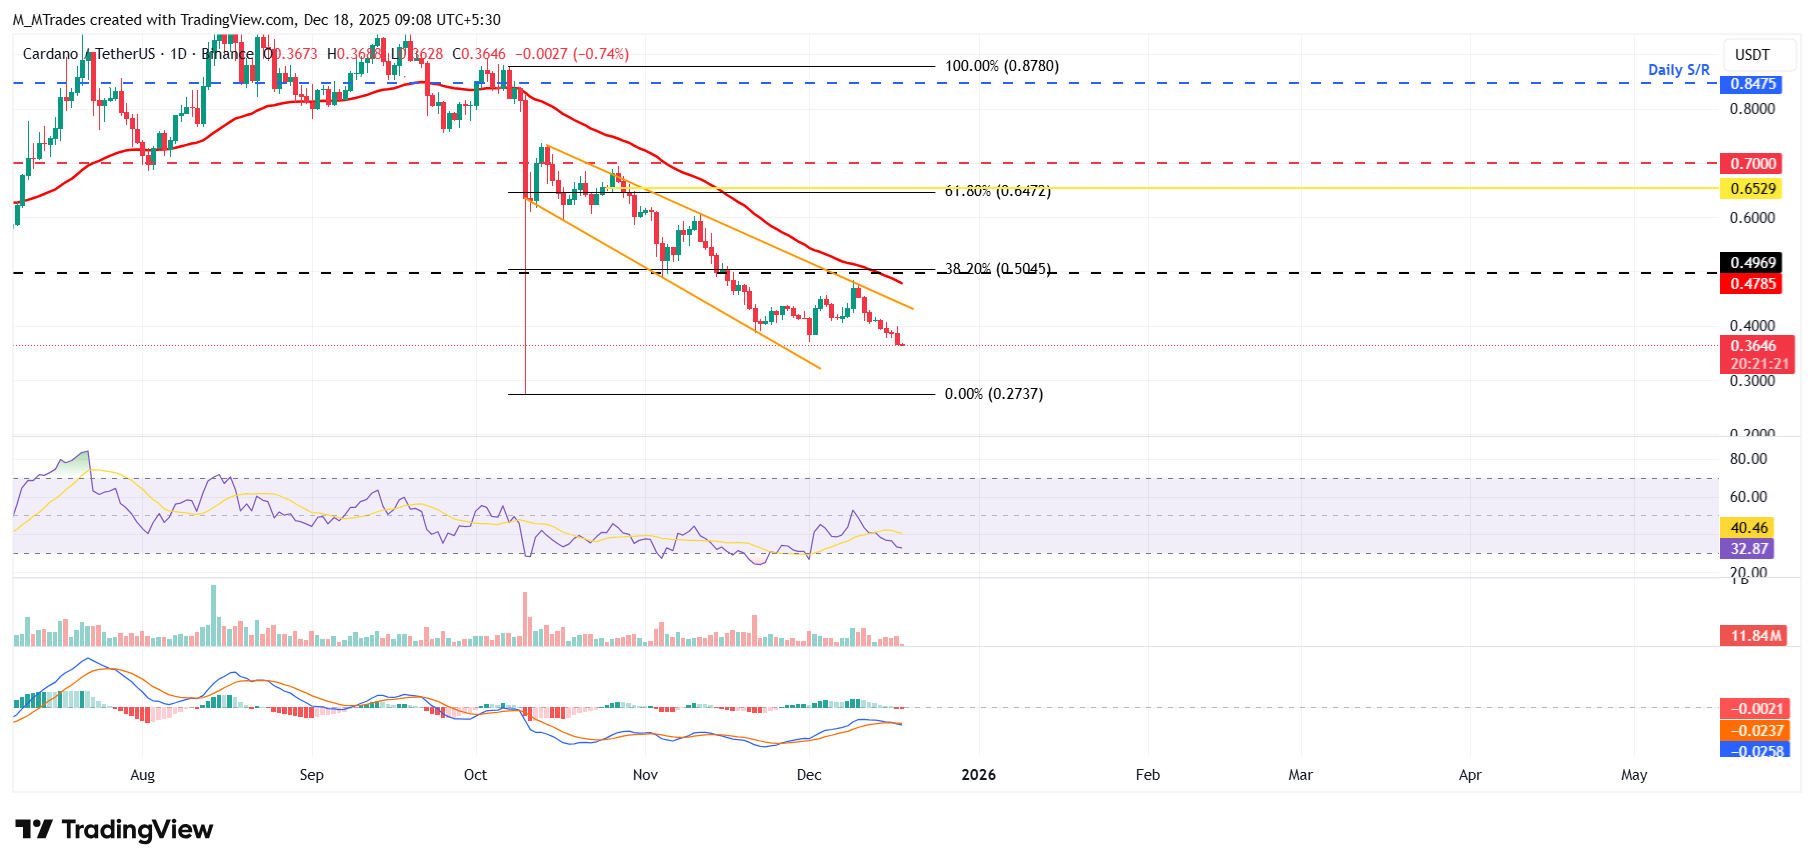
However, if ADA recovers, it could extend the advance toward the 50-day EMA at $0.47.

Disclaimer: The content available on Mitrade Insights is provided for informational and marketing purposes only. It has not been prepared in accordance with legal requirements designed to promote the independence of investment research and is not subject to any prohibition on dealing ahead of the dissemination of investment research
Nothing in this material constitutes investment advice, personal recommendation, investment research, an offer, or a solicitation to buy or sell any financial instrument. The content has been prepared without consideration of your individual investment objectives, financial situation, or needs, and should not be treated as such.
Past performance is not a reliable indicator of future performance and/or results. Forward-looking scenarios or forecasts are not a guarantee of future performance. Actual results may differ materially from those anticipated.
Mitrade makes no representation or warranty as to the accuracy or completeness of the information provided and accepts no liability for any loss arising from reliance on such information.
placeholder
WTI hovers below $59.00 as US-Iran tensions ease, weekly loss loomsWest Texas Intermediate (WTI) Oil price moves little after two days of more than 3% losses, trading around $58.80 during the Asian hours on Friday. WTI price faces challenges as geopolitical risk premiums faded following easing fears of a possible US military strike on Iran.
Author  FXStreet
16 hours ago
West Texas Intermediate (WTI) Oil price moves little after two days of more than 3% losses, trading around $58.80 during the Asian hours on Friday. WTI price faces challenges as geopolitical risk premiums faded following easing fears of a possible US military strike on Iran.
placeholder
Cardano Price Forecast: Rejection at 50-day EMA tightens bearish gripCardano (ADA) edges lower by over 3% at press time on Thursday, extending the second rejection from the 50-day Exponential Moving Average (EMA) so far this month. A bearish side in the retail interest leads to a decline in Open Interest and lowered funding rates.
Author  FXStreet
Yesterday 07: 55
Cardano (ADA) edges lower by over 3% at press time on Thursday, extending the second rejection from the 50-day Exponential Moving Average (EMA) so far this month. A bearish side in the retail interest leads to a decline in Open Interest and lowered funding rates.
placeholder
Hedera Price Forecast: HBAR extends gains as ETF inflows boost sentiment Hedera (HBAR) is trading at around $0.127 on Wednesday, approaching a key resistance level; a breakout above this level would signal further gains. Institutional demand continues to strengthen this week, with spot HBAR Exchange-Traded Funds (ETFs) recording three consecutive days of inflows.
Author  FXStreet
Jan 14, Wed
Hedera (HBAR) is trading at around $0.127 on Wednesday, approaching a key resistance level; a breakout above this level would signal further gains. Institutional demand continues to strengthen this week, with spot HBAR Exchange-Traded Funds (ETFs) recording three consecutive days of inflows.
placeholder
WTI declines below $61.00 as US stockpile builds, Venezuelan exports resumeWest Texas Intermediate (WTI), the US crude oil benchmark, is trading around $60.70 during the Asian trading hours on Wednesday. The WTI price declines as Venezuela resumes exports and the American Petroleum Institute (API) shows a big build in US crude inventories.
Author  FXStreet
Jan 14, Wed
West Texas Intermediate (WTI), the US crude oil benchmark, is trading around $60.70 during the Asian trading hours on Wednesday. The WTI price declines as Venezuela resumes exports and the American Petroleum Institute (API) shows a big build in US crude inventories.
placeholder
BNB Price Forecast: On the verge of breakout as derivatives traders bet on gainsBNB (BNB), formerly known as Binance Coin, is trading above $910 at the time of writing on Tuesday, nearing the upper consolidation boundary. The two months of sideways price action could end, with improving sentiment in the derivatives market suggesting potential upside.
Author  FXStreet
Jan 13, Tue
BNB (BNB), formerly known as Binance Coin, is trading above $910 at the time of writing on Tuesday, nearing the upper consolidation boundary. The two months of sideways price action could end, with improving sentiment in the derivatives market suggesting potential upside.
Related Instrument
goTop
quote