CFDs are complex instruments and come with a high risk of losing money rapidly due to leverage. 74% of retail investor accounts lose money when trading CFDs with this provider. You should consider whether you understand how CFDs work and whether you can afford to take the high risk of losing your money.

Aave Price Forecast: AAVE extends losses as whale selling intensifies

Source Fxstreet
  • Aave continues to slide on Monday after shedding more than 12% over the previous week.
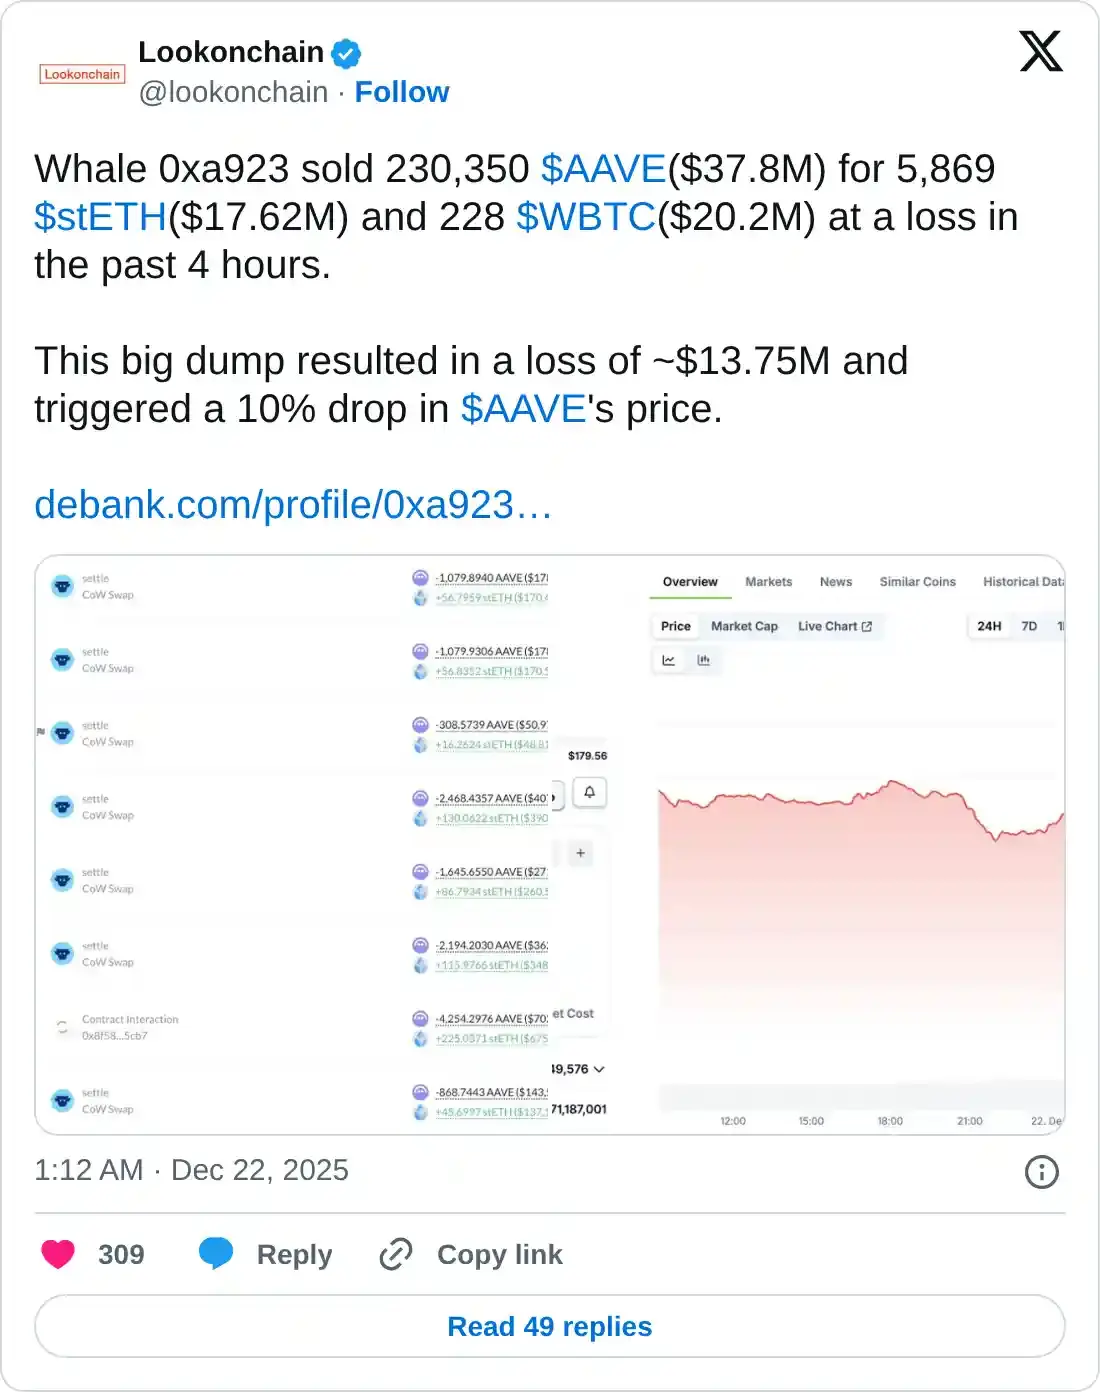
  • Lookonchain data show that whale wallets are offloading AAVE tokens, adding to selling pressure.
  • The technical outlook suggests growing bearish momentum, near-term correction could deepen.

Aave (AAVE) price continues to trade in the red below $162 on Monday after correcting by more than 12% in the last week. On-chain data indicate that whale wallets are increasing token sales, while AAVE’s momentum indicators are turning increasingly negative, suggesting further correction in the coming days.

Whale wallets and holders dump AAVE, selling pressure accelerates

Lookonchain data on Monday shows that a whale wallet sold 230,350 AAVE worth $37.8 million, which increased the selling pressure in the AAVE token. 

https://twitter.com/lookonchain/status/2002910202673365049

In addition, Santiment's Network Realized Profit/Loss (NPL) metric indicates that Aave's profit-taking activity reached the highest level since the end of November.

As shown in the chart below, the metric spiked on Monday, indicating that holders are, on average, selling their bags at significant profits, thereby further increasing selling pressure.

Aave NPL chart. Source: Santiment

Aave Price Forecast: AAVE bears are in control of the momentum

Aave price was rejected from the 50-day Exponential Moving Average (EMA) at $193.61 on December 10 and declined by over 18% by Sunday. As of Monday, AAVE continues to slide, trading below $161.

If AAVE continues its downtrend and closes below the weekly support at $160.51 on a daily basis,  it could extend the decline toward the November 21 low of $147.13.

The Relative Strength Index (RSI) is at 36, below the neutral level of 50, indicating bearish momentum gaining traction. The Moving Average Convergence Divergence (MACD) showed a bearish crossover last week, which remains intact, further supporting the negative outlook.

AAVE/USDT daily chart

However, if Aave recovers, it could extend the advance toward the daily resistance at $179.27.

Disclaimer: The content available on Mitrade Insights is provided for informational and marketing purposes only. It has not been prepared in accordance with legal requirements designed to promote the independence of investment research and is not subject to any prohibition on dealing ahead of the dissemination of investment research
Nothing in this material constitutes investment advice, personal recommendation, investment research, an offer, or a solicitation to buy or sell any financial instrument. The content has been prepared without consideration of your individual investment objectives, financial situation, or needs, and should not be treated as such.
Past performance is not a reliable indicator of future performance and/or results. Forward-looking scenarios or forecasts are not a guarantee of future performance. Actual results may differ materially from those anticipated.
Mitrade makes no representation or warranty as to the accuracy or completeness of the information provided and accepts no liability for any loss arising from reliance on such information.
placeholder
Silver Price Forecast: XAG/USD rises to near $72.50 due to bullish biasSilver price (XAG/USD) gains nearly 4%, trading around $75.50 during the European hours on Monday. The technical analysis of the daily chart timeframe suggests the price of the precious metal remains within an ascending channel pattern, suggesting a persistent bullish bias.
Author  FXStreet
Jan 05, Mon
Silver price (XAG/USD) gains nearly 4%, trading around $75.50 during the European hours on Monday. The technical analysis of the daily chart timeframe suggests the price of the precious metal remains within an ascending channel pattern, suggesting a persistent bullish bias.
placeholder
WTI maintains position above $59.00 as supply risks growWest Texas Intermediate (WTI) Oil price extends its gains for the third successive session, trading around $59.10 per barrel during the Asian hours on Monday. Crude Oil prices rise as supply risks grow amid escalating protests in Iran.
Author  FXStreet
Jan 12, Mon
West Texas Intermediate (WTI) Oil price extends its gains for the third successive session, trading around $59.10 per barrel during the Asian hours on Monday. Crude Oil prices rise as supply risks grow amid escalating protests in Iran.
placeholder
Meme Coins Price Prediction: DOGE, SHIB, and PEPE bulls struggle to regain strengthMeme coins, including Dogecoin (DOGE), Shiba Inu (SHIB), and Pepe (PEPE), remain under extreme selling pressure, recording roughly seven days of downtrend following the January 4 spike.
Author  FXStreet
Jan 13, Tue
Meme coins, including Dogecoin (DOGE), Shiba Inu (SHIB), and Pepe (PEPE), remain under extreme selling pressure, recording roughly seven days of downtrend following the January 4 spike.
placeholder
BNB Price Forecast: On the verge of breakout as derivatives traders bet on gainsBNB (BNB), formerly known as Binance Coin, is trading above $910 at the time of writing on Tuesday, nearing the upper consolidation boundary. The two months of sideways price action could end, with improving sentiment in the derivatives market suggesting potential upside.
Author  FXStreet
Jan 13, Tue
BNB (BNB), formerly known as Binance Coin, is trading above $910 at the time of writing on Tuesday, nearing the upper consolidation boundary. The two months of sideways price action could end, with improving sentiment in the derivatives market suggesting potential upside.
placeholder
Hedera Price Forecast: HBAR extends gains as ETF inflows boost sentiment Hedera (HBAR) is trading at around $0.127 on Wednesday, approaching a key resistance level; a breakout above this level would signal further gains. Institutional demand continues to strengthen this week, with spot HBAR Exchange-Traded Funds (ETFs) recording three consecutive days of inflows.
Author  FXStreet
Jan 14, Wed
Hedera (HBAR) is trading at around $0.127 on Wednesday, approaching a key resistance level; a breakout above this level would signal further gains. Institutional demand continues to strengthen this week, with spot HBAR Exchange-Traded Funds (ETFs) recording three consecutive days of inflows.
Related Instrument
goTop
quote