


Meme Coins Price Prediction: Dogecoin, Shiba Inu, Pepe struggle to recover
- Dogecoin approaches the $0.10 support after losing over 4% on Wednesday.
- Shiba Inu ticks higher after a three-day decline of over 6%, indicating a short-term relief.
- Pepe struggles to hold above key support following a 2.66% decline on the previous day.
Meme coins, including Dogecoin (DOGE), Shiba Inu (SHIB), and Pepe (PEPE), started the New Year under bearish pressure after Wednesday's decline of 2% to 4%. Large wallet investors, popularly known as whales, accumulate DOGE but lose confidence in SHIB and PEPE. Technically, the meme coins are poised for further decline amid intense selling pressure and a lack of sustained recovery in Bitcoin (BTC).
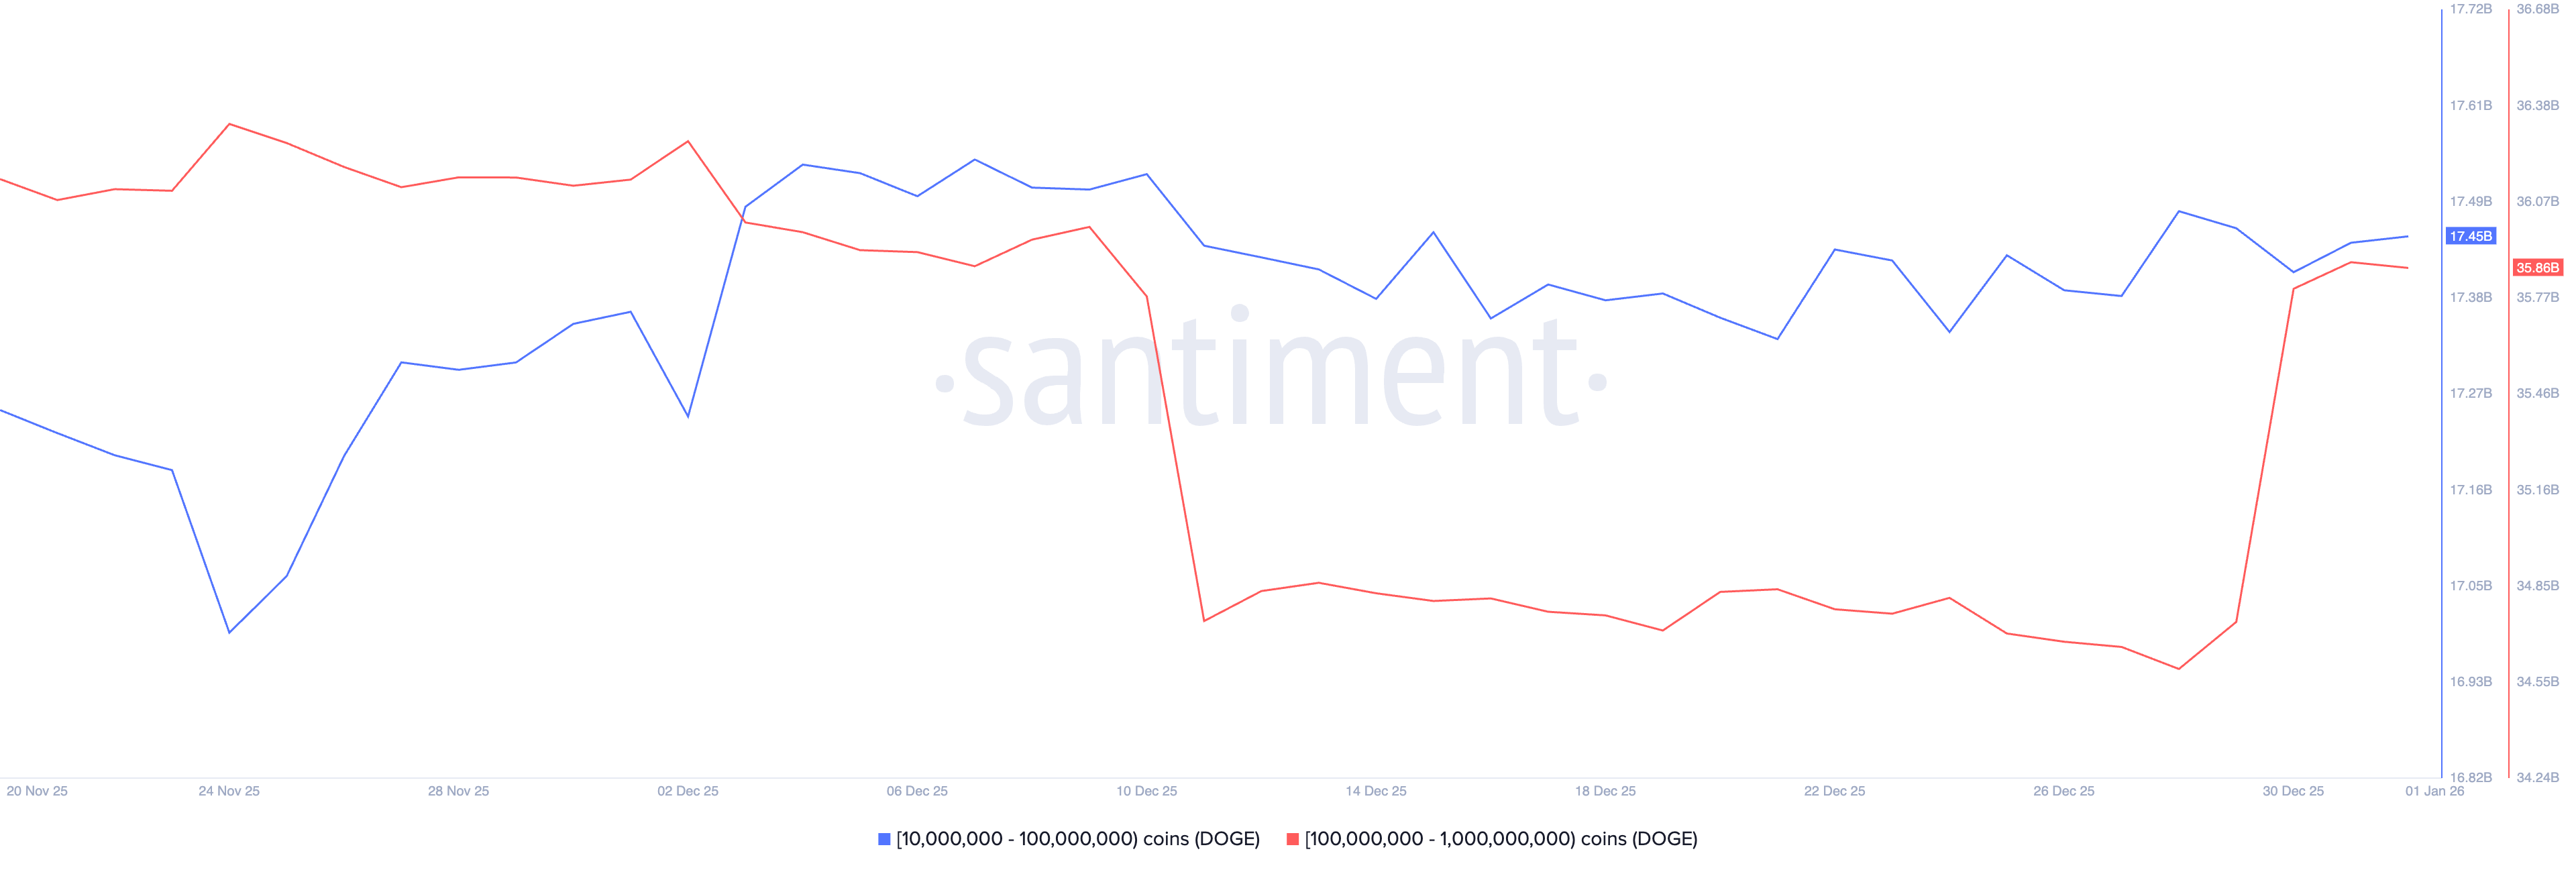
Whales prefer DOGE over SHIB and PEPE
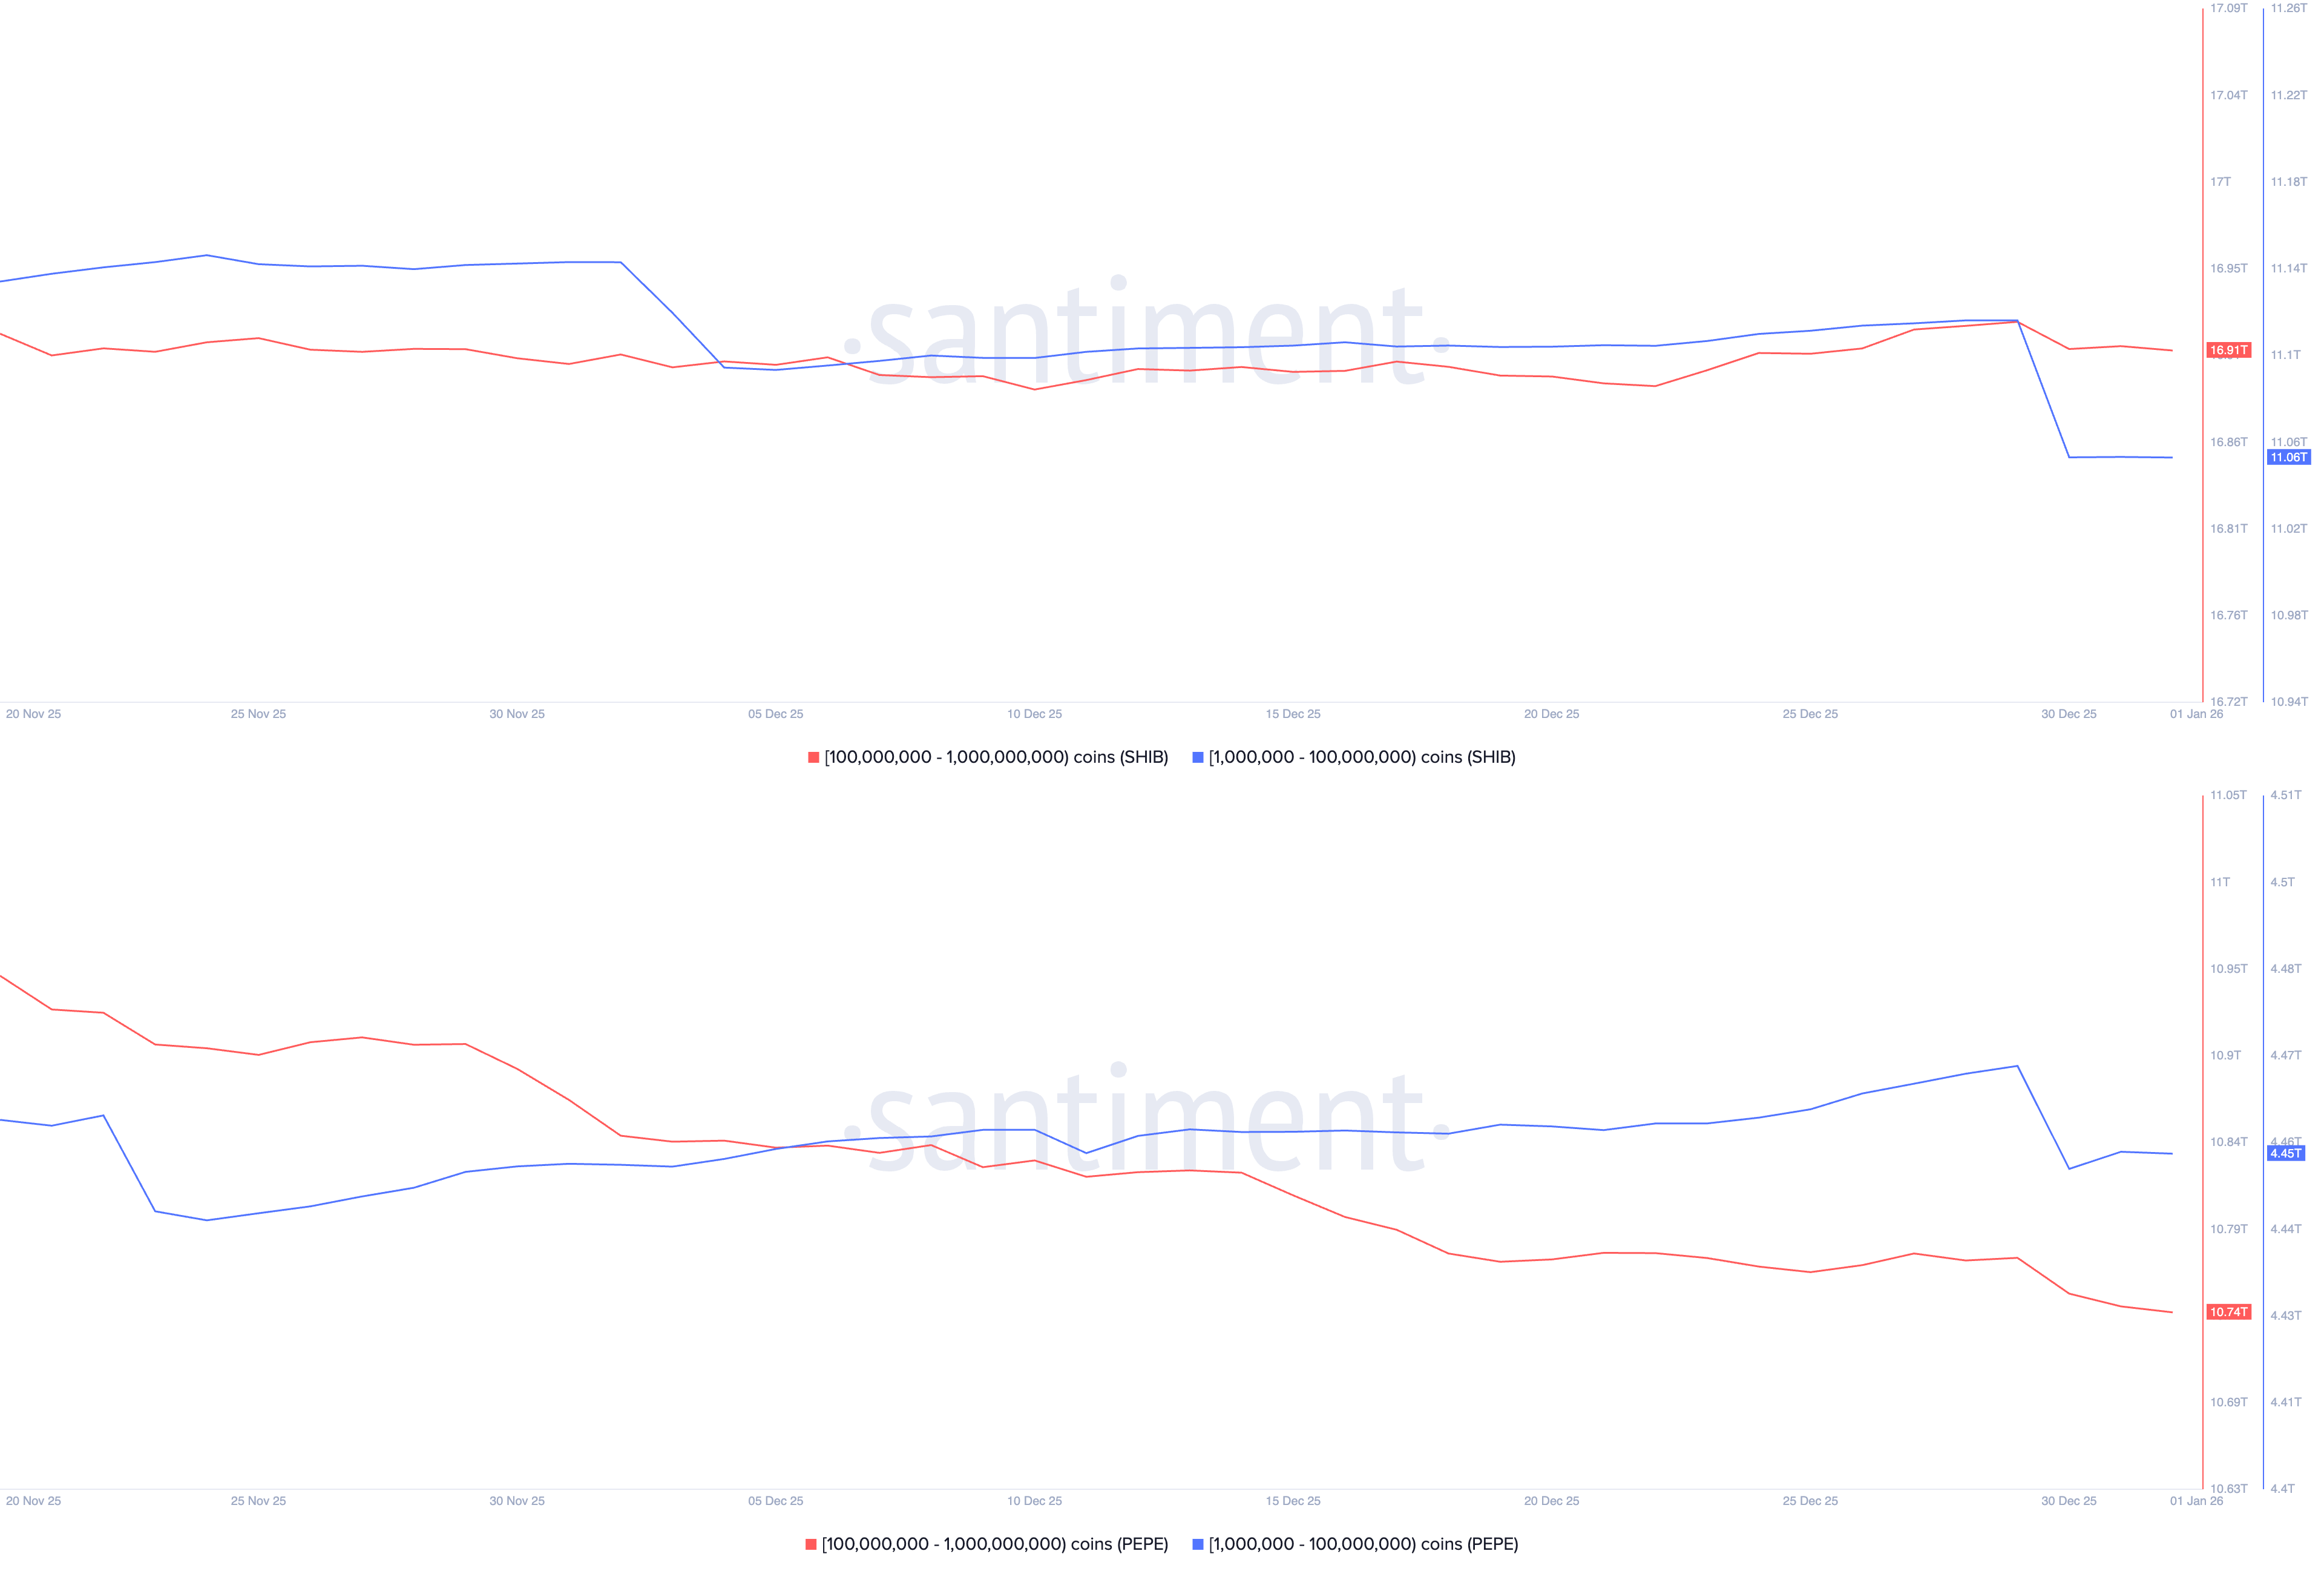
On-chain data shows that whale holdings of DOGE increased this week, while offloading of SHIB and PEPE added to supply pressure. According to Santiment, whales holding 100 million to 1 billion DOGE have a total of 35.86 billion DOGE, up from 34.59 billion on Sunday, indicating increased confidence among large wallet investors.
On the other hand, holding of Shiba Inu whales with 1 million to 100 million SHIB dropped to 11.06 trillion, from 11.12 trillion on Monday. Similarly, Pepe whales with 1 million to 100 million PEPE trim their holding to 4.45 trillion PEPE from 4.47 trillion PEPE on Monday. At the same time, investors with 100 million to 1 billion tokens reduce exposure to 10.74 trillion, down from 10.77 trillion in the same period.
Dogecoin risks a bearish breakout of a falling wedge pattern
Dogecoin is down over 4% this week so far, extending the downfall for the sixth consecutive week. The dog-themed meme coin declines in a descending wedge pattern on the daily chart, approaching the support trendline connecting the November 21 and December 18 lows, near $0.1111.
A decisive close below this level could threaten the $0.1000 psychological level for an extended correction to the October 10 low at $0.0950.
The Relative Strength Index (RSI) is at 33 on the daily chart, hovering near the oversold zone. This indicates intense selling pressure, and a drop into the oversold zone could indicate further correction.
At the same time, the Moving Average Convergence Divergence (MACD) drops to the signal line, resulting in a fresh cycle of red histogram bars below the zero line. This indicates renewed bearish momentum.
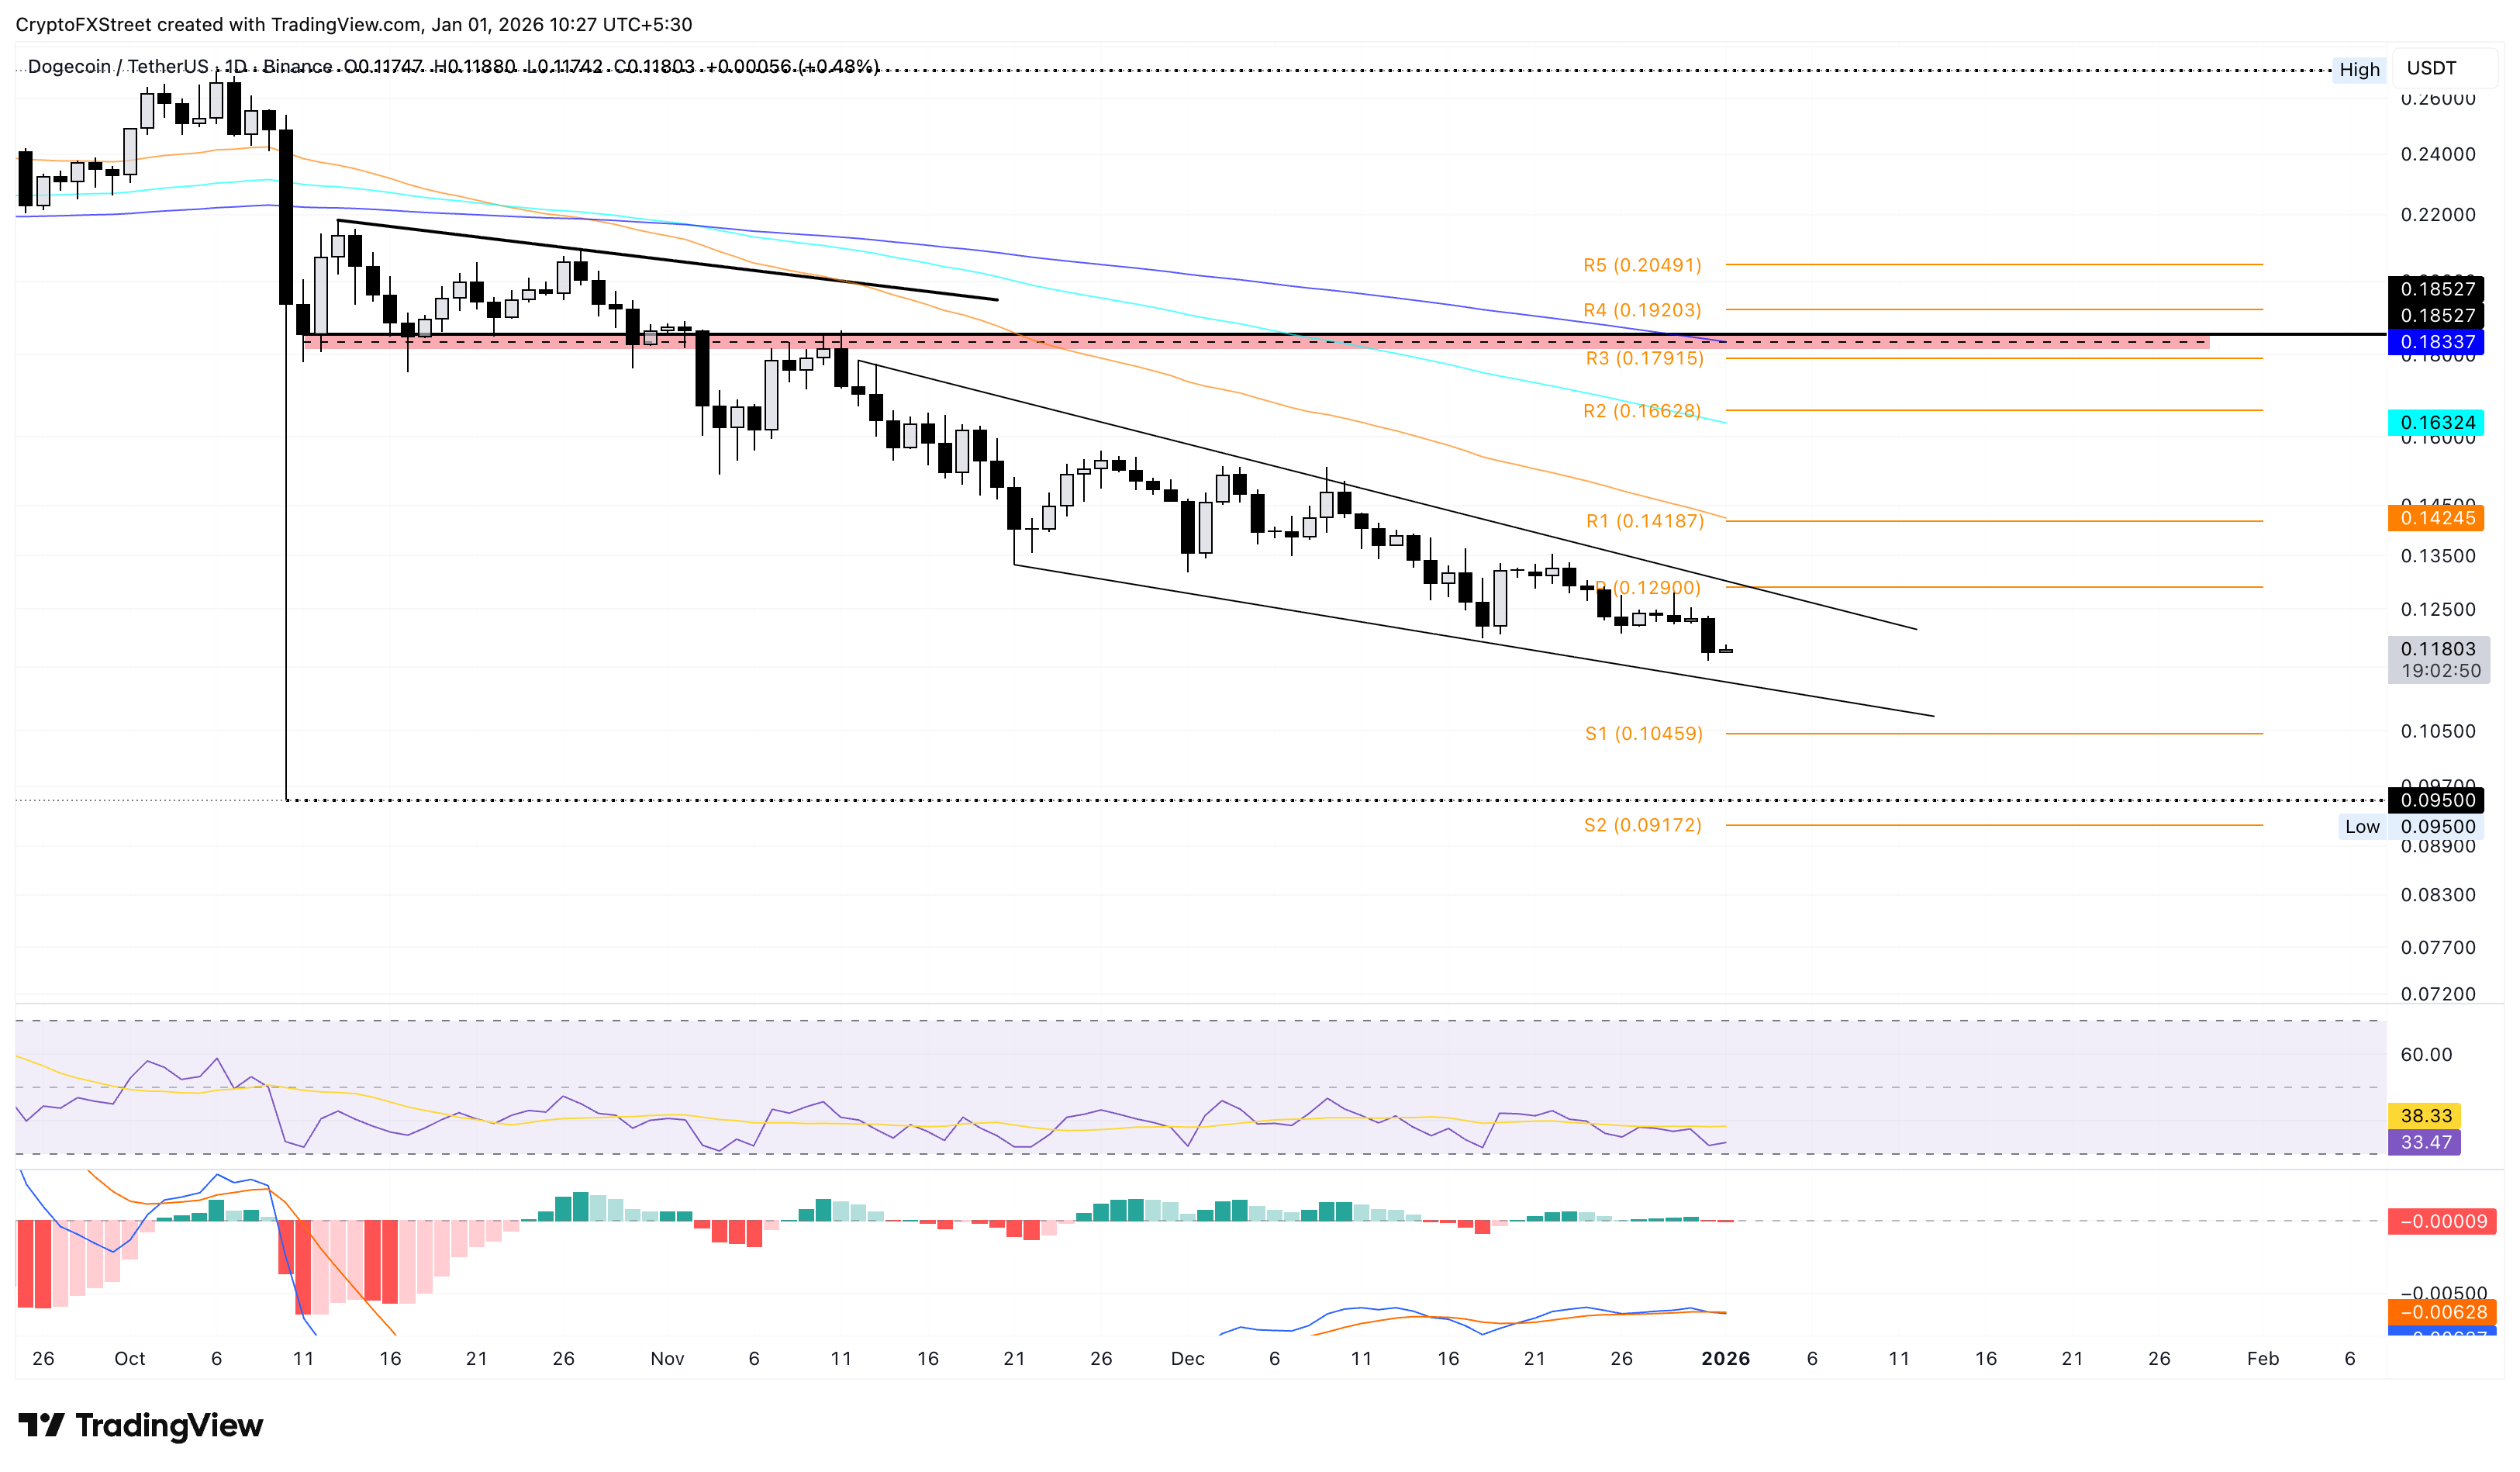
A potential DOGE rebound could face resistance near the R1 Pivot Point at $0.1290.
Shiba Inu flashes bearish potential
Shiba Inu is in a declining trend within a broadening wedge pattern, as indicated by two diverging trendlines on the daily chart. At the time of writing, SHIB is up 1% on Thursday, recovering from the 2.68% drop on the previous day.
The intraday recovery halts the three-day decline of over 6%, with bulls targeting the center Pivot Point at $0.00000775.
The technical indicators on the daily chart remain mixed. The RSI at 38 is pointing upwards from the oversold zone, signaling a drop in selling pressure. Meanwhile, the MACD and signal line are close, indicating reduced bullish momentum.
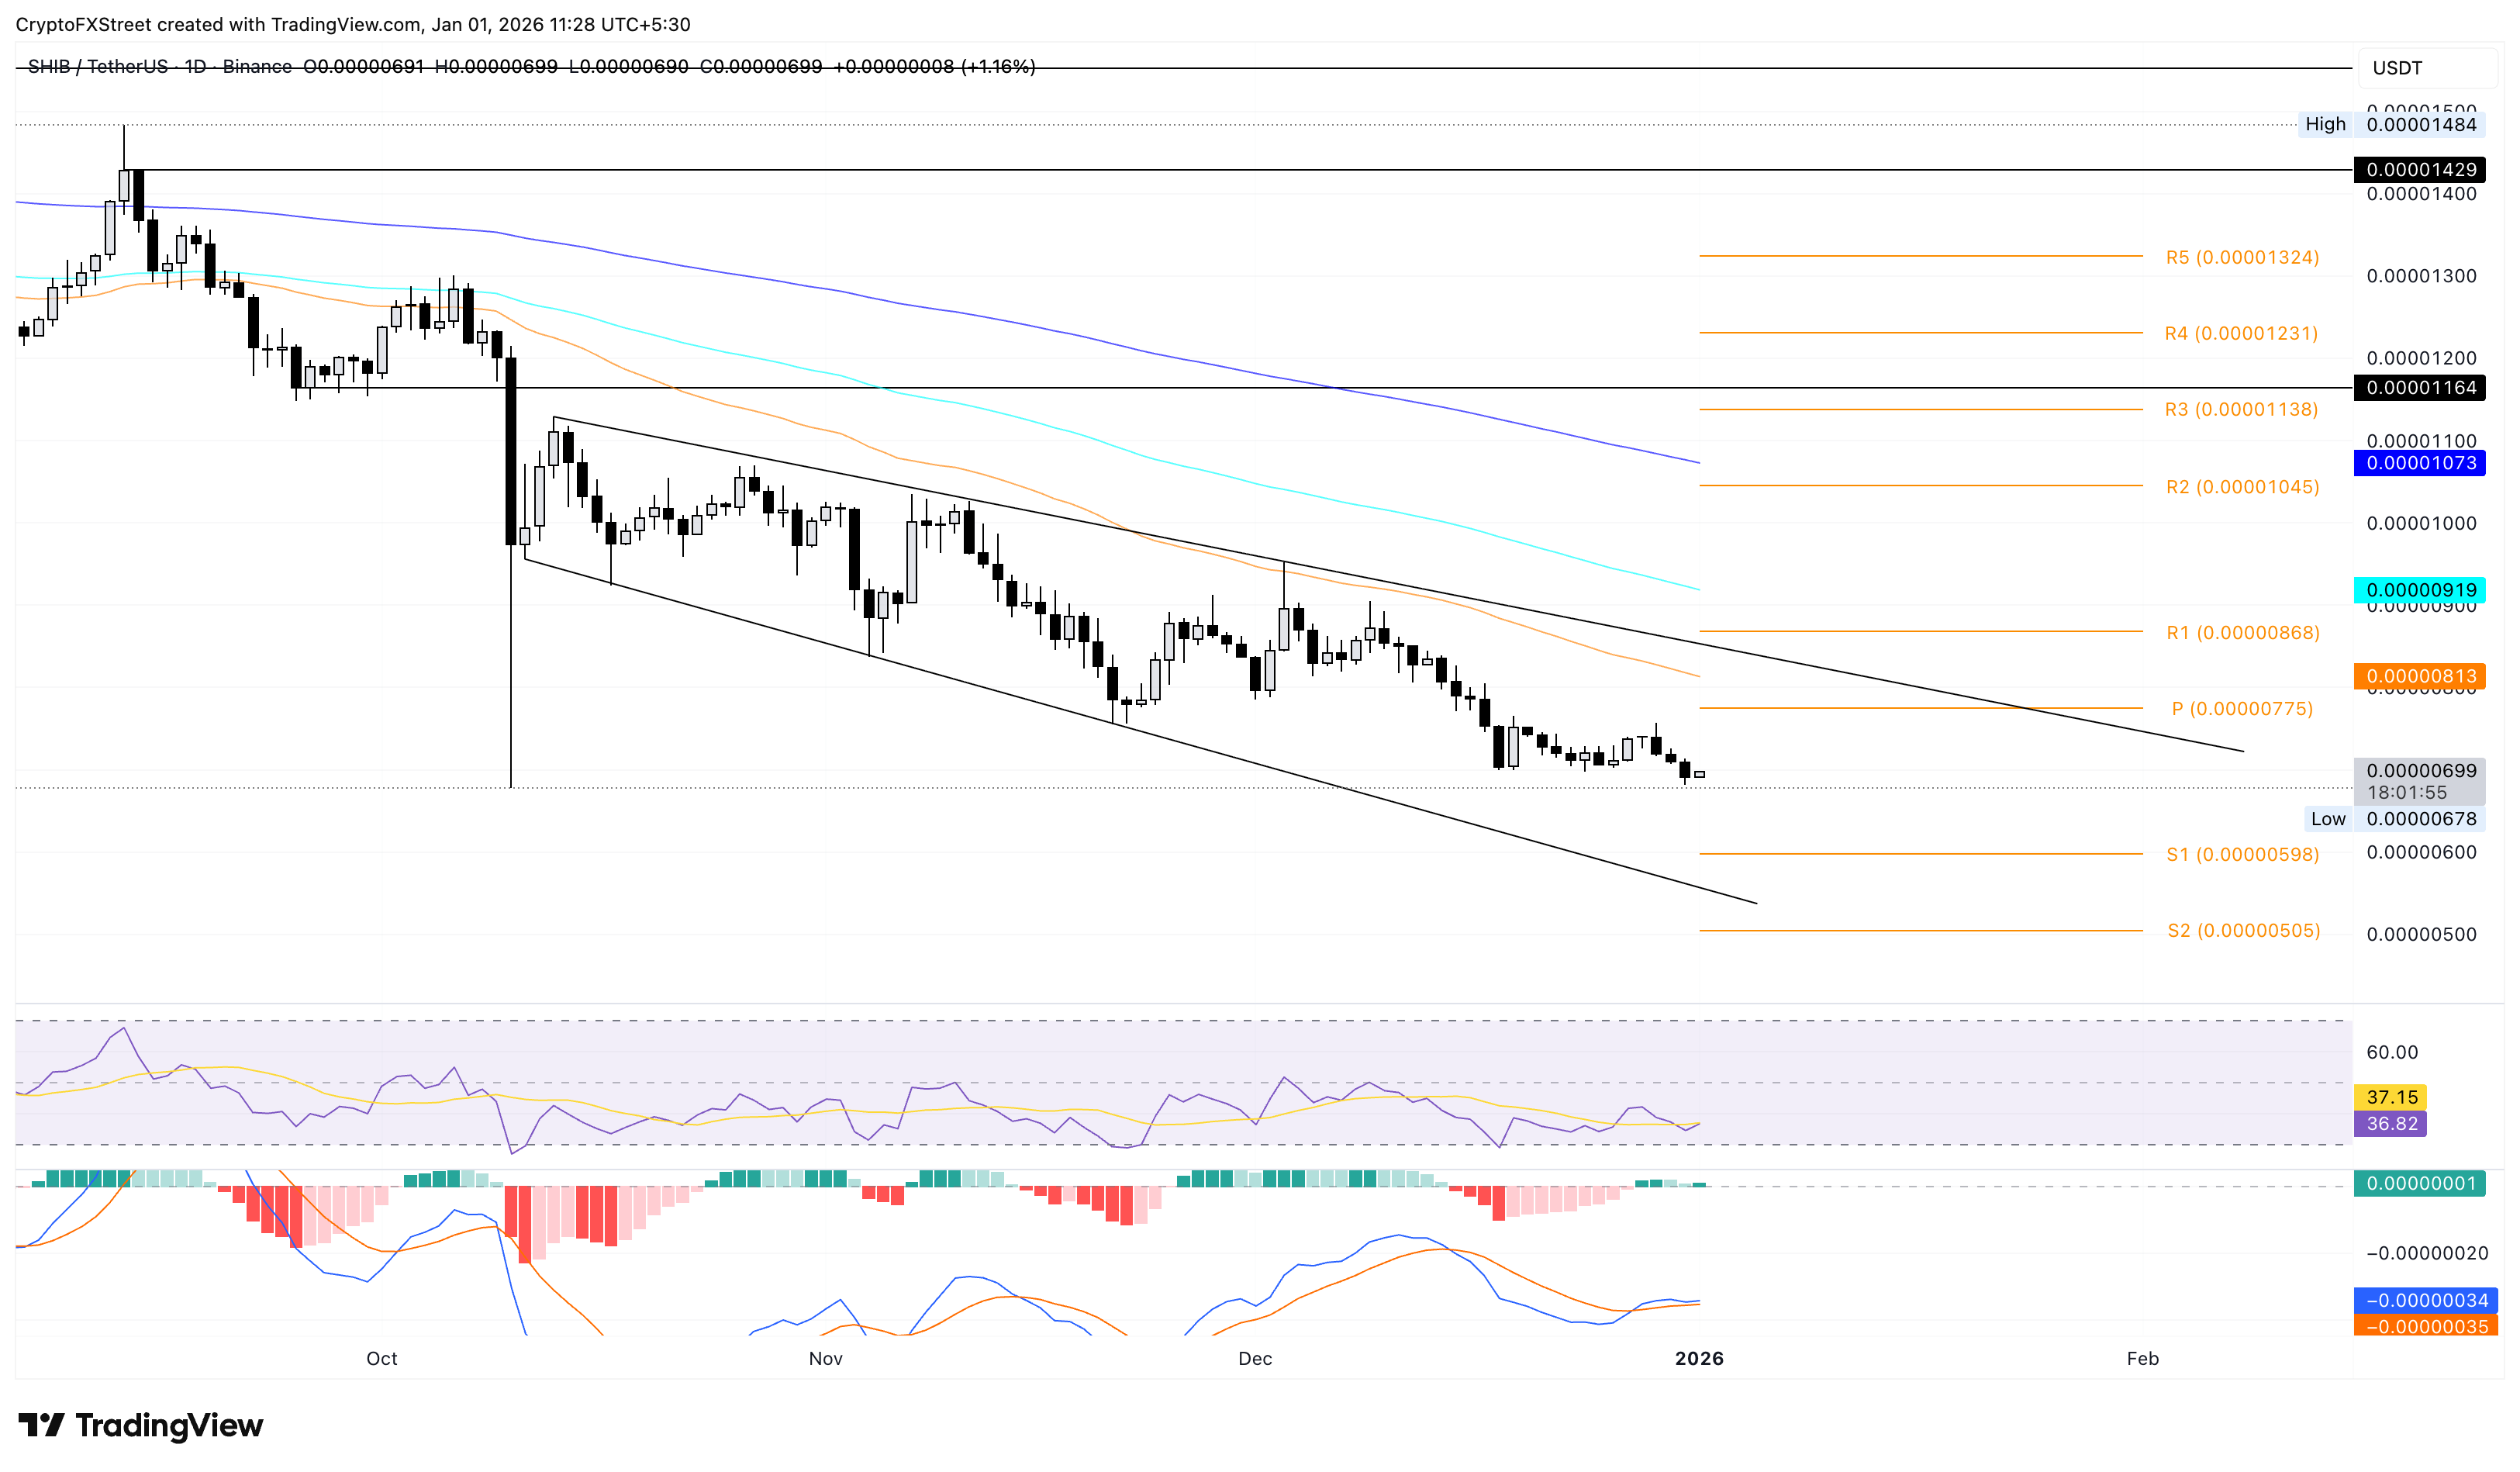
Looking down, the crucial support for SHIB lies at the S1 Pivot Point at $0.00000598.
Pepe’s recovery lacks momentum
Pepe edges higher by over 1% at press time on Thursday, turning around after Wednesday’s 2.66% drop. If the frog-themed meme coin extends its recovery, the R1 Pivot Point at $0.00000424 remains a crucial level of resistance.
The technical indicators on the daily chart remain neutral, with the RSI at 45 approaching the halfway line, while the MACD and signal line stay in an uptrend. However, a reduction in green histogram bars in the MACD indicator suggests a decline in bullish momentum.
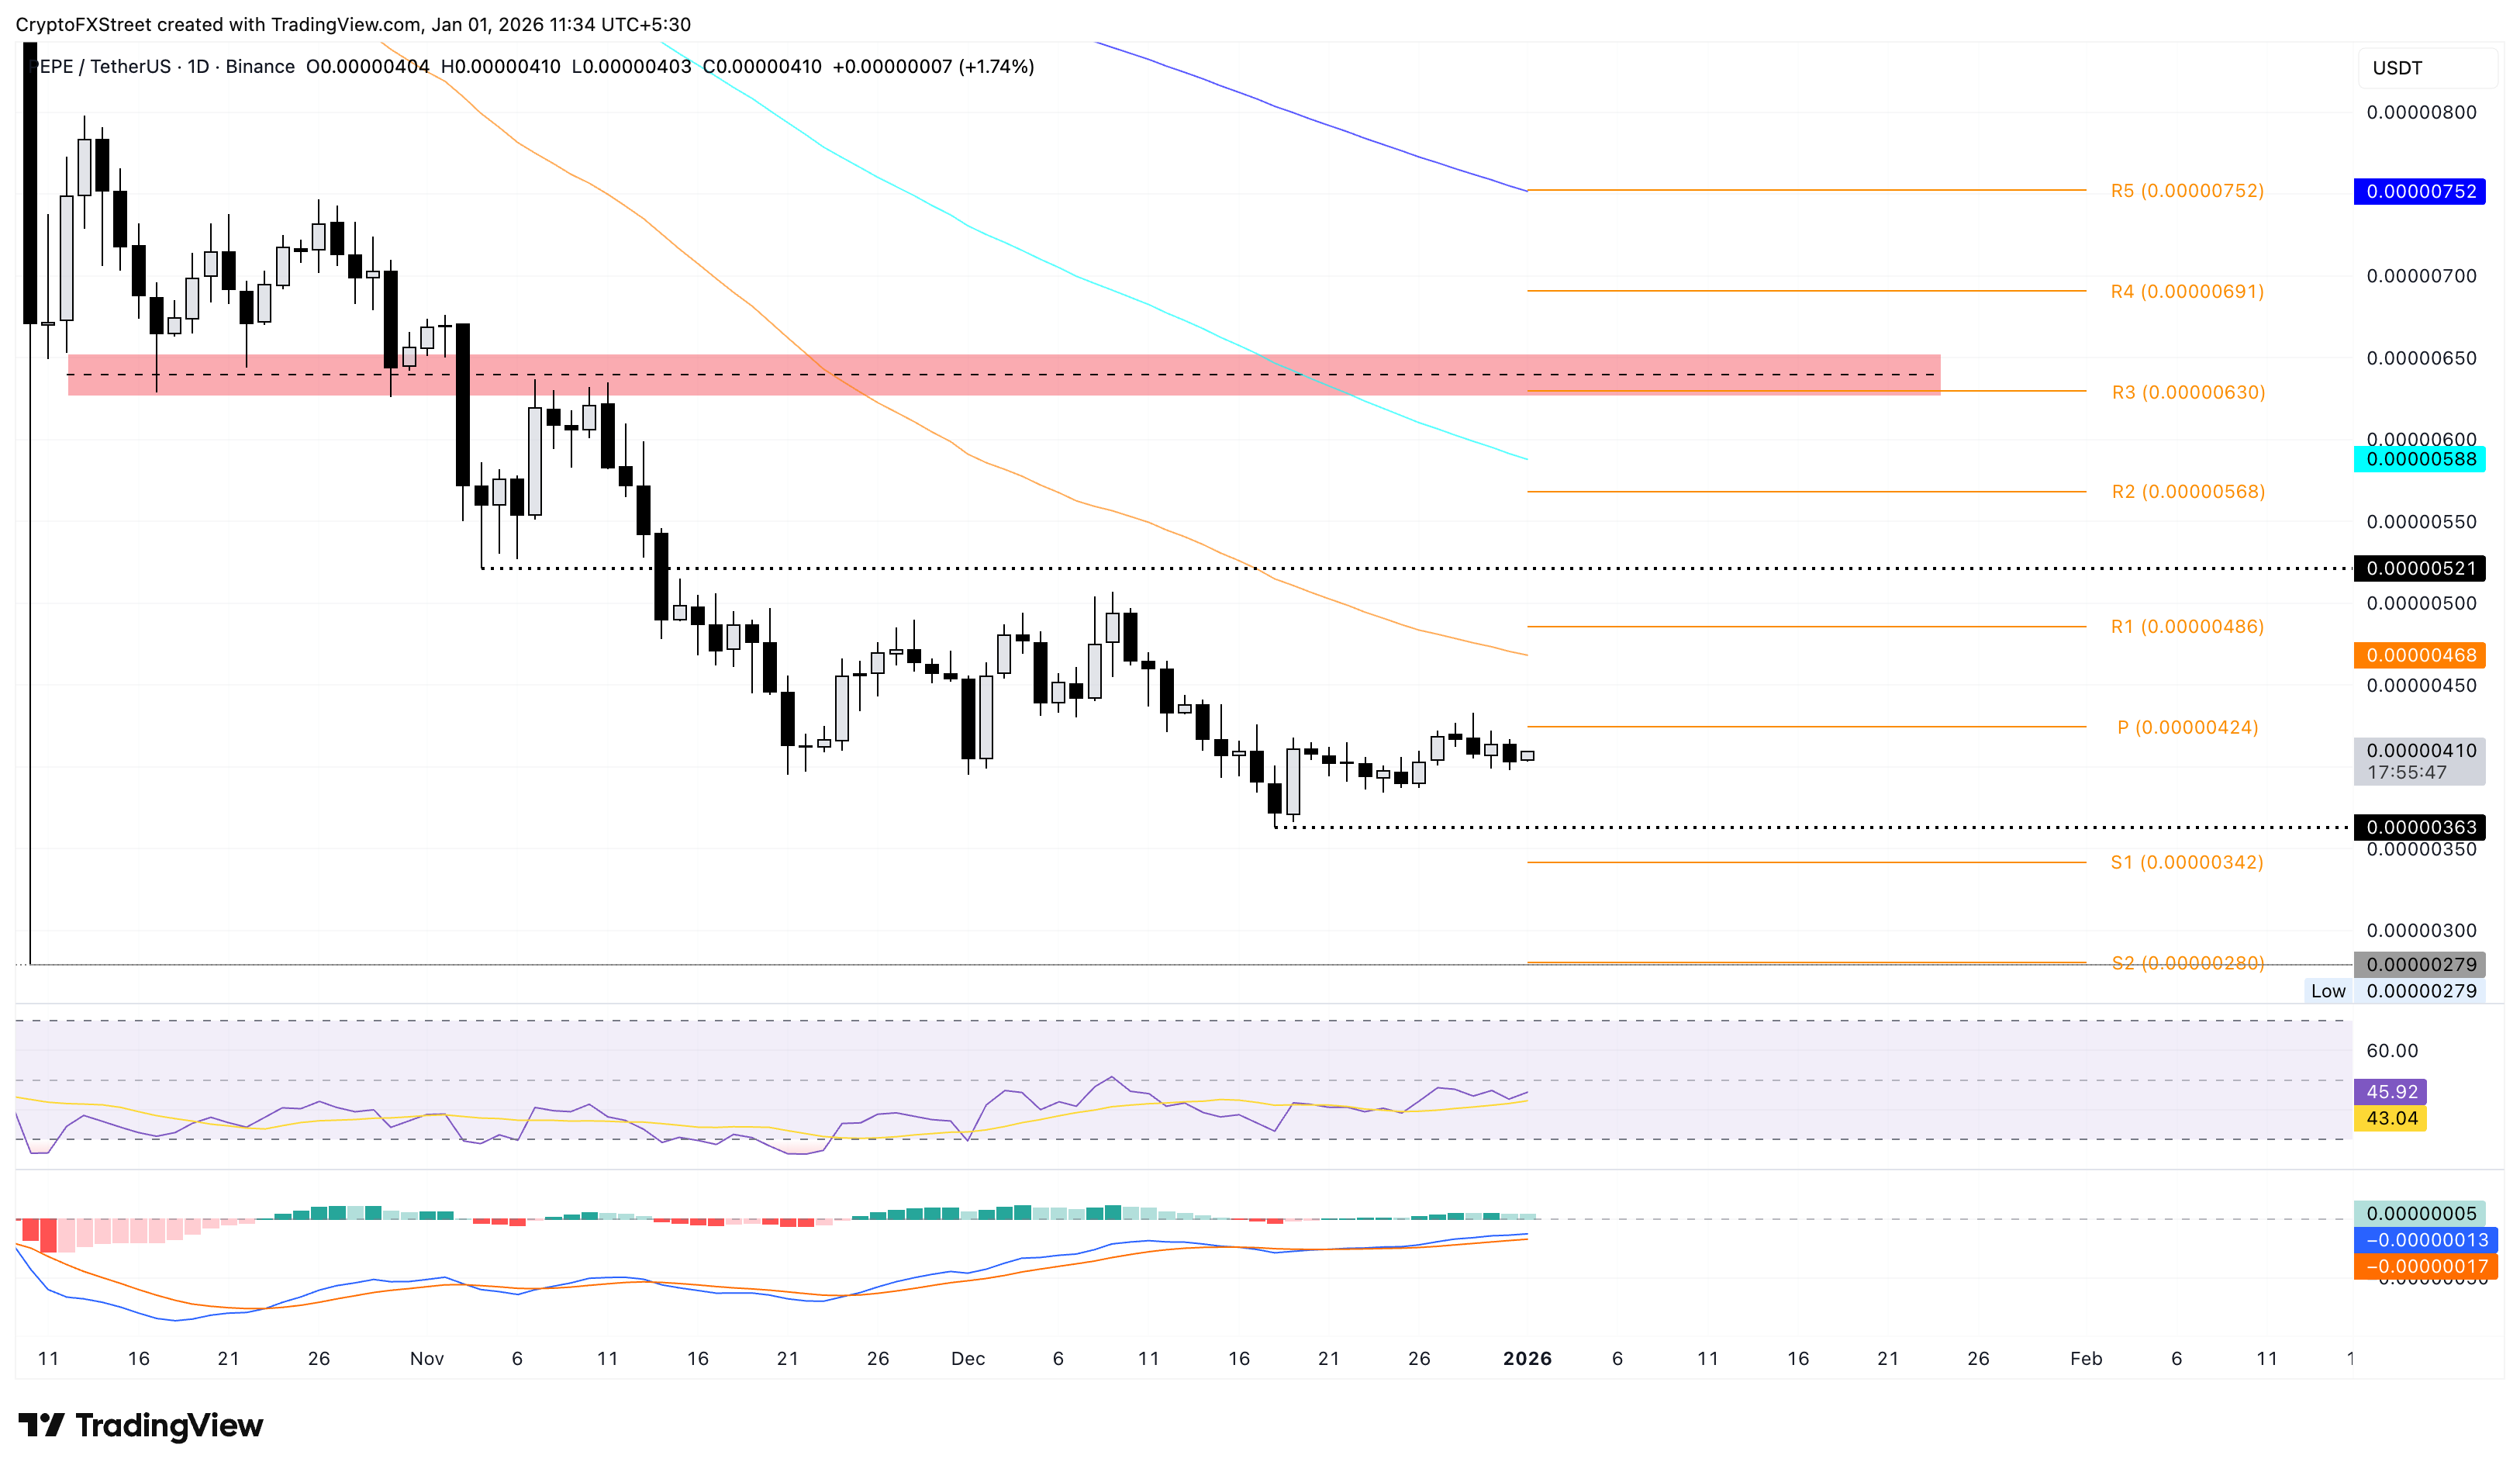
On the flip side, a reversal to the downside could push PEPE toward the December 18 low at $0.00000363.
Nothing in this material constitutes investment advice, personal recommendation, investment research, an offer, or a solicitation to buy or sell any financial instrument. The content has been prepared without consideration of your individual investment objectives, financial situation, or needs, and should not be treated as such.
Past performance is not a reliable indicator of future performance and/or results. Forward-looking scenarios or forecasts are not a guarantee of future performance. Actual results may differ materially from those anticipated.
Mitrade makes no representation or warranty as to the accuracy or completeness of the information provided and accepts no liability for any loss arising from reliance on such information.
Recommended Articles


