

Crypto Today: Bitcoin, Ethereum, XRP pause uptrend amid mixed ETF flows, weak sentiment
- Bitcoin steadies above the 50-day EMA support after correcting from highs above $94,000 as ETF flows turn negative.
- Ethereum struggles to resume its uptrend despite ETF inflows extending for the third consecutive day.
- XRP trims gains as selling pressure intensifies below a multi-month trendline.
Bitcoin (BTC) extends correction below the $93,000 mark at the time of writing on Wednesday, signaling a cooldown from the early-year rally that touched $94,789 on Monday. Altcoins, including Ethereum (ETH) and Ripple (XRP), are also facing headwinds amid uncertainty in market sentiment.
The largest smart contracts token, ETH, is hovering above $3,200, down over 1%, while the cross-border remittance token, XRP, has corrected from the weekly high of $2.42 to trade at $2.24.
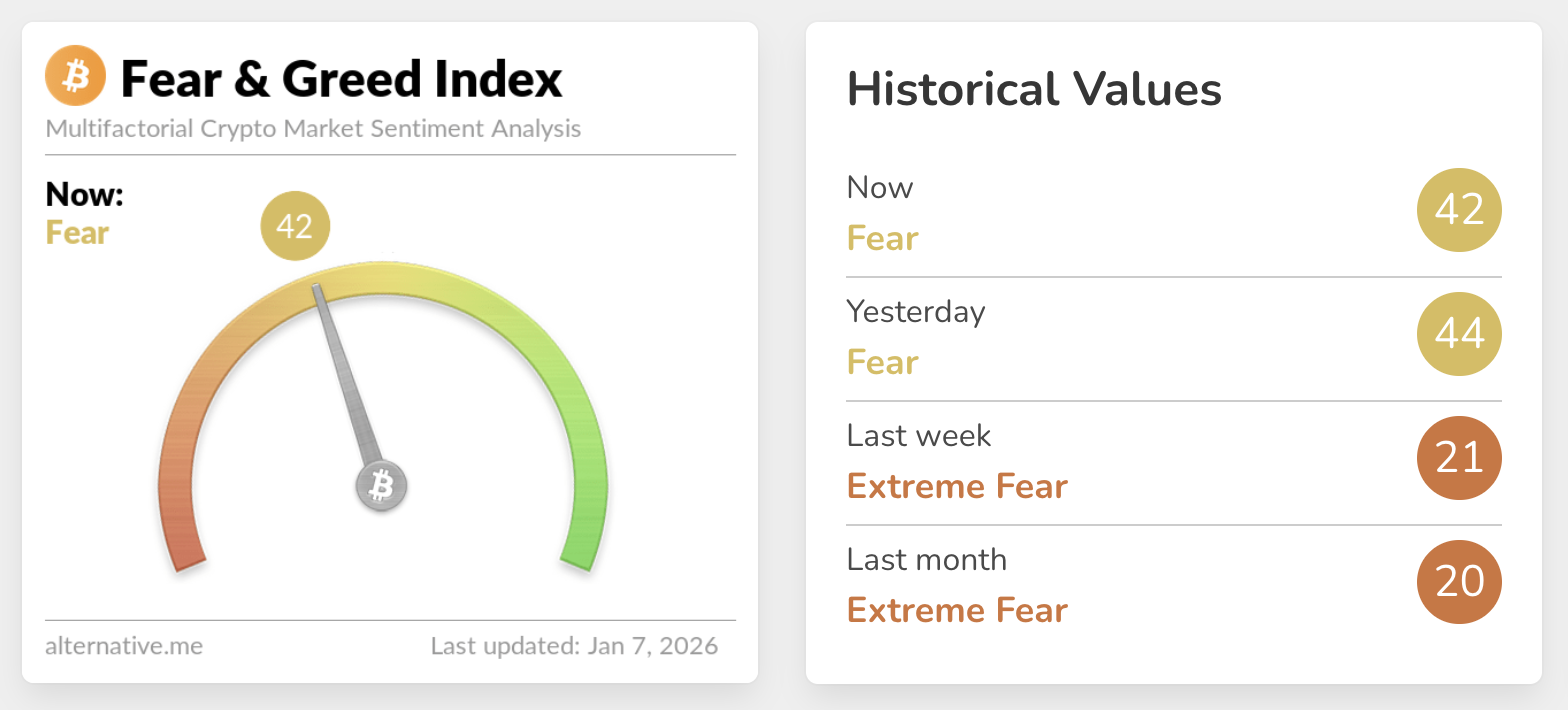
The Crypto Fear & Greed Index is at 42, highlighting a sticky fear sentiment in the broader cryptocurrency market despite improving from extreme fear last week, according to data by Alternative. Positive sentiment remains critical for steady price increases, while fear suggests uncertainty and lack of confidence in the broader trend.
Ethereum, XRP ETF inflows extend as Bitcoin posts outflows
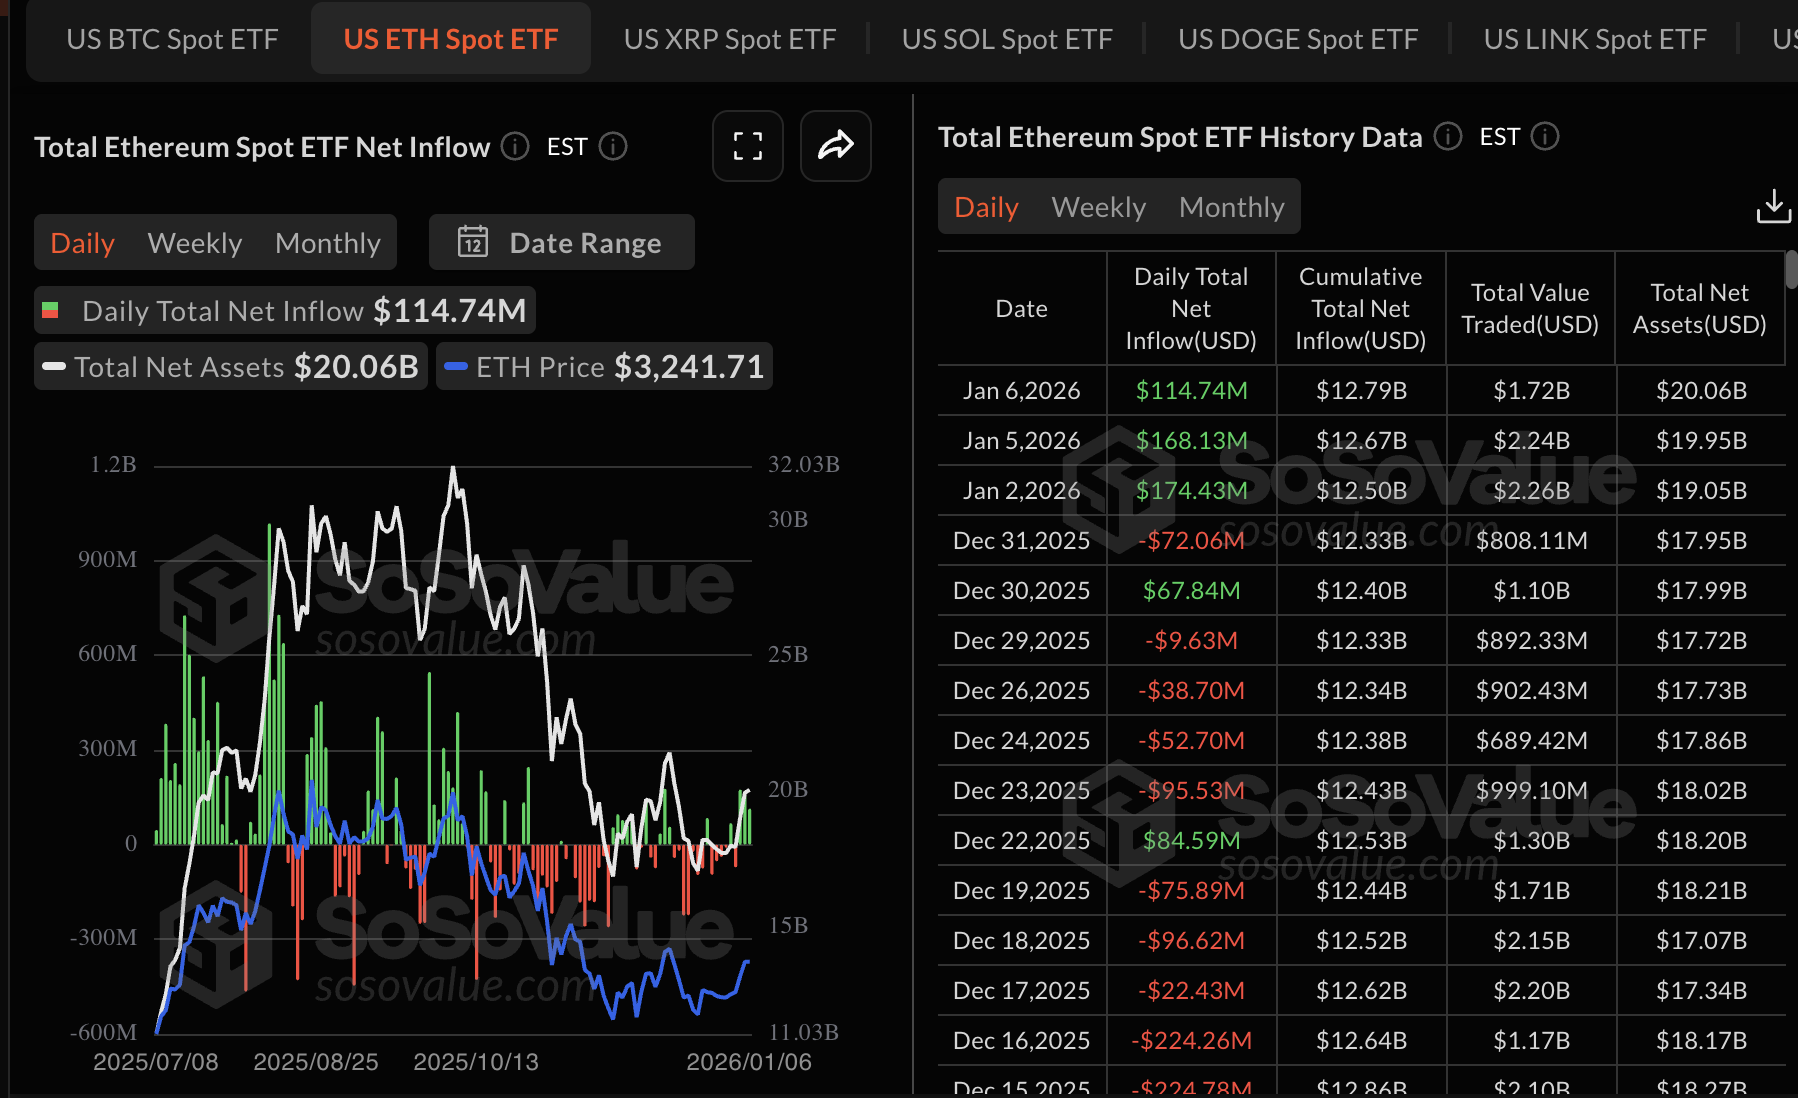
Ethereum spot Exchange Traded Funds (ETFs) extended their inflow streak for the third consecutive day, drawing approximately $115 million on Tuesday, $168 million on Monday and $174 million on Friday. BlackRock’s ETHA ETF outperformed with a total inflow of $199 million, followed by 21Shares’ TETH with $1.62 million. The cumulative inflow stands at $12.79 billion, and net assets at $20 billion.
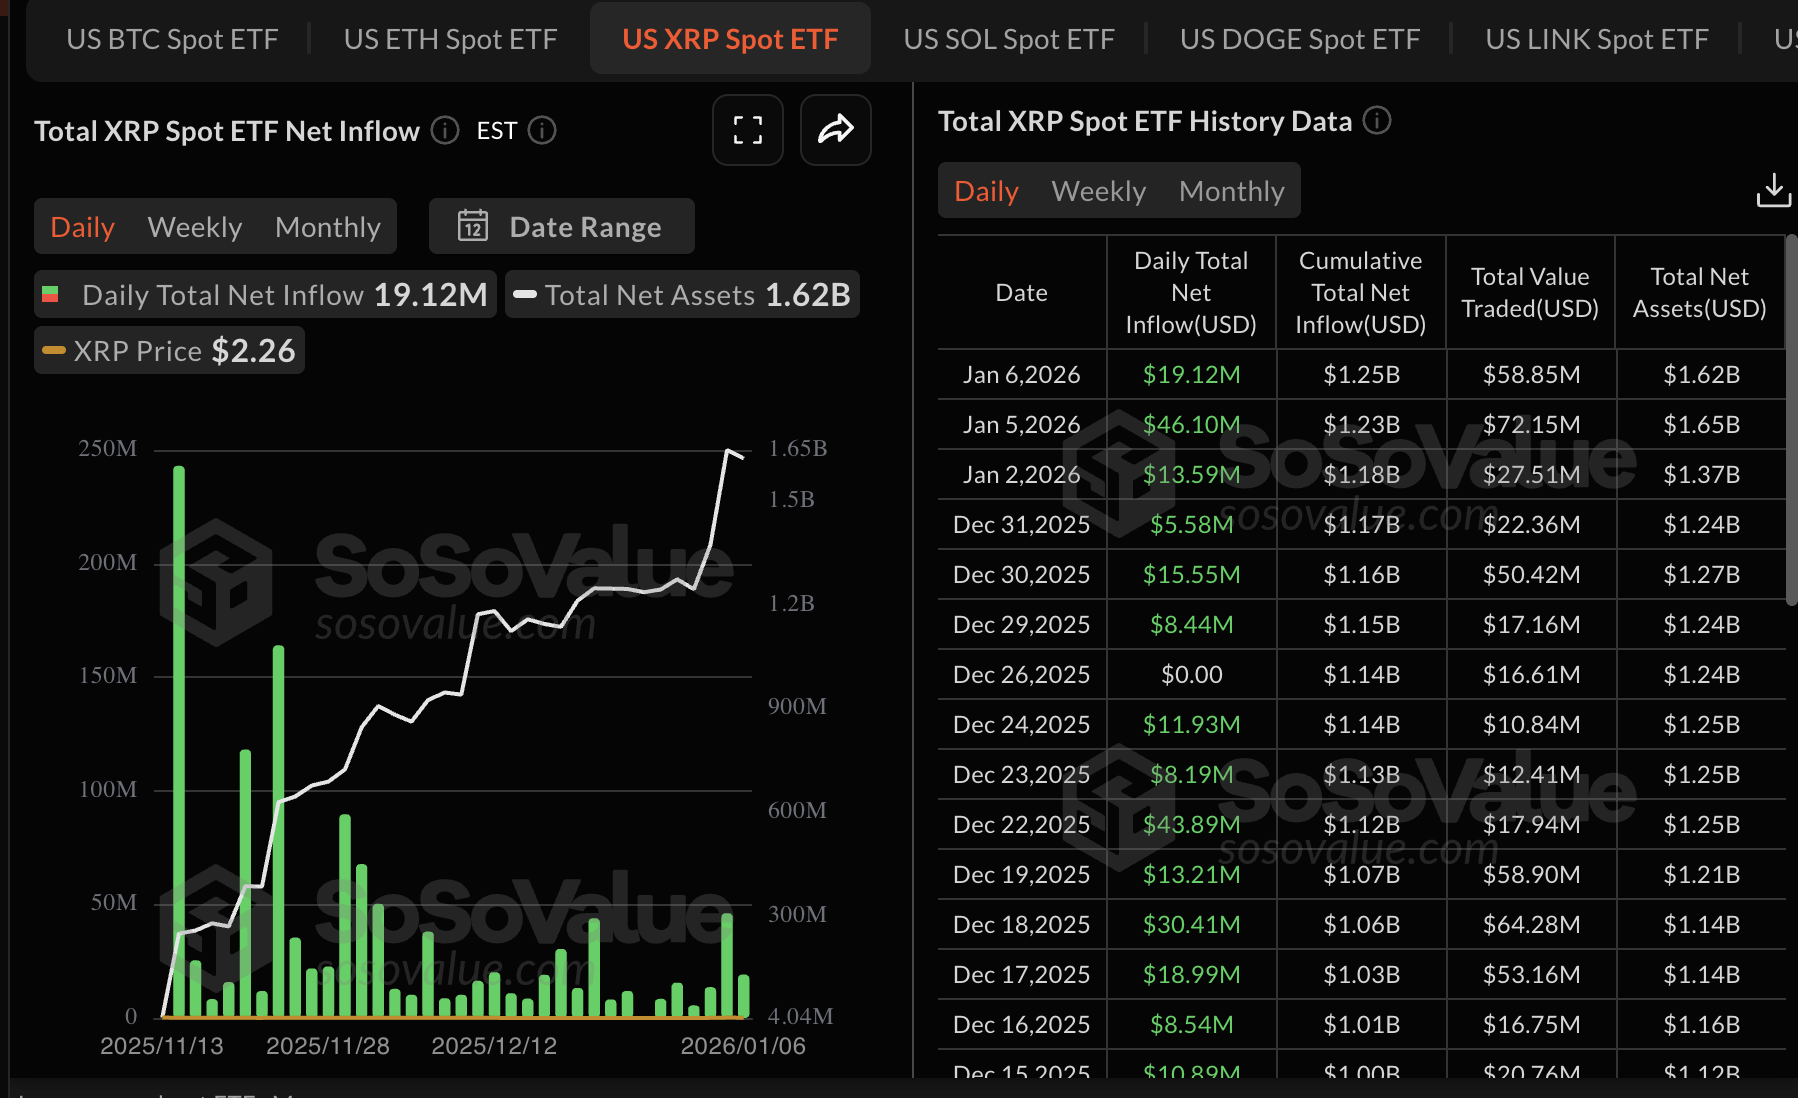
XRP ETFs saw inflows of approximately $19 million on Tuesday, marking a significant step down from the $46 million recorded on Monday. Despite the decline in volume, interest in US-listed XRP ETFs has steadied since their debut in November, boosting cumulative inflows to $1.25 billion and related net assets to $1.62 billion.
Meanwhile, Bitcoin ETFs shifted negative on Tuesday, as investors withdrew approximately $243 million. The outflow followed two consecutive days of inflows totaling approximately $679 million and $471 million, respectively, on Monday and Friday. BlackRock’s IBIT ETF was the only product in the green on Tuesday, with roughly $229 million in inflows. The cumulative inflow stands at $57.54 billion, and net assets at $120.85 billion.
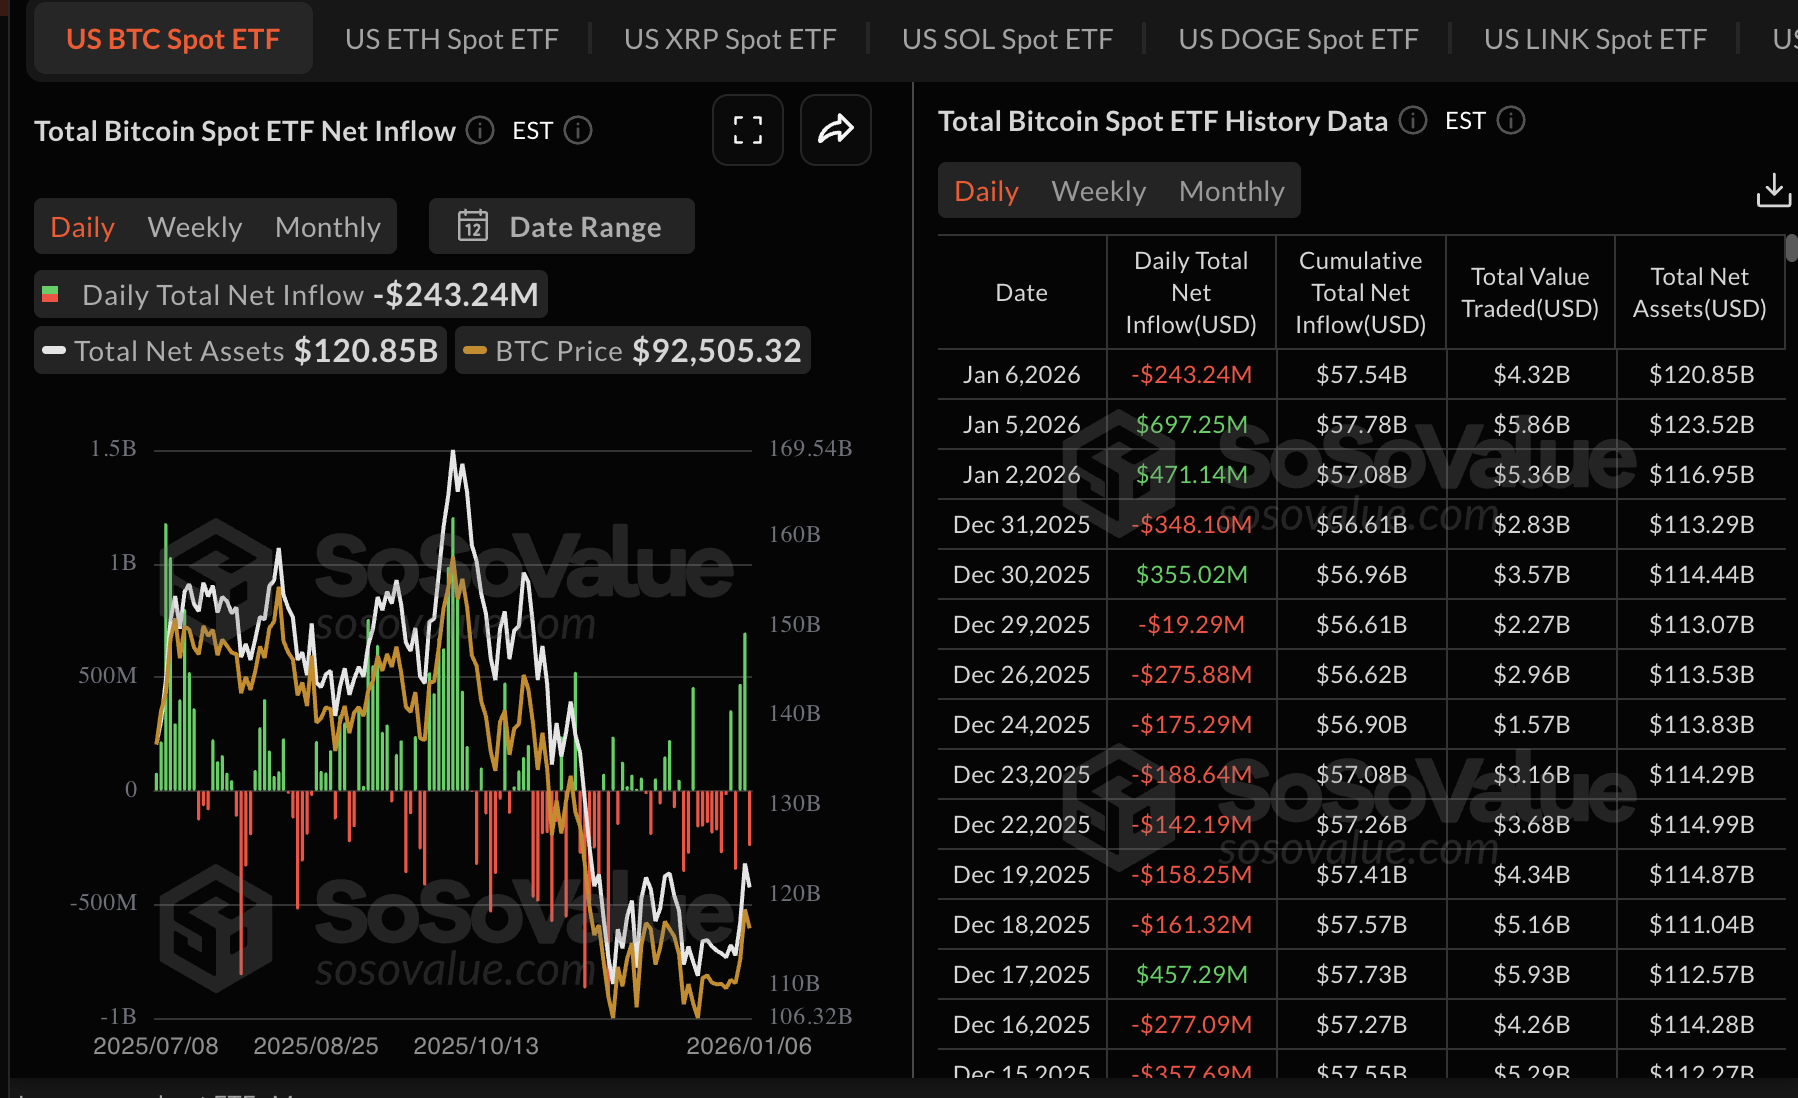
Chart of the day: Bitcoin trades under pressure as technical structure weakens
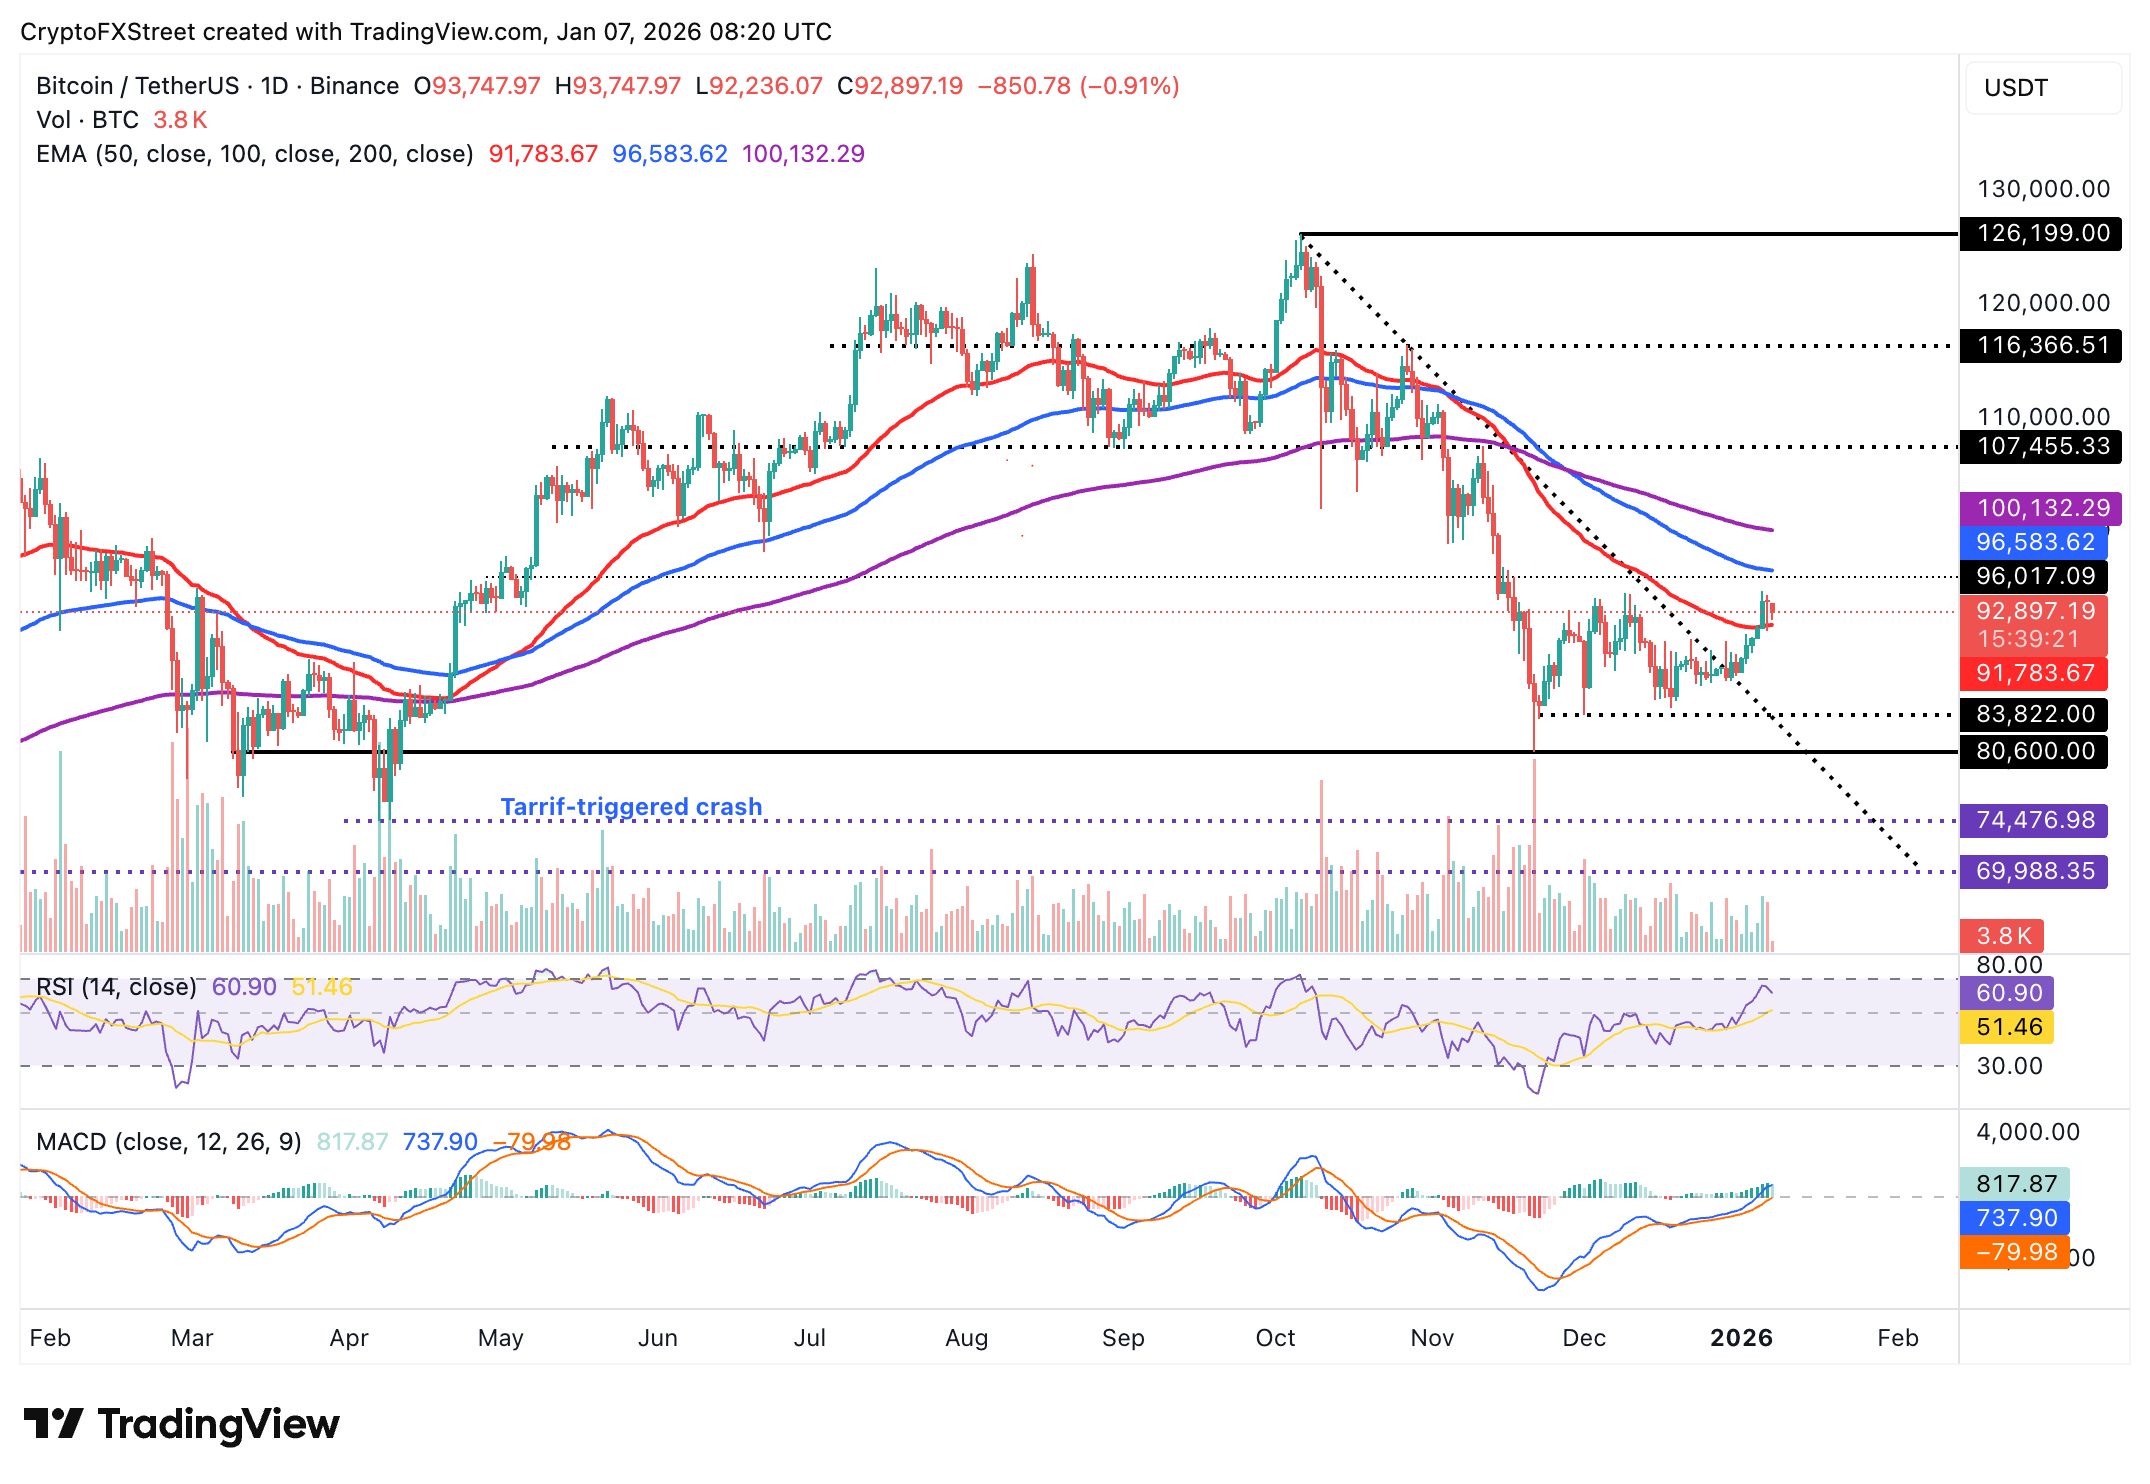
Bitcoin is extending its correction toward $92,000 support at the time of writing on Wednesday, as selling intensifies. The Relative Strength Index (RSI) has declined to 60 on the daily chart, indicating fading bullish momentum.
Despite the 50-day Exponential Moving Average (EMA) providing support at $91,784, the correction could extend as the RSI nears the midline. Extending the decline below the moving average level would trigger another sell-off below $90,000.
Still, the Moving Average Convergence Divergence (MACD) indicator on the same daily chart has maintained a positive divergence since December 21, which could prompt traders to increase their risk exposure and add to the tailwind.
A close above the 50-day EMA would affirm Bitcoin’s short-term bullish outlook, while a break beyond the 100-day EMA at $96,584 could signal an extended uptrend toward $100,000.
Altcoins technical outlook: Ethereum, XRP falter as fear grips the market
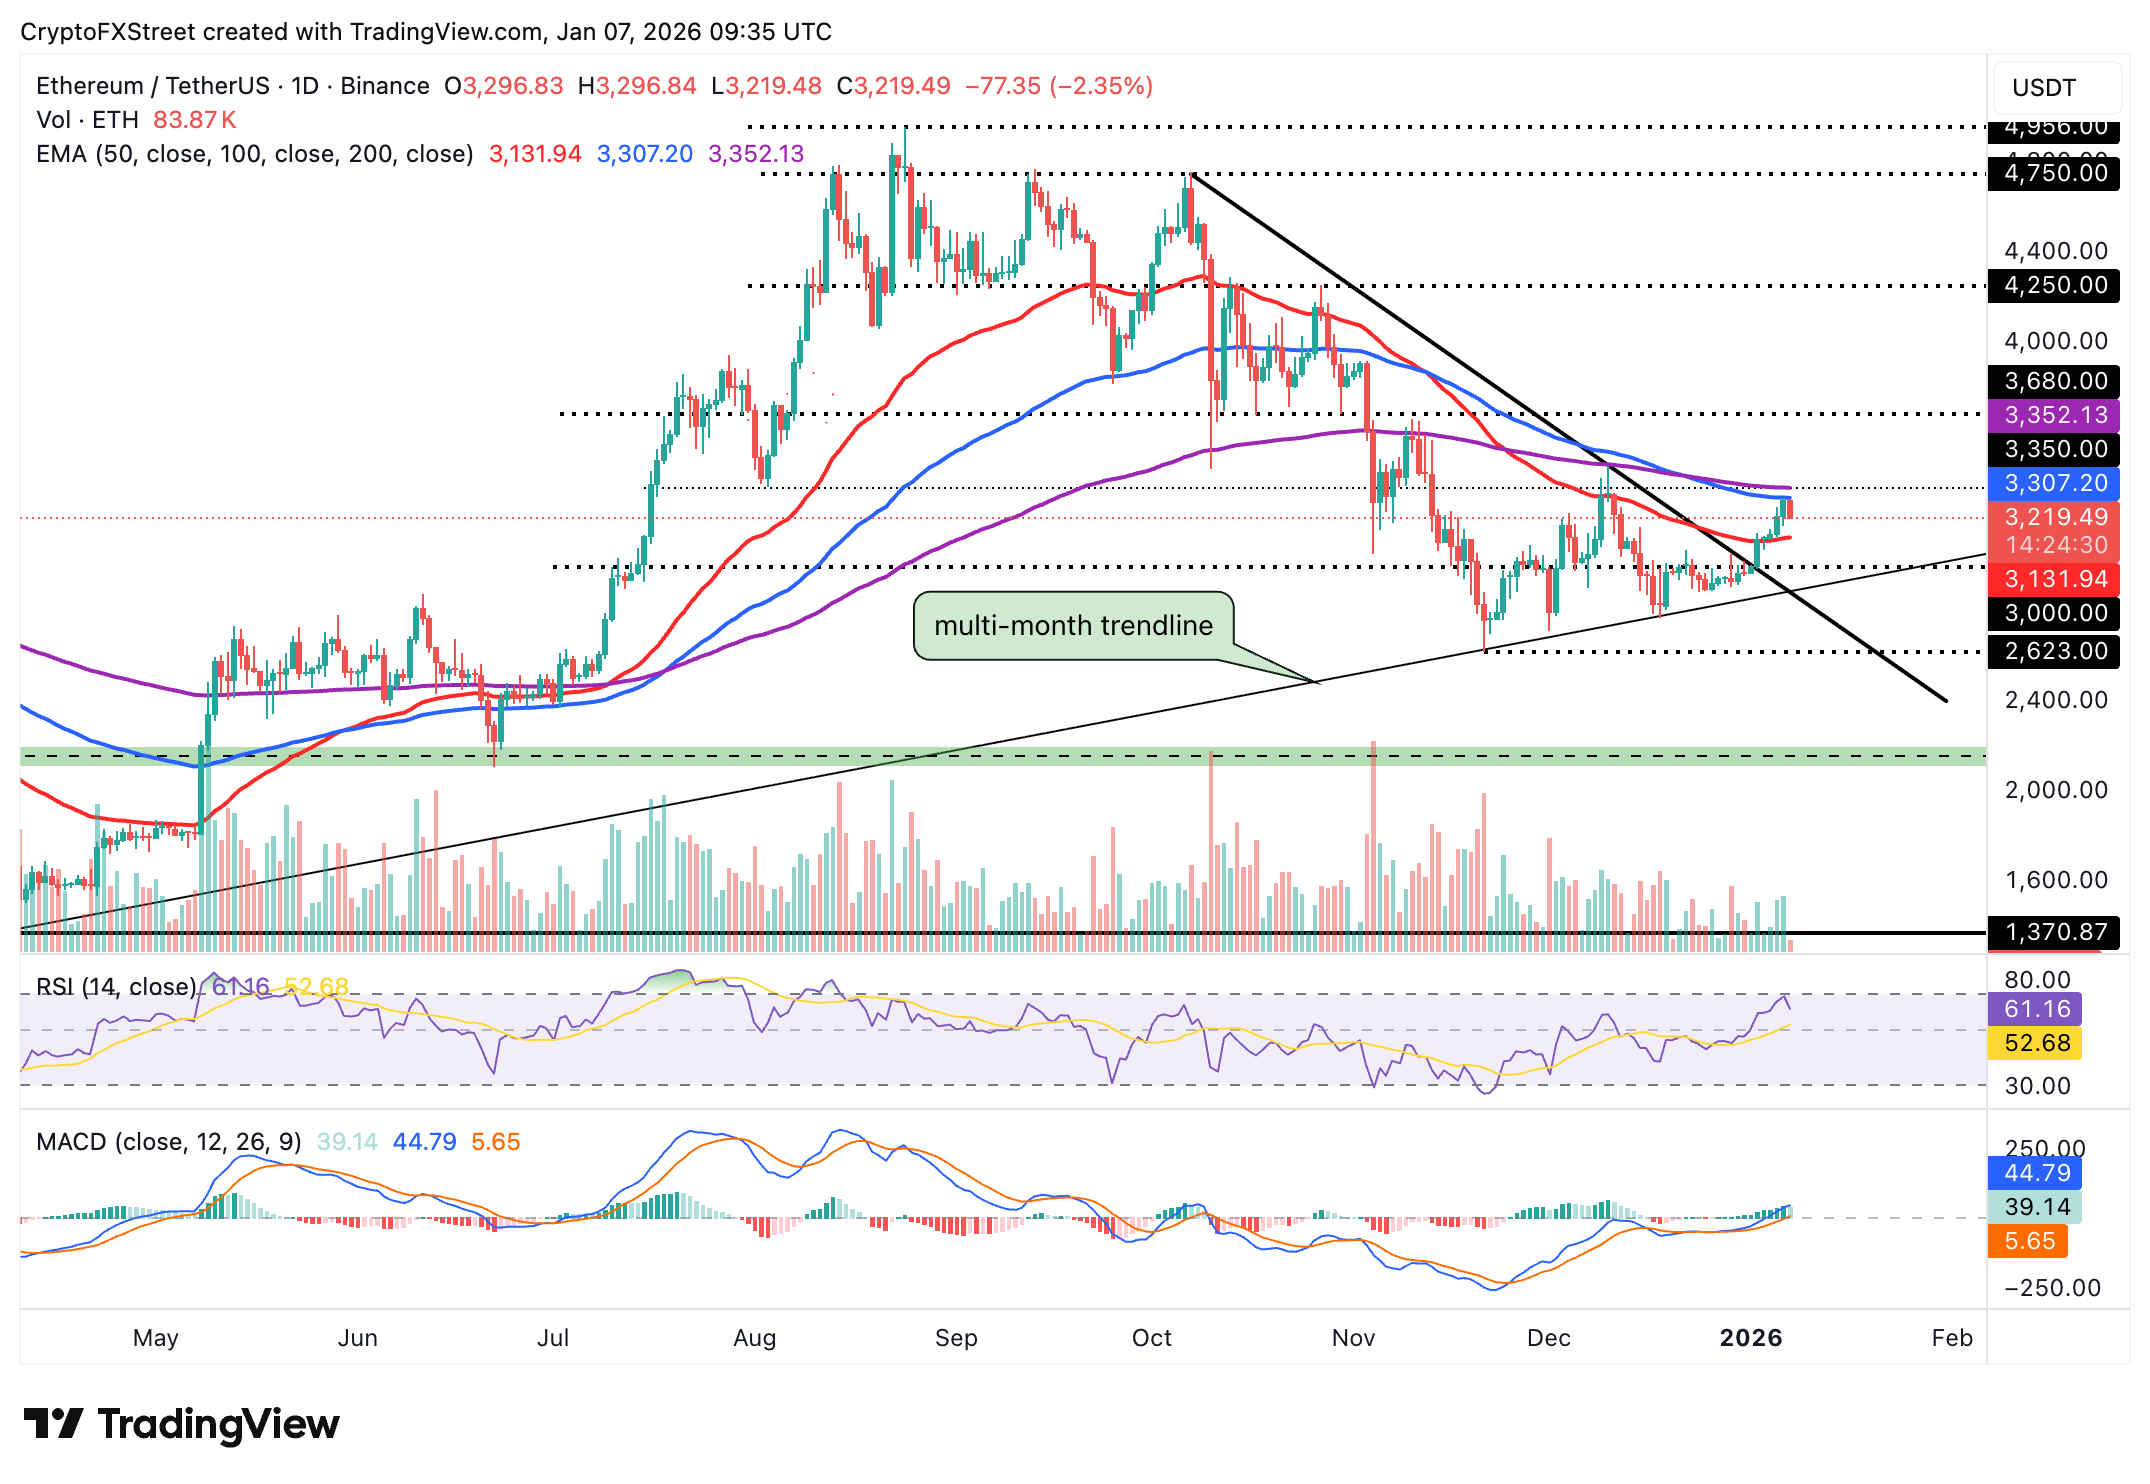
Ethereum is trading under pressure on Wednesday, declining from an intraday high of $3,299 to $3,220. The 100-day EMA caps the upside at $3,307 while the 200-day EMA emphasizes the hurdle at $3,352.
The RSI on the daily chart holds at 61 and is dropping sharply toward the midline, as bullish momentum fades. Failure to push above the moving average cluster between $3,307 and $3,352 could keep ETH under pressure.
The 50-day EMA is in line to provide support at $3,132 and prevent the down leg from extending below $3,000. Meanwhile, a positive divergence in the MACD indicator still suggests that buyers have a slight edge over sellers. The green histogram bars should continue to expand above the mean line to support Ethereum’s bullish thesis.
As for XRP, bears are pushing to close below the 100-day EMA at $2.23 after bullish exhaustion near a multi-month trendline from the record high of $3.66. The 200-day EMA also served as strong resistance at $2.35, adding to the ongoing headwinds.
The RSI has corrected from overbought territory to 64 on the daily chart, which indicates fading bullish momentum. A close below the 100-day EMA would result in a spike in risk-off sentiment, leaving XRP vulnerable to overhead pressure.
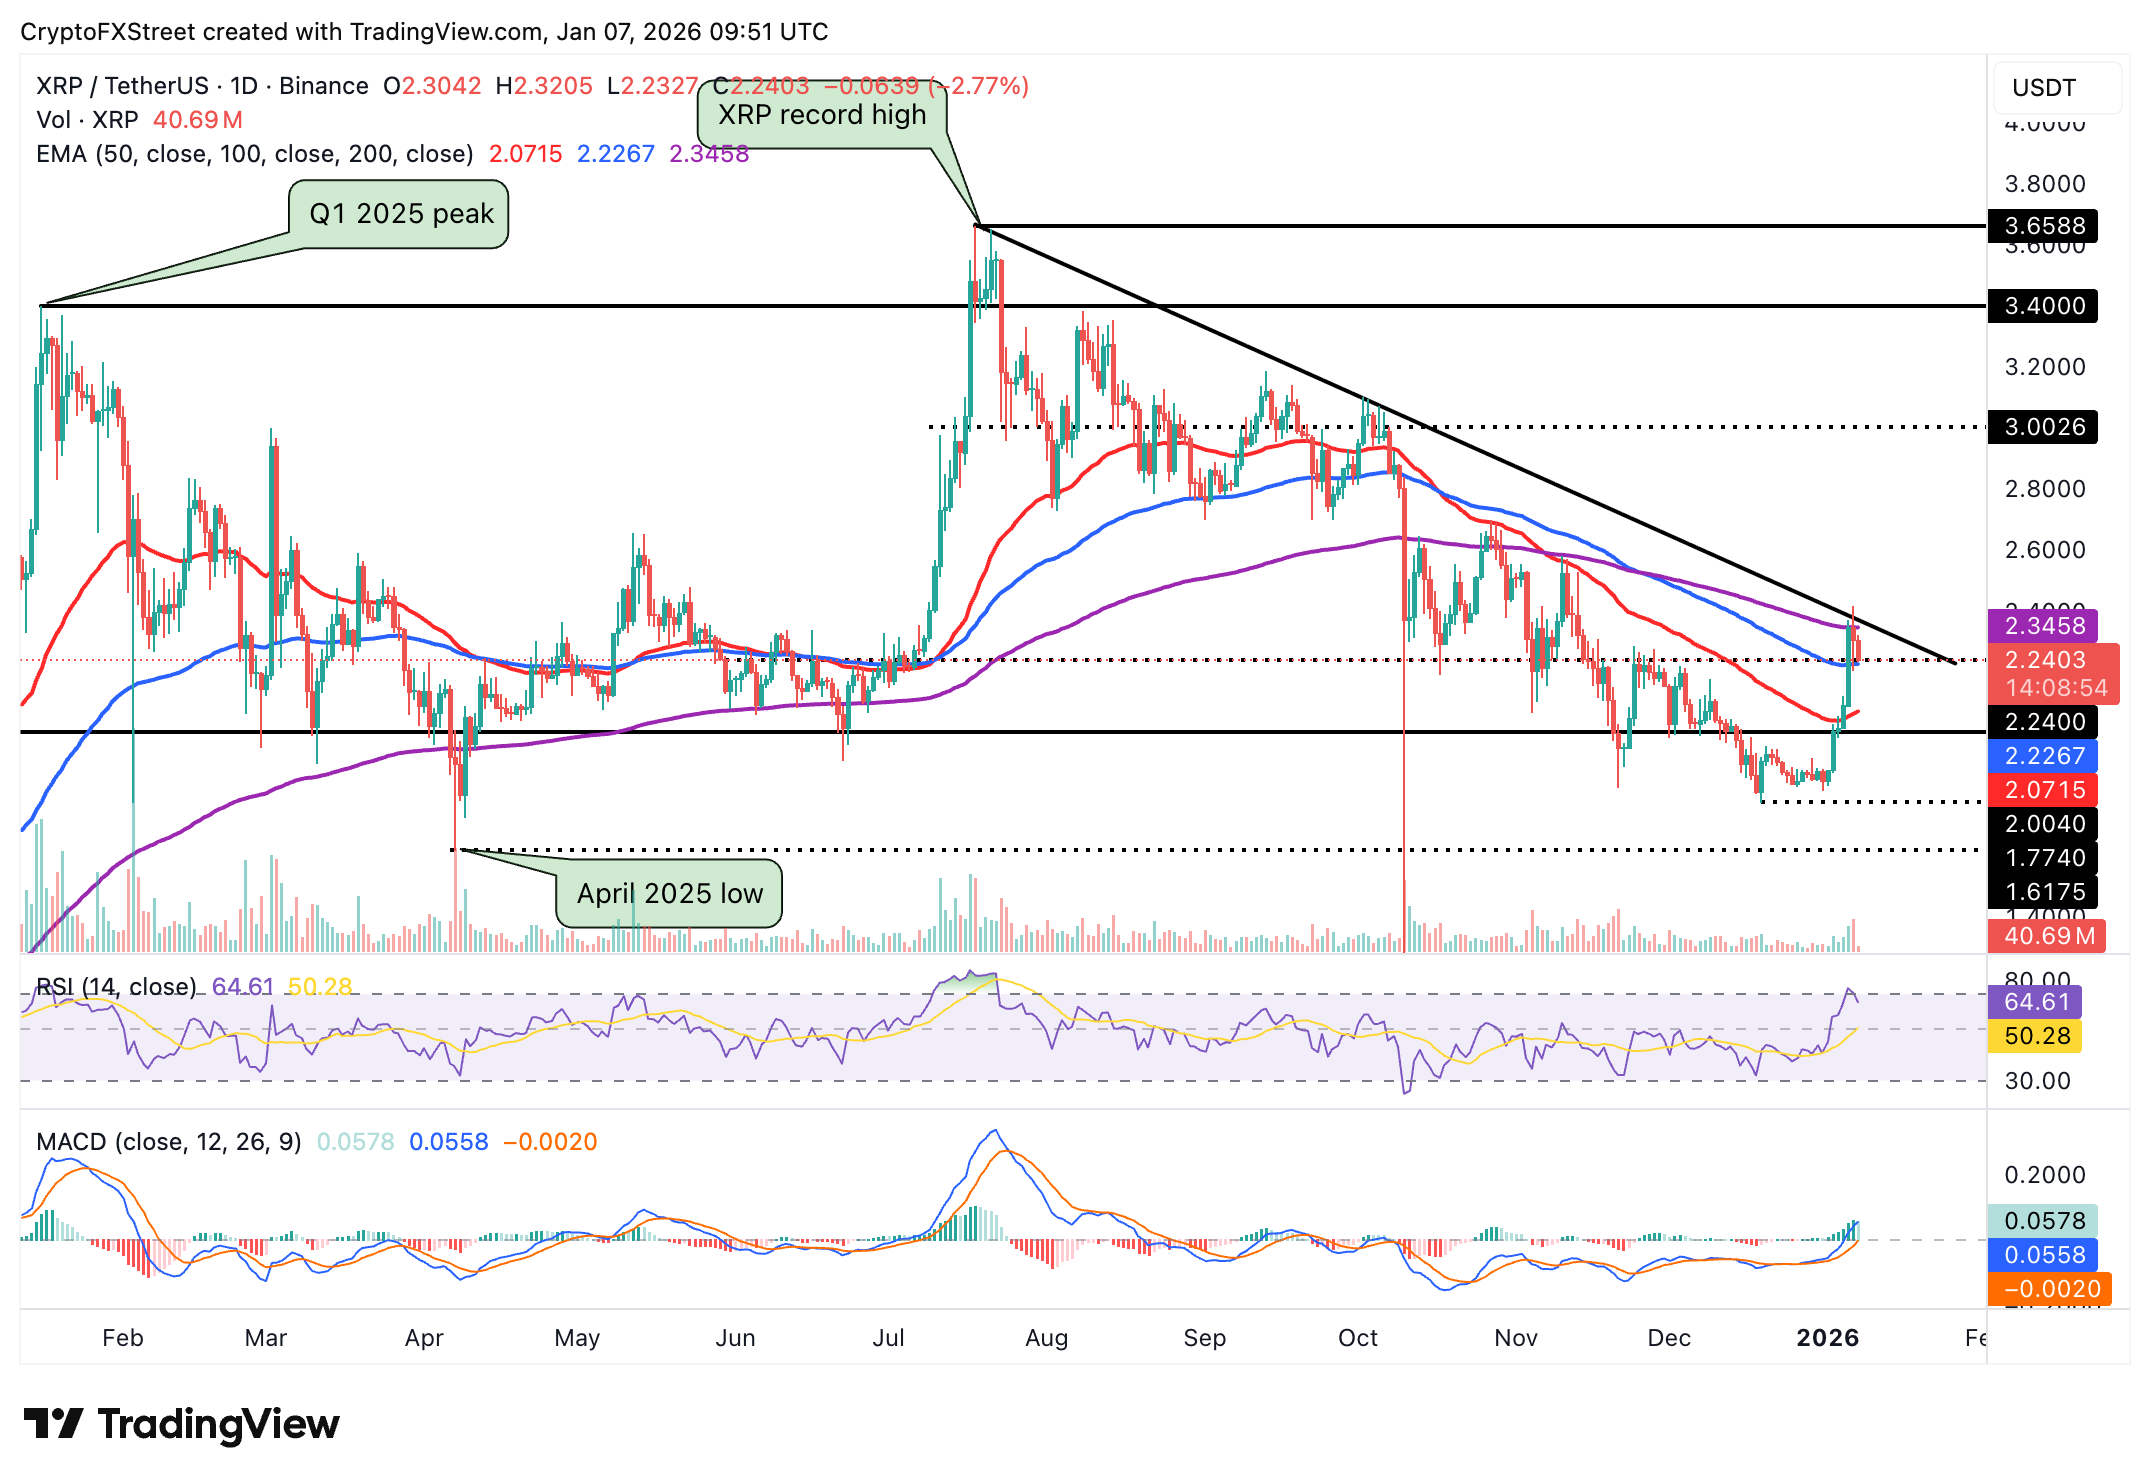
The 50-day EMA holds at $2.07, which could absorb the selling pressure and prevent an extended correction below $2.00. Still, traders may read the bullish MACD indicator, which continues to show positive divergence on the same chart, as a buy signal amid optimism for a larger breakout above the descending trendline.
Crypto ETF FAQs
An Exchange-Traded Fund (ETF) is an investment vehicle or an index that tracks the price of an underlying asset. ETFs can not only track a single asset, but a group of assets and sectors. For example, a Bitcoin ETF tracks Bitcoin’s price. ETF is a tool used by investors to gain exposure to a certain asset.
Yes. The first Bitcoin futures ETF in the US was approved by the US Securities & Exchange Commission in October 2021. A total of seven Bitcoin futures ETFs have been approved, with more than 20 still waiting for the regulator’s permission. The SEC says that the cryptocurrency industry is new and subject to manipulation, which is why it has been delaying crypto-related futures ETFs for the last few years.
Yes. The SEC approved in January 2024 the listing and trading of several Bitcoin spot Exchange-Traded Funds, opening the door to institutional capital and mainstream investors to trade the main crypto currency. The decision was hailed by the industry as a game changer.
The main advantage of crypto ETFs is the possibility of gaining exposure to a cryptocurrency without ownership, reducing the risk and cost of holding the asset. Other pros are a lower learning curve and higher security for investors since ETFs take charge of securing the underlying asset holdings. As for the main drawbacks, the main one is that as an investor you can’t have direct ownership of the asset, or, as they say in crypto, “not your keys, not your coins.” Other disadvantages are higher costs associated with holding crypto since ETFs charge fees for active management. Finally, even though investing in ETFs reduces the risk of holding an asset, price swings in the underlying cryptocurrency are likely to be reflected in the investment vehicle too.
Nothing in this material constitutes investment advice, personal recommendation, investment research, an offer, or a solicitation to buy or sell any financial instrument. The content has been prepared without consideration of your individual investment objectives, financial situation, or needs, and should not be treated as such.
Past performance is not a reliable indicator of future performance and/or results. Forward-looking scenarios or forecasts are not a guarantee of future performance. Actual results may differ materially from those anticipated.
Mitrade makes no representation or warranty as to the accuracy or completeness of the information provided and accepts no liability for any loss arising from reliance on such information.
Recommended Articles


