


Ripple Price Forecast: XRP risks sliding below $2.00 amid slowing institutional, retail demand
- XRP slips nearly 3% on Thursday, but holds the 50-day EMA as fear grips the broader cryptocurrency market.
- Institutional demand falters, with XRP ETFs registering their first outflow since their launch.
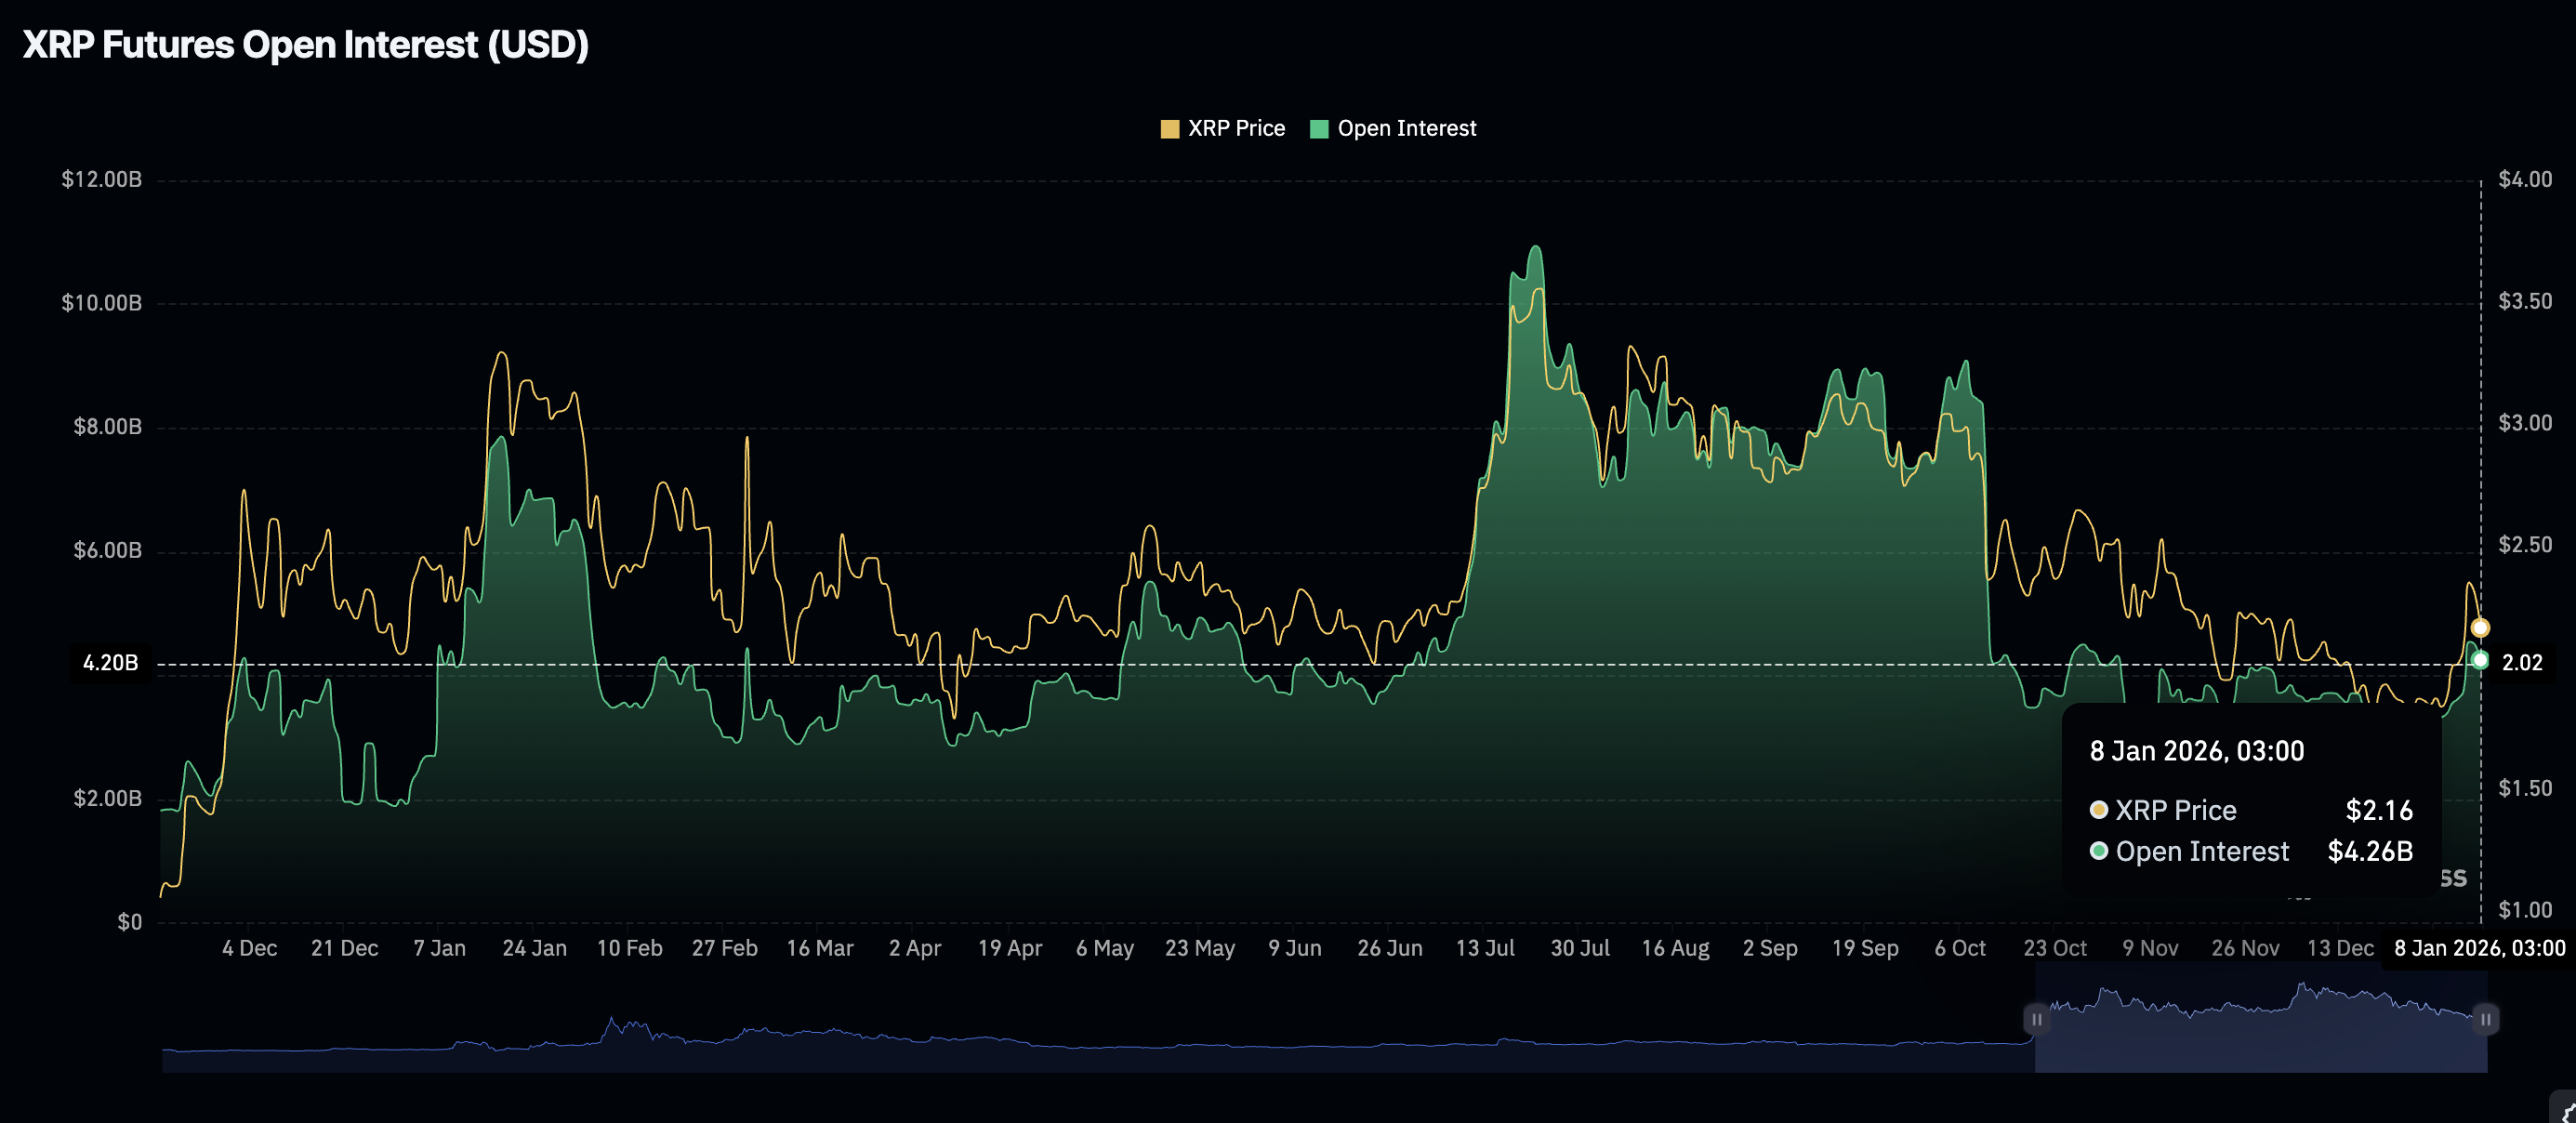
- XRP derivatives market faces declining retail interest as futures Open Interest falls to $4.26 billion.
Ripple (XRP) is trading down for the third consecutive day on Thursday amid escalating volatility in the cyrptocurrency market. After peaking at $2.41 on Tuesday, its highest print since November 14 amid the early-year rally, XRP has quickly ran into aggressive profit-taking.
Sellers have since taken control, with the cross-border payments token attempting to stabilize just above the psychological $2.00 handle. The broader crypto outlook has also deteriorated, with Bitcoin (BTC) briefly sliding below $90,000.
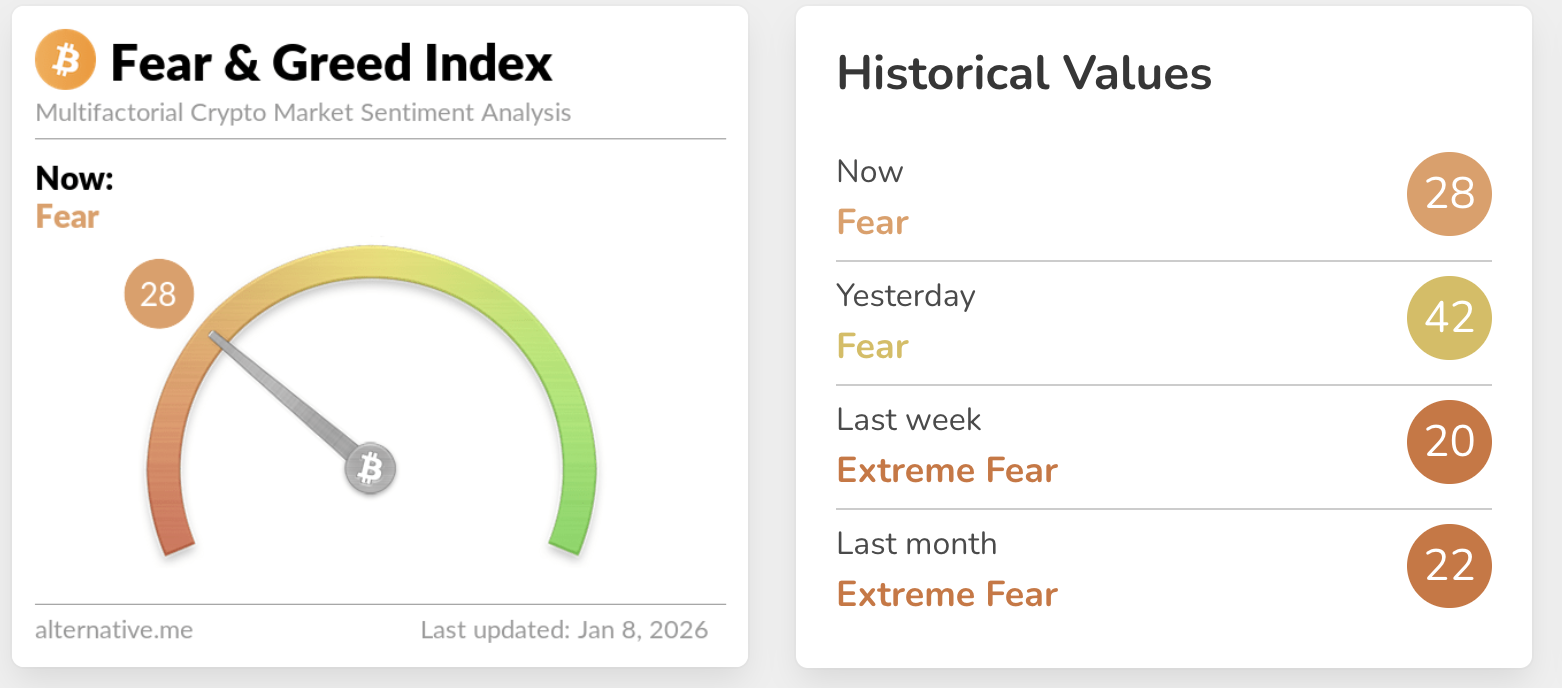
Market sentiment has also flipped decisively into fear, with the Crypto Fear & Greed Index by Alternative sliding to 28 after failing to sustain a move above 42 on Wednesday. Its sudden reversal underscores the loss of bullish momentum.
If $2.00 gives way, downside risks may intensify, with the November support at $1.77 and the April low near $1.61 emerging as the next key demand zones.
XRP risks extending decline as retail and institutional demand softens
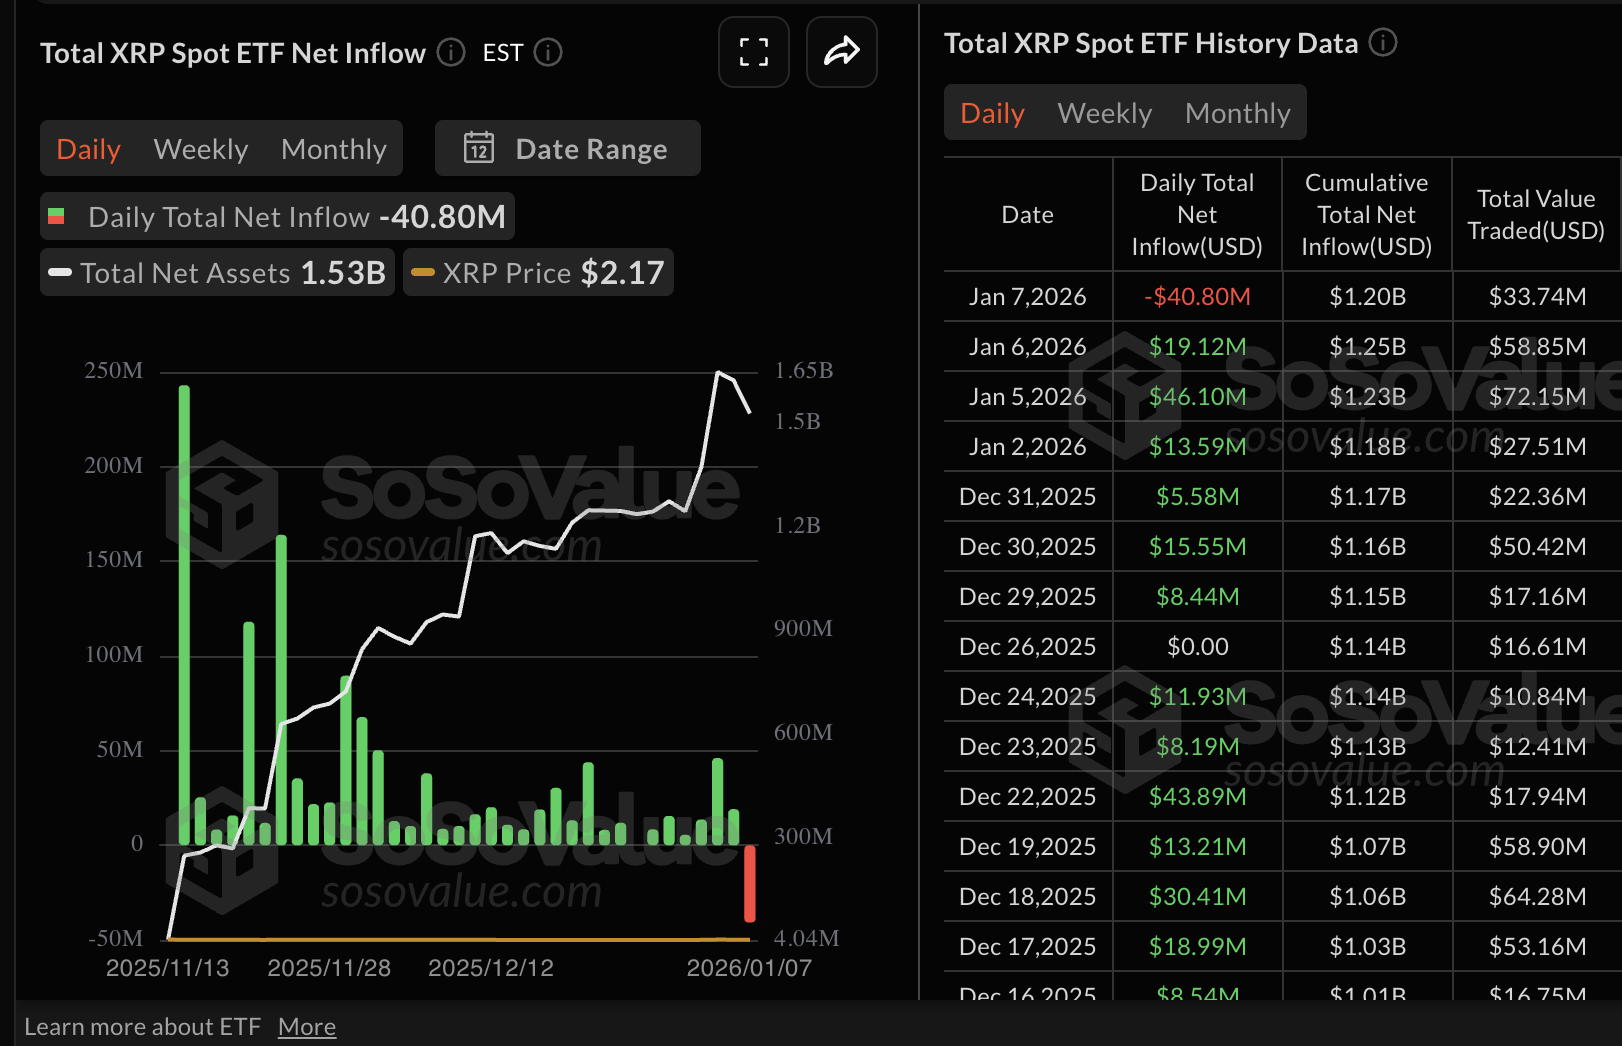
XRP spot Exchange Traded Funds (ETFs) recorded nearly $41 million in outflows on Wednesday after maintaining stellar performance since their debut in November. The cumulative inflow now stands at $1.2 billion while net assets average $1.53 billion, according to SoSoValue data.
Softening demand for ETFs can be attributed to deteriorating sentiment, which often hinders price increases, as investors prioritise risk aversion. The next few days could provide insight into the overall trend, especially given XRP’s technical structure's weakness.
The derivatives market has also mirrored the risk-off sentiment that has been thawing in the broader cryptocurrency market. CoinGlass data shows that futures Open Interest (OI) has fallen sharply to $4.26 billion on Thursday from $5.51 billion the previous day and $4.55 billion on Tuesday.
A declining OI indicates that retail is losing confidence in XRP, which leaves prices at risk of rising selling pressure.
Technical outlook: XRP testing critical support
XRP holds above the rising 50-day Exponential Moving Average (EMA) at $2.07, but remains capped below the 100-day EMA at $2.22 and the 200-day EMA at $2.34. The Relative Strength Index (RSI) has declined to 54 from overbought territory on the daily chart, suggesting easing bullish momentum.
The Moving Average Convergence Divergence (MACD) on the same chart stands above the signal line and the zero line, yet the positive histogram is contracting, which aligns with the broader corrective trend in the crypto market.
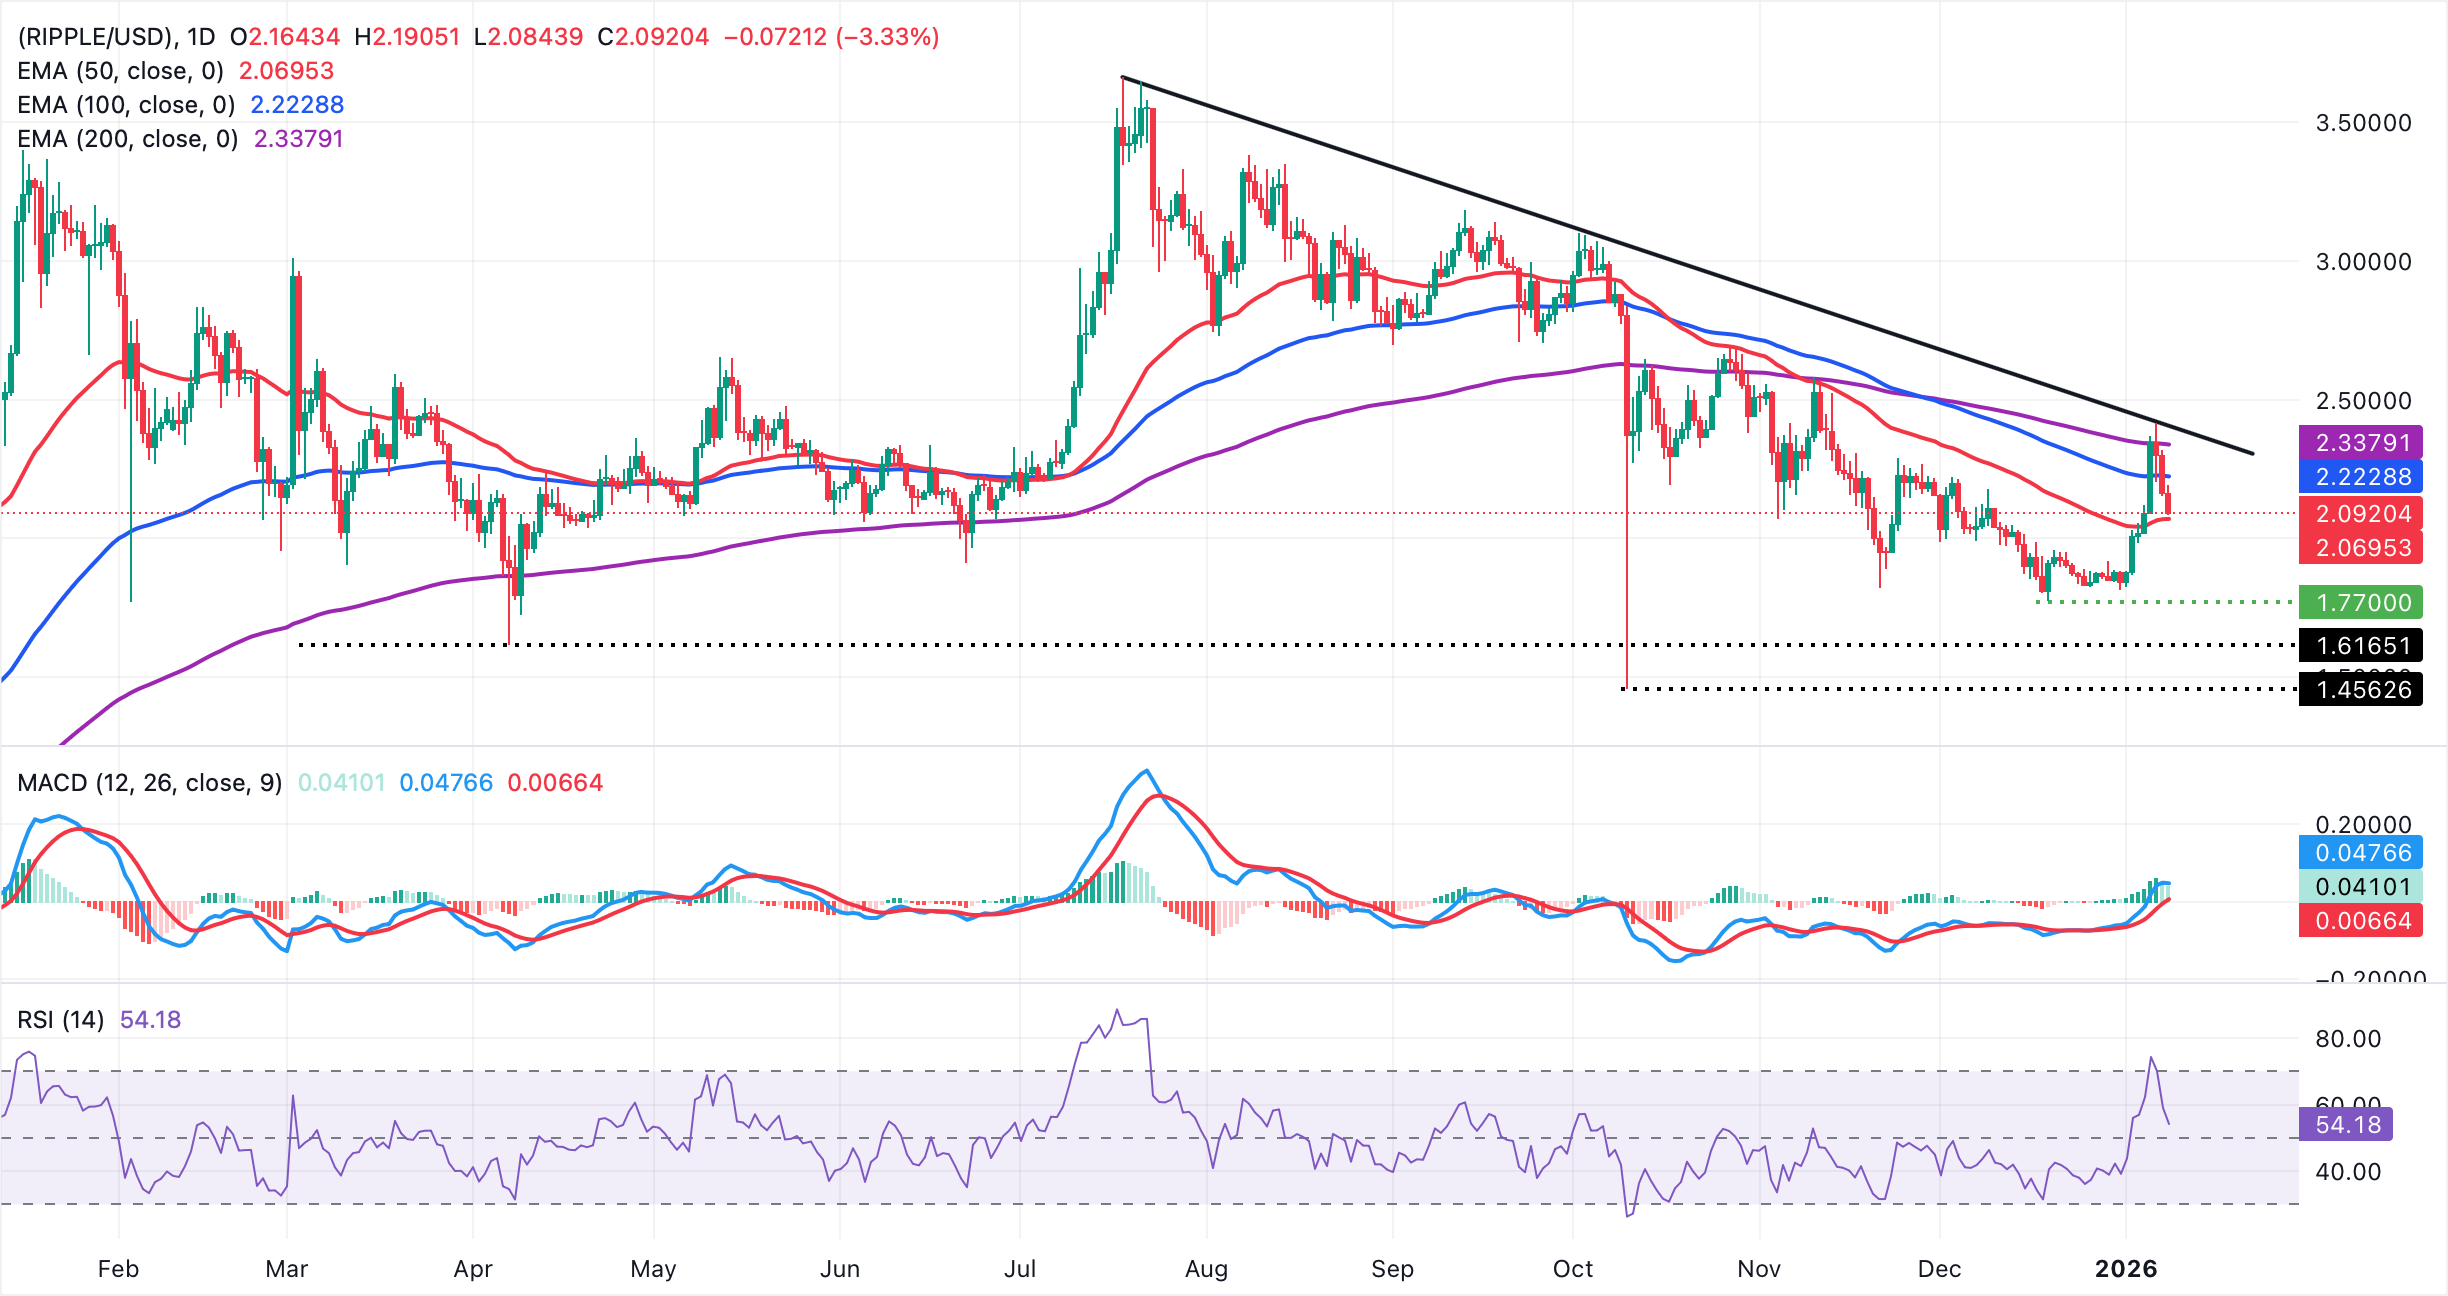
Looking up, a daily close above $2.22 (100-day EMA) would open the path toward $2.33 (200-day EMA), while a break through the descending trend line near $2.40 would strengthen the medium-term bullish case.
On the downside, initial support sits at the 50-day EMA at $2.07. A break below this level would put the recovery at risk. Overall, XRP remains in a choppy range amid a weakening technical structure that could pave the way for losses toward the November trough at $1.77 and April's low of $1.62.
Open Interest, funding rate FAQs
Higher Open Interest is associated with higher liquidity and new capital inflow to the market. This is considered the equivalent of increase in efficiency and the ongoing trend continues. When Open Interest decreases, it is considered a sign of liquidation in the market, investors are leaving and the overall demand for an asset is on a decline, fueling a bearish sentiment among investors.
Funding fees bridge the difference between spot prices and prices of futures contracts of an asset by increasing liquidation risks faced by traders. A consistently high and positive funding rate implies there is a bullish sentiment among market participants and there is an expectation of a price hike. A consistently negative funding rate for an asset implies a bearish sentiment, indicating that traders expect the cryptocurrency’s price to fall and a bearish trend reversal is likely to occur.
(The technical analysis of this story was written with the help of an AI tool)
Nothing in this material constitutes investment advice, personal recommendation, investment research, an offer, or a solicitation to buy or sell any financial instrument. The content has been prepared without consideration of your individual investment objectives, financial situation, or needs, and should not be treated as such.
Past performance is not a reliable indicator of future performance and/or results. Forward-looking scenarios or forecasts are not a guarantee of future performance. Actual results may differ materially from those anticipated.
Mitrade makes no representation or warranty as to the accuracy or completeness of the information provided and accepts no liability for any loss arising from reliance on such information.
Recommended Articles


