CFDs are complex instruments and come with a high risk of losing money rapidly due to leverage. 74% of retail investor accounts lose money when trading CFDs with this provider. You should consider whether you understand how CFDs work and whether you can afford to take the high risk of losing your money.

Meme Coins Price Prediction: DOGE, SHIB, and PEPE bulls struggle to regain strength

Source Fxstreet
  • Dogecoin steadies above $0.1300 after seven consecutive days of losses, risking a bearish momentum shift.
  • Shiba Inu holds at the 50-day EMA after seven days of downtrend as buying pressure wanes.
  • Pepe risks further decline toward the 50-day EMA as the MACD indicator flashes a sell signal.

Meme coins, including Dogecoin (DOGE), Shiba Inu (SHIB), and Pepe (PEPE), remain under extreme selling pressure, recording roughly seven days of downtrend following the January 4 spike. The meme coins risk a bearish shift in momentum as buying pressure subsides, potentially leading to further declines, as the broader cryptocurrency market lacks a near-term bullish catalyst. 

Dogecoin stabilizes after steady decline

Dogecoin trades around $0.1350 at press time on Tuesday after seven straight days of decline, breaking below the 50-day Exponential Moving Average (EMA) at $0.1427. The meme coin hovers close to the November 21 low at $0.1332, which served as key resistance in mid-December and is now a support level.

A bounce back from this level could test the 50-day EMA at $0.1427, followed by the November 26 high at $0.1568, which capped gains on January 6. 

The momentum indicators on the daily chart reflect a sudden decline in buying pressure. The Relative Strength Index (RSI) is at 48, crossing below the halfway line and suggesting the start of a sell-side dominance. At the same time, the Moving Average Convergence Divergence (MACD) reverses toward the signal line, risking a potential crossover, which would confirm a renewed bearish momentum.

DOGE/USDT daily price chart.

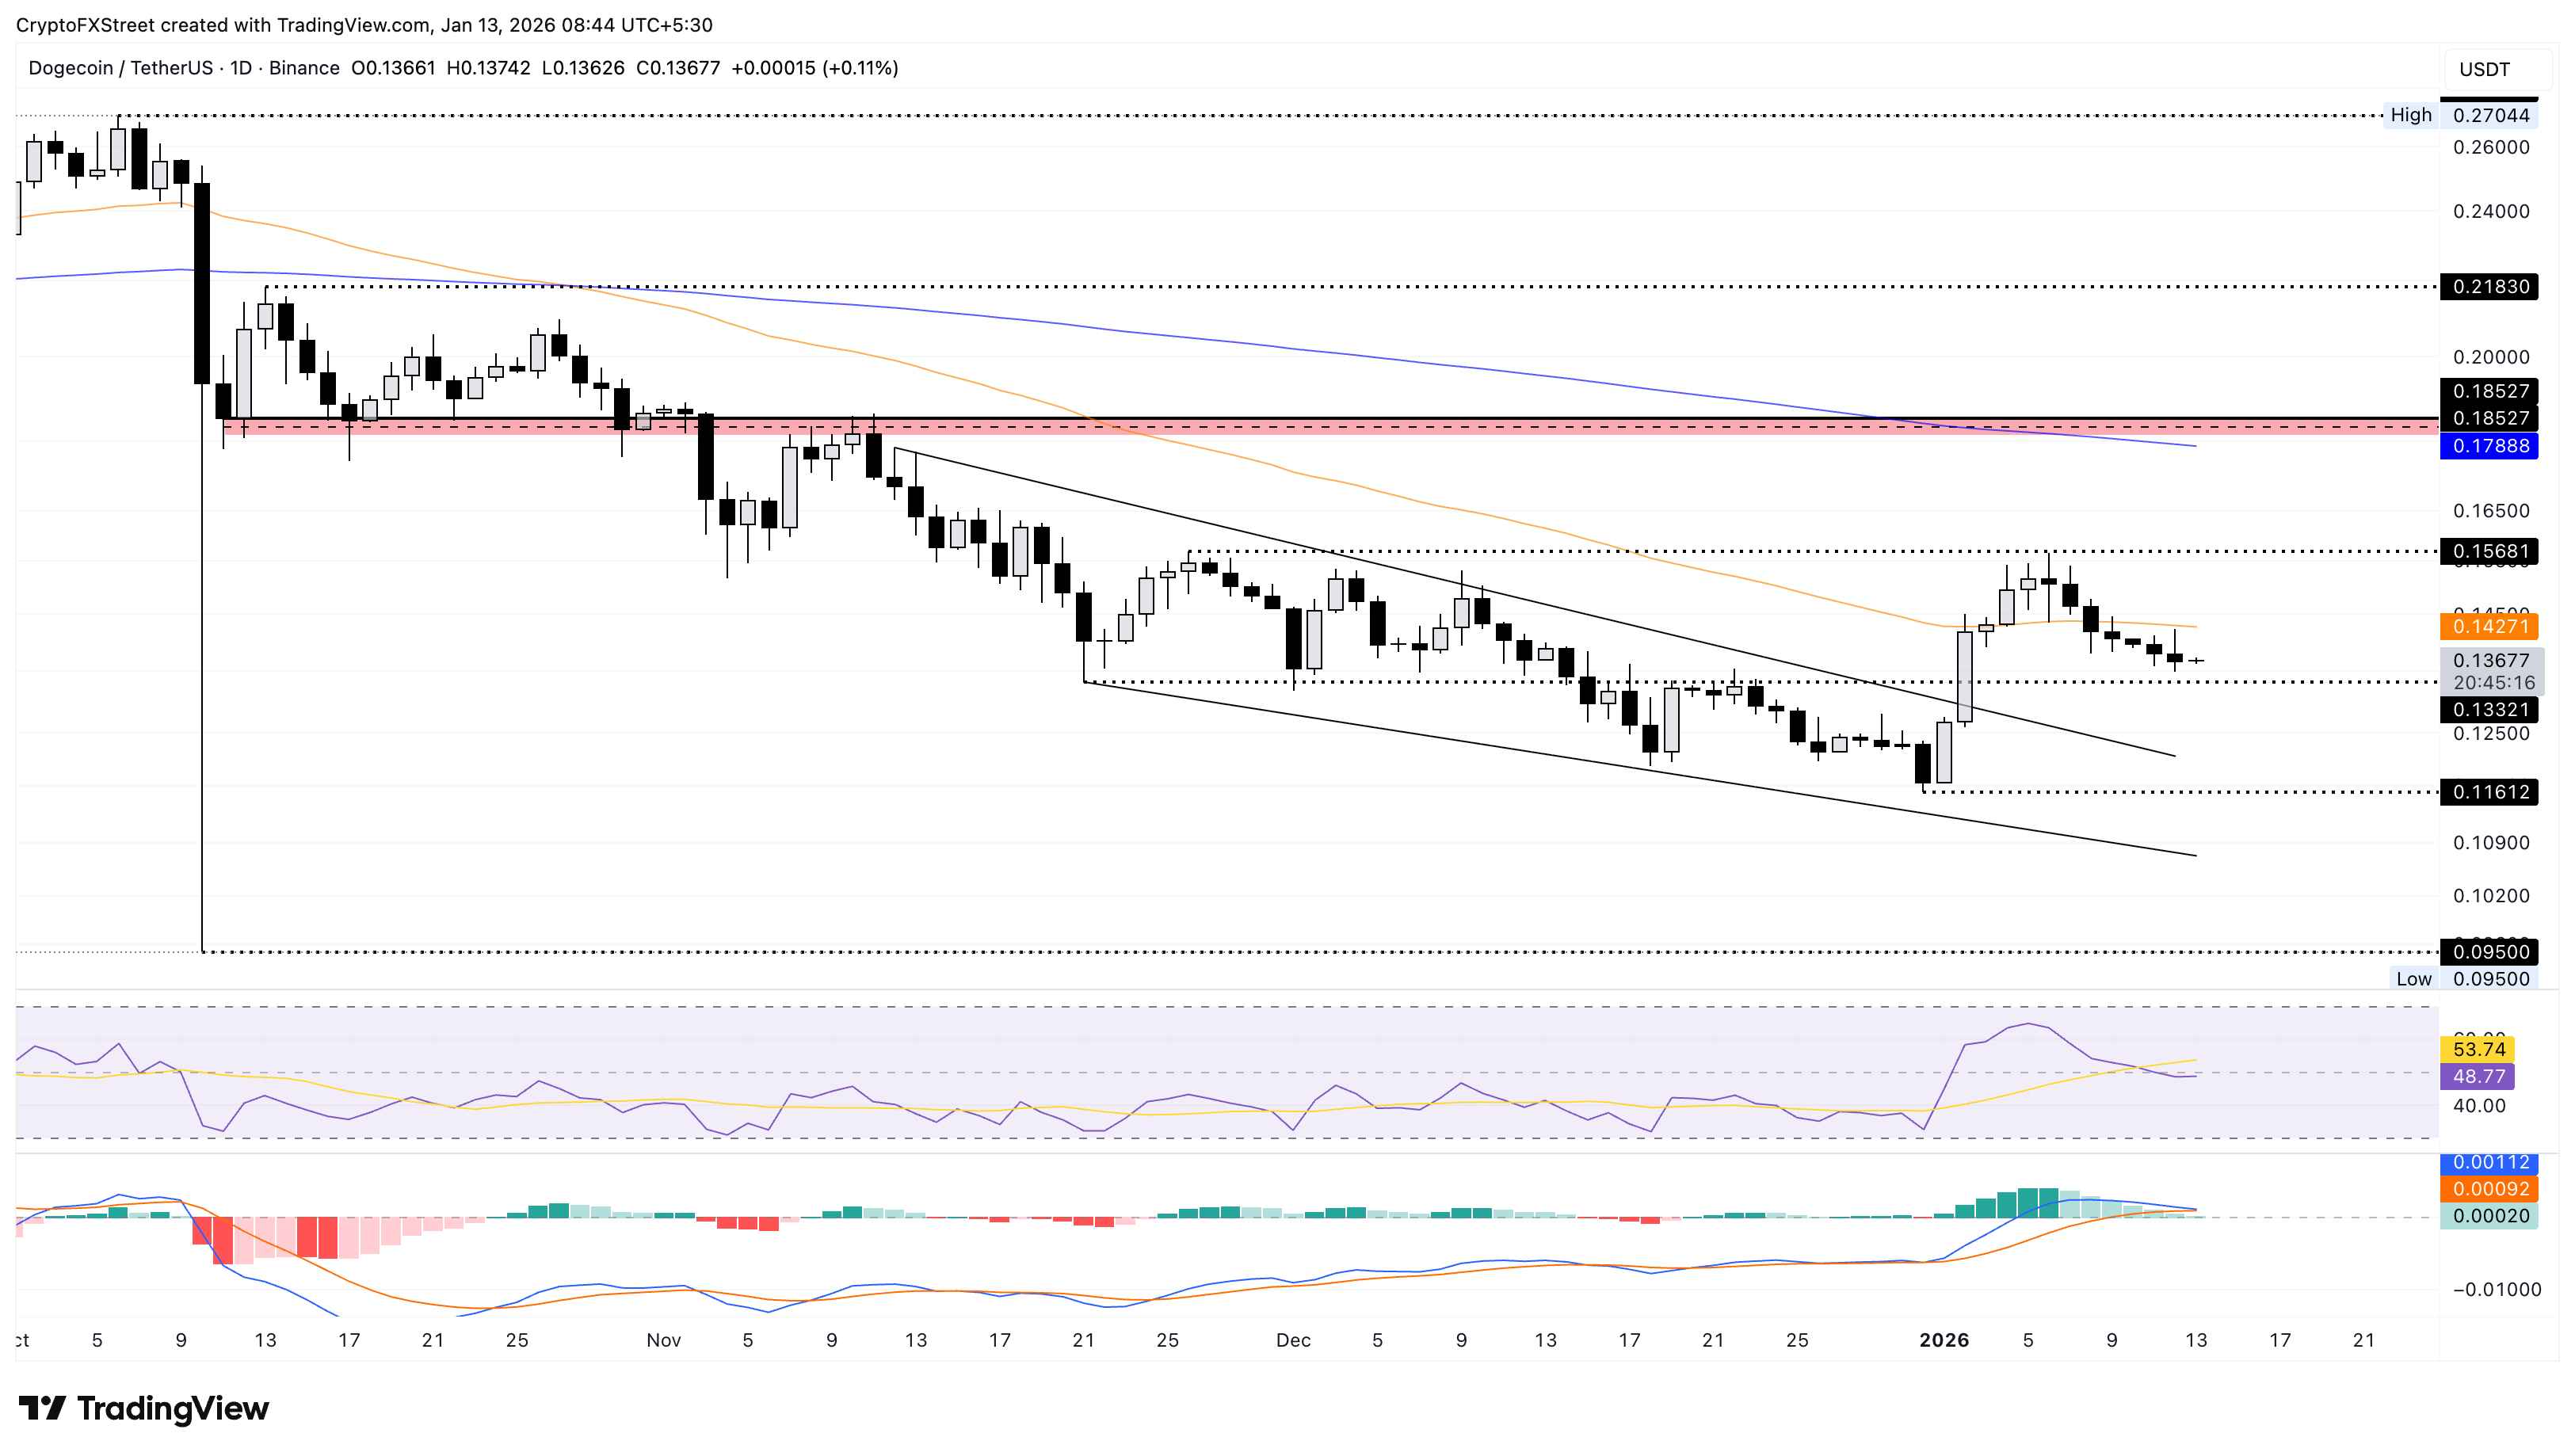
If DOGE slips below $0.1332, it could extend the decline to the December 31 low at $0.1161. 

Shiba Inu holds at a crucial moving average support

Shiba Inu hovers above the 50-day EMA at $0.00000834, stabilizing after the seven-day decline. At the time of writing, SHIB recovers slightly on Tuesday, after nearly retesting the breakout of a falling channel pattern.

If SHIB bounces back from this moving average, it could target the October 11 low at $0.0000956.

Similar to Dogecoin, Shiba Inu risks a bearish shift in trend momentum. The RSI is at 53 on the daily chart, approaching the halfway line from the overbought boundary, which suggests waning buying pressure. Additionally, the decline in MACD risks crossing below the signal line, which would trigger a sell indication.

SHIB/USDT daily price chart.

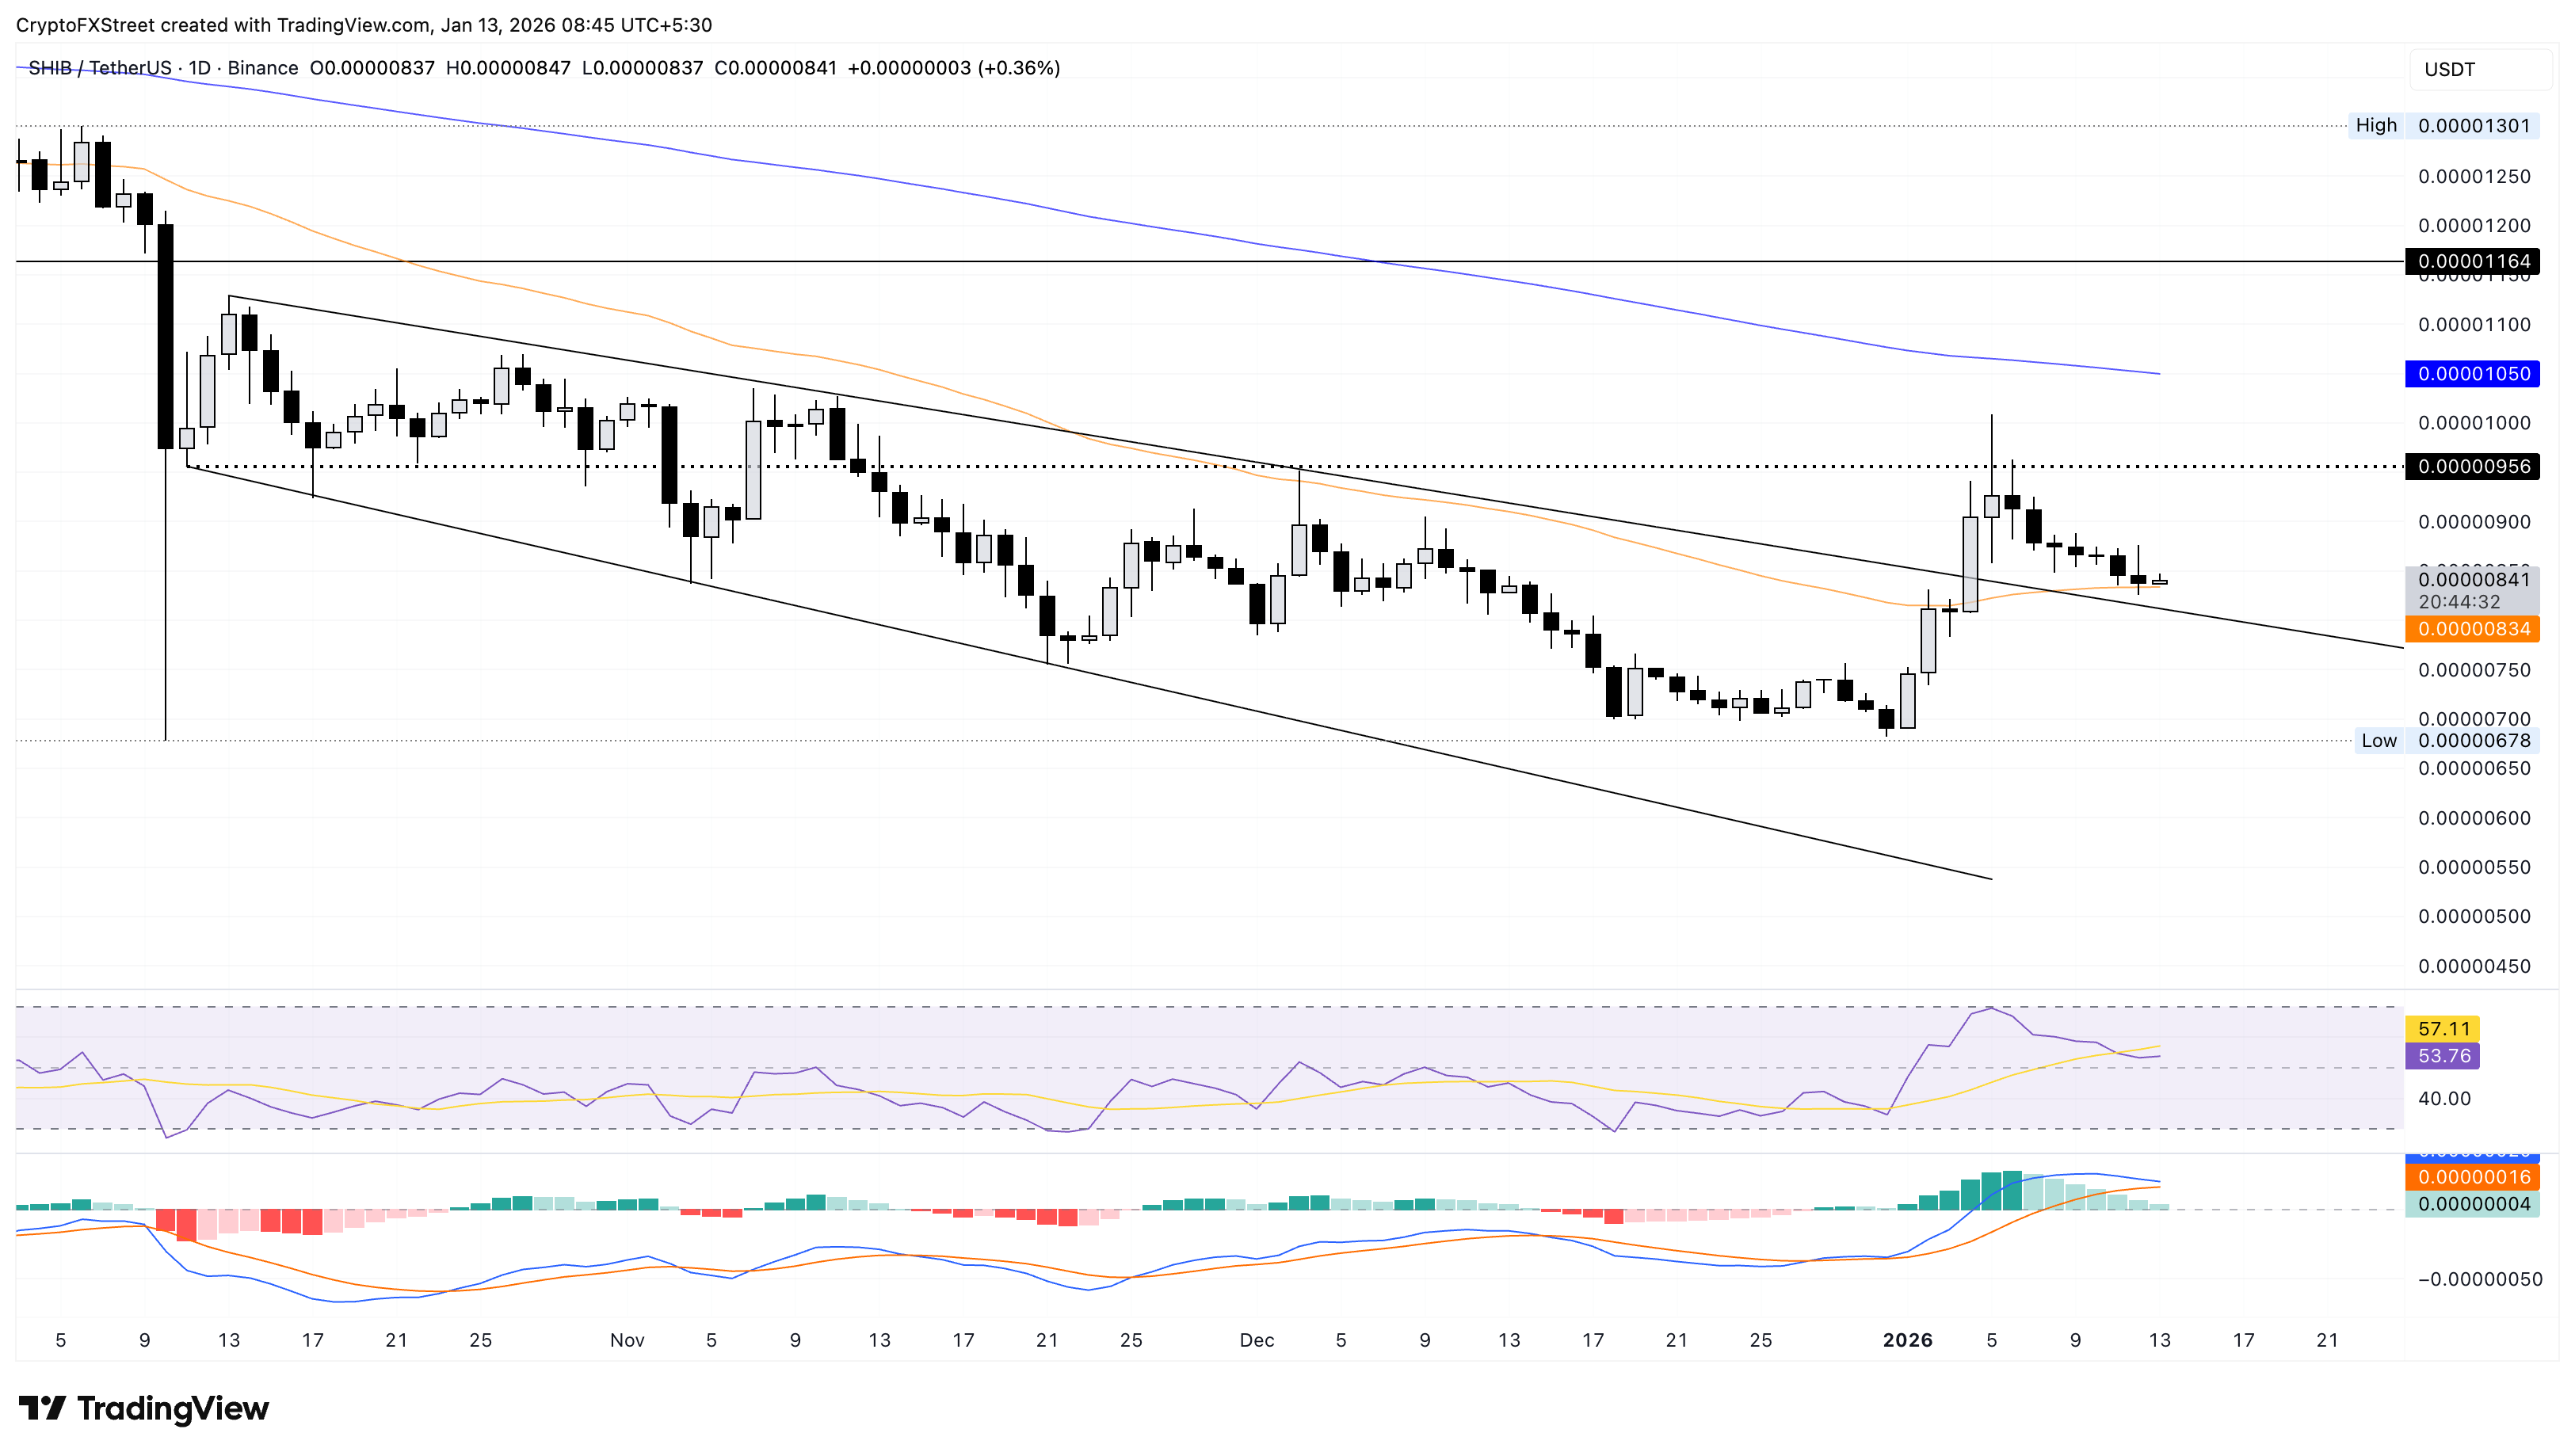
However, a sustained decline below the 50-day EMA at $0.00000834 could approach the October 10 low at $0.00000678.

Pepe targets further decline to the 50-day EMA

Pepe trades above the $0.00000500 psychological level at press time on Tuesday, after erasing the January 3 and 4 gains in a seven-day downtrend. The MACD crosses below the signal line, flashing a sell indication and renewed bearish momentum.

Additionally, the RSI at 55 indicates a steep decline from the overbought zone, suggesting a fading bullish pressure. 

The frog-themed meme coin targets the 50-day EMA at $0.00000528 as its next support level. 

PEPE/USDT daily price chart.

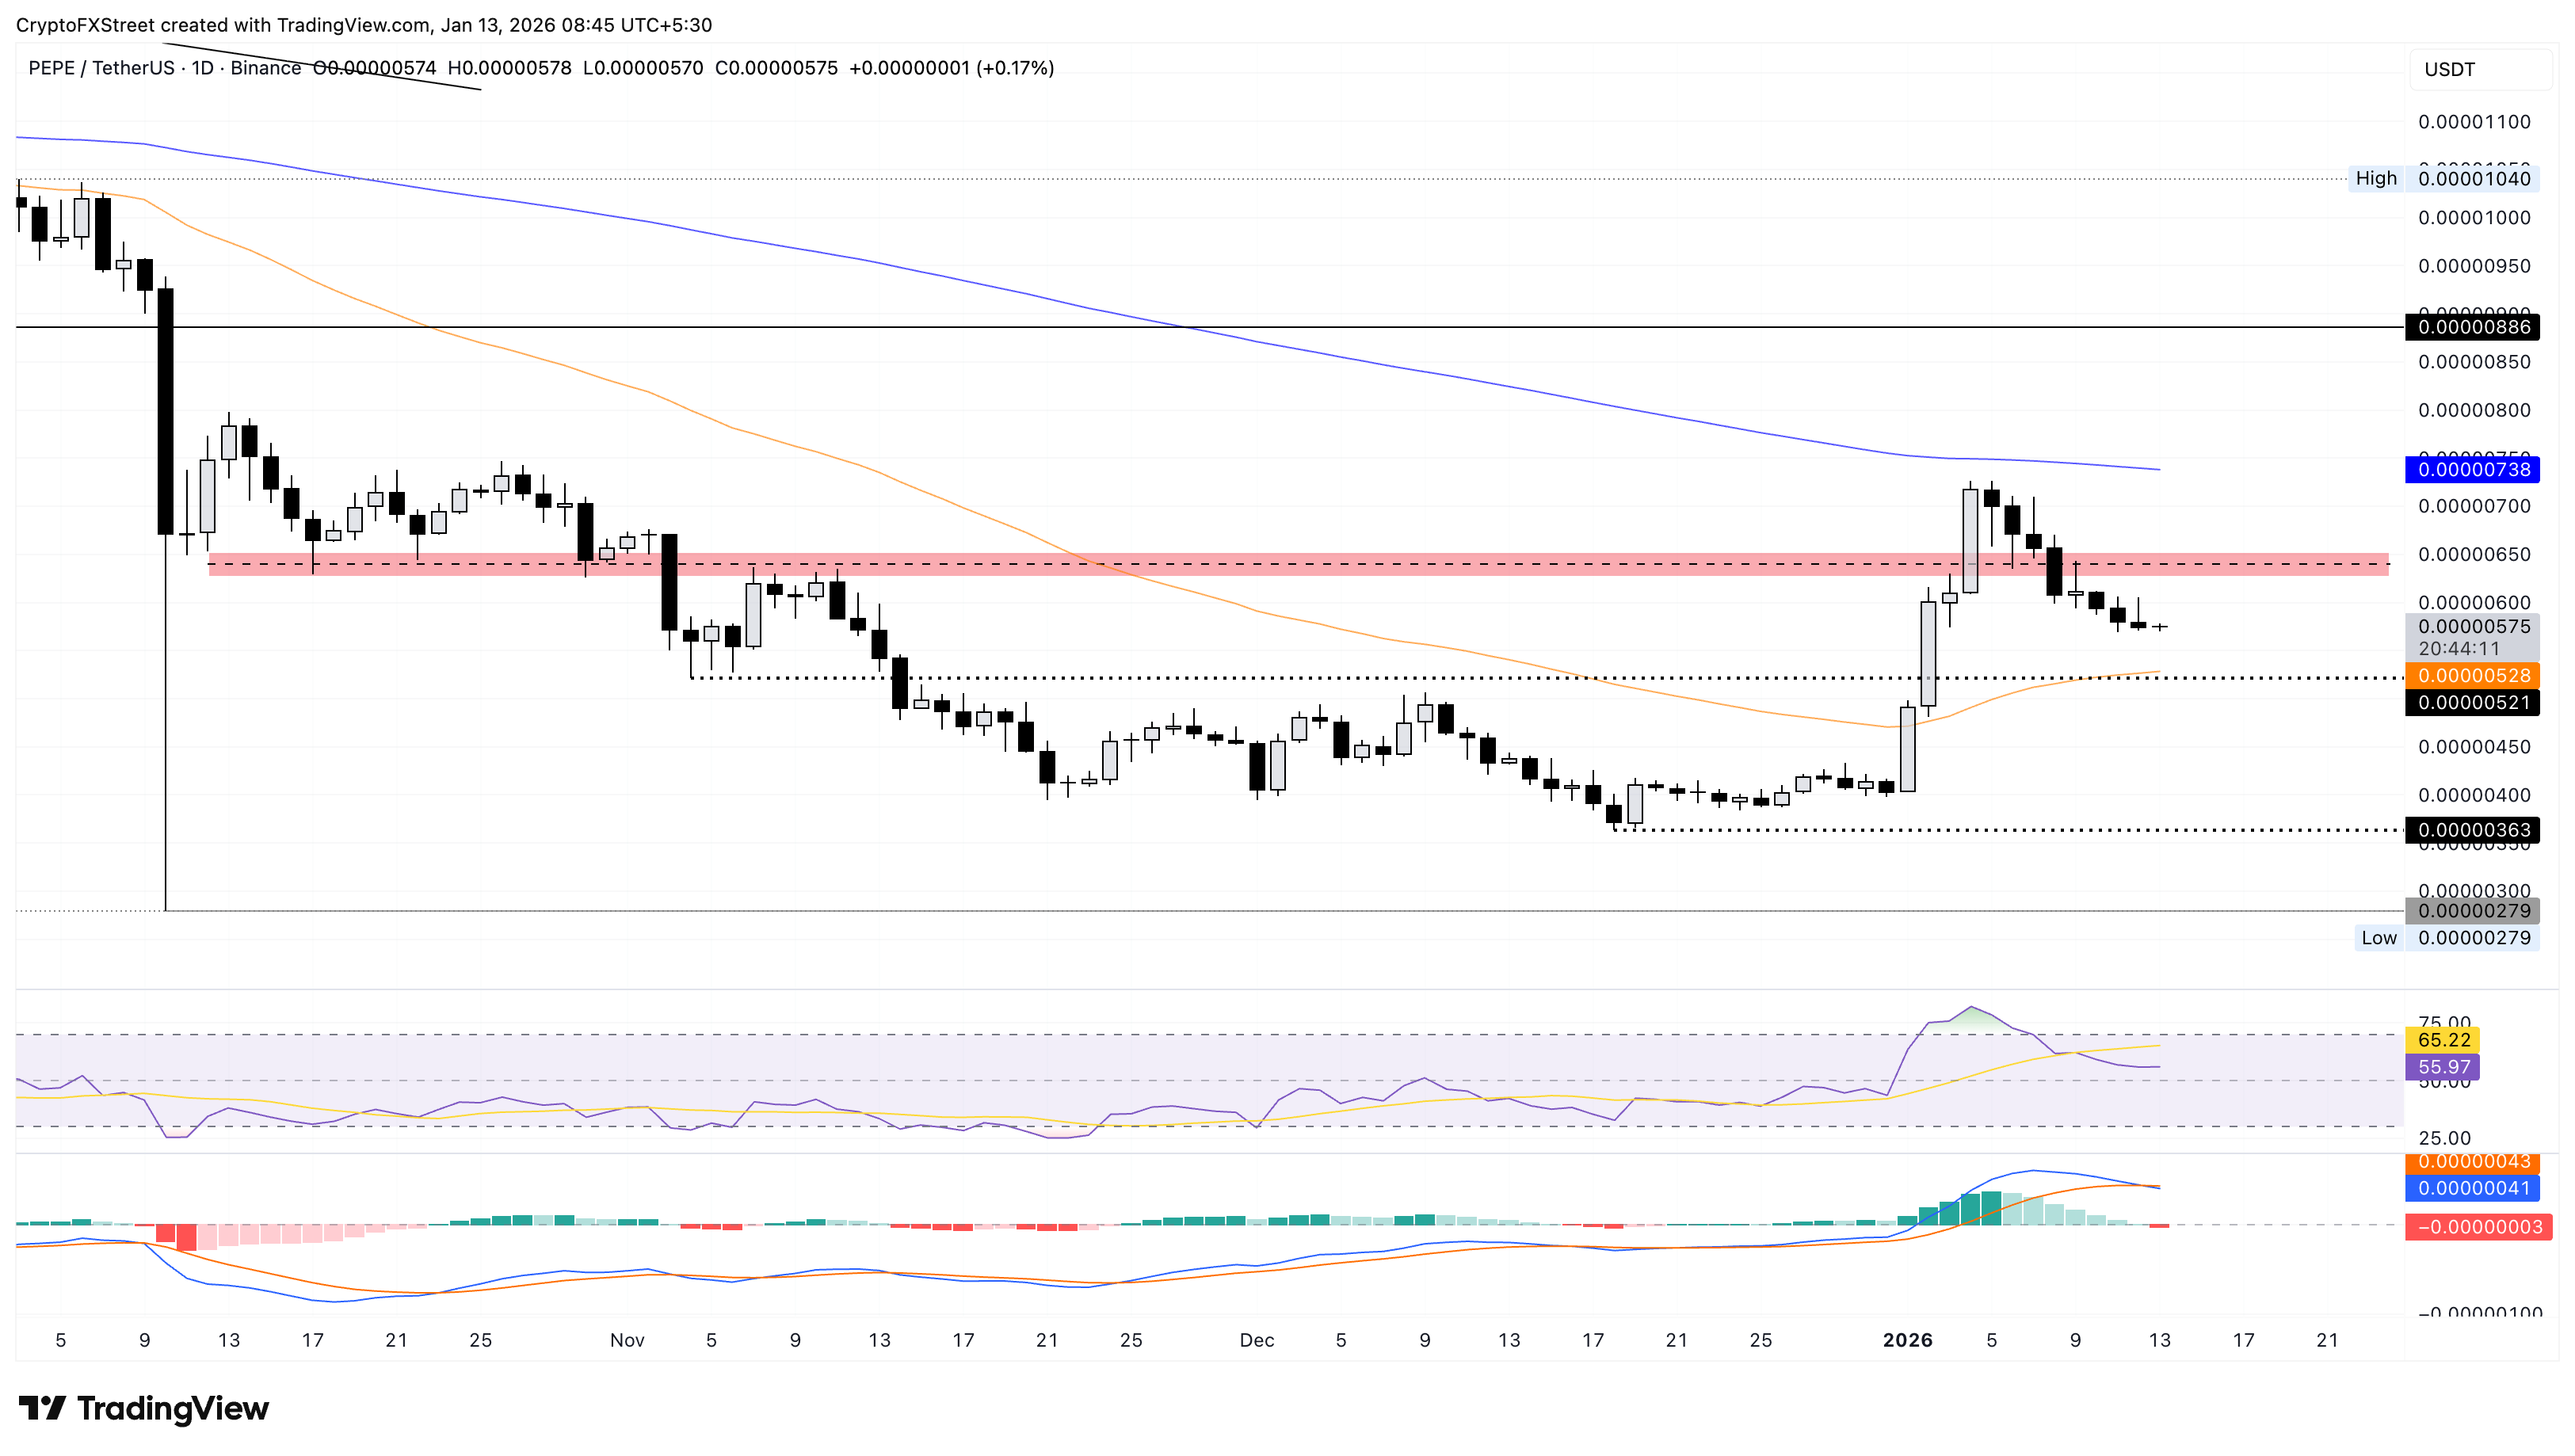
On the flip side, a potential reversal in PEPE if DOGE and SHIB rebound could test the $0.00000650 supply zone, followed by the 200-day EMA at $0.00000738.

Disclaimer: The content available on Mitrade Insights is provided for informational and marketing purposes only. It has not been prepared in accordance with legal requirements designed to promote the independence of investment research and is not subject to any prohibition on dealing ahead of the dissemination of investment research
Nothing in this material constitutes investment advice, personal recommendation, investment research, an offer, or a solicitation to buy or sell any financial instrument. The content has been prepared without consideration of your individual investment objectives, financial situation, or needs, and should not be treated as such.
Past performance is not a reliable indicator of future performance and/or results. Forward-looking scenarios or forecasts are not a guarantee of future performance. Actual results may differ materially from those anticipated.
Mitrade makes no representation or warranty as to the accuracy or completeness of the information provided and accepts no liability for any loss arising from reliance on such information.
placeholder
WTI hovers below $59.00 as US-Iran tensions ease, weekly loss loomsWest Texas Intermediate (WTI) Oil price moves little after two days of more than 3% losses, trading around $58.80 during the Asian hours on Friday. WTI price faces challenges as geopolitical risk premiums faded following easing fears of a possible US military strike on Iran.
Author  FXStreet
16 hours ago
West Texas Intermediate (WTI) Oil price moves little after two days of more than 3% losses, trading around $58.80 during the Asian hours on Friday. WTI price faces challenges as geopolitical risk premiums faded following easing fears of a possible US military strike on Iran.
placeholder
Cardano Price Forecast: Rejection at 50-day EMA tightens bearish gripCardano (ADA) edges lower by over 3% at press time on Thursday, extending the second rejection from the 50-day Exponential Moving Average (EMA) so far this month. A bearish side in the retail interest leads to a decline in Open Interest and lowered funding rates.
Author  FXStreet
Yesterday 07: 55
Cardano (ADA) edges lower by over 3% at press time on Thursday, extending the second rejection from the 50-day Exponential Moving Average (EMA) so far this month. A bearish side in the retail interest leads to a decline in Open Interest and lowered funding rates.
placeholder
Hedera Price Forecast: HBAR extends gains as ETF inflows boost sentiment Hedera (HBAR) is trading at around $0.127 on Wednesday, approaching a key resistance level; a breakout above this level would signal further gains. Institutional demand continues to strengthen this week, with spot HBAR Exchange-Traded Funds (ETFs) recording three consecutive days of inflows.
Author  FXStreet
Jan 14, Wed
Hedera (HBAR) is trading at around $0.127 on Wednesday, approaching a key resistance level; a breakout above this level would signal further gains. Institutional demand continues to strengthen this week, with spot HBAR Exchange-Traded Funds (ETFs) recording three consecutive days of inflows.
placeholder
WTI declines below $61.00 as US stockpile builds, Venezuelan exports resumeWest Texas Intermediate (WTI), the US crude oil benchmark, is trading around $60.70 during the Asian trading hours on Wednesday. The WTI price declines as Venezuela resumes exports and the American Petroleum Institute (API) shows a big build in US crude inventories.
Author  FXStreet
Jan 14, Wed
West Texas Intermediate (WTI), the US crude oil benchmark, is trading around $60.70 during the Asian trading hours on Wednesday. The WTI price declines as Venezuela resumes exports and the American Petroleum Institute (API) shows a big build in US crude inventories.
placeholder
BNB Price Forecast: On the verge of breakout as derivatives traders bet on gainsBNB (BNB), formerly known as Binance Coin, is trading above $910 at the time of writing on Tuesday, nearing the upper consolidation boundary. The two months of sideways price action could end, with improving sentiment in the derivatives market suggesting potential upside.
Author  FXStreet
Jan 13, Tue
BNB (BNB), formerly known as Binance Coin, is trading above $910 at the time of writing on Tuesday, nearing the upper consolidation boundary. The two months of sideways price action could end, with improving sentiment in the derivatives market suggesting potential upside.
Related Instrument
goTop
quote