


Solana Price Forecast: SOL builds breakout momentum on retail interest and mild ETF inflows
- Solana breaks out of a falling wedge pattern, signaling a potential 44% increase to $200.
- SOL ETFs post mild inflows, reaching nearly $6 million on Tuesday.
- Traders pile into SOL as the derivatives market’s Open Interest grows to $8.8 billion.
Solana (SOL) is showing renewed strength, trading above $146 at the time of writing on Wednesday, as multiple catalysts converge to support a bullish outlook. SOL’s rebound follows weeks of consolidation above the $120 support level.
The continuation of the trend will depend on sentiment in the broader cryptocurrency market, which has sustained gains since the start of the week. Other factors include retail interest and institutional demand.
Mild ETF demand sparks optimism for Solana’s recovery
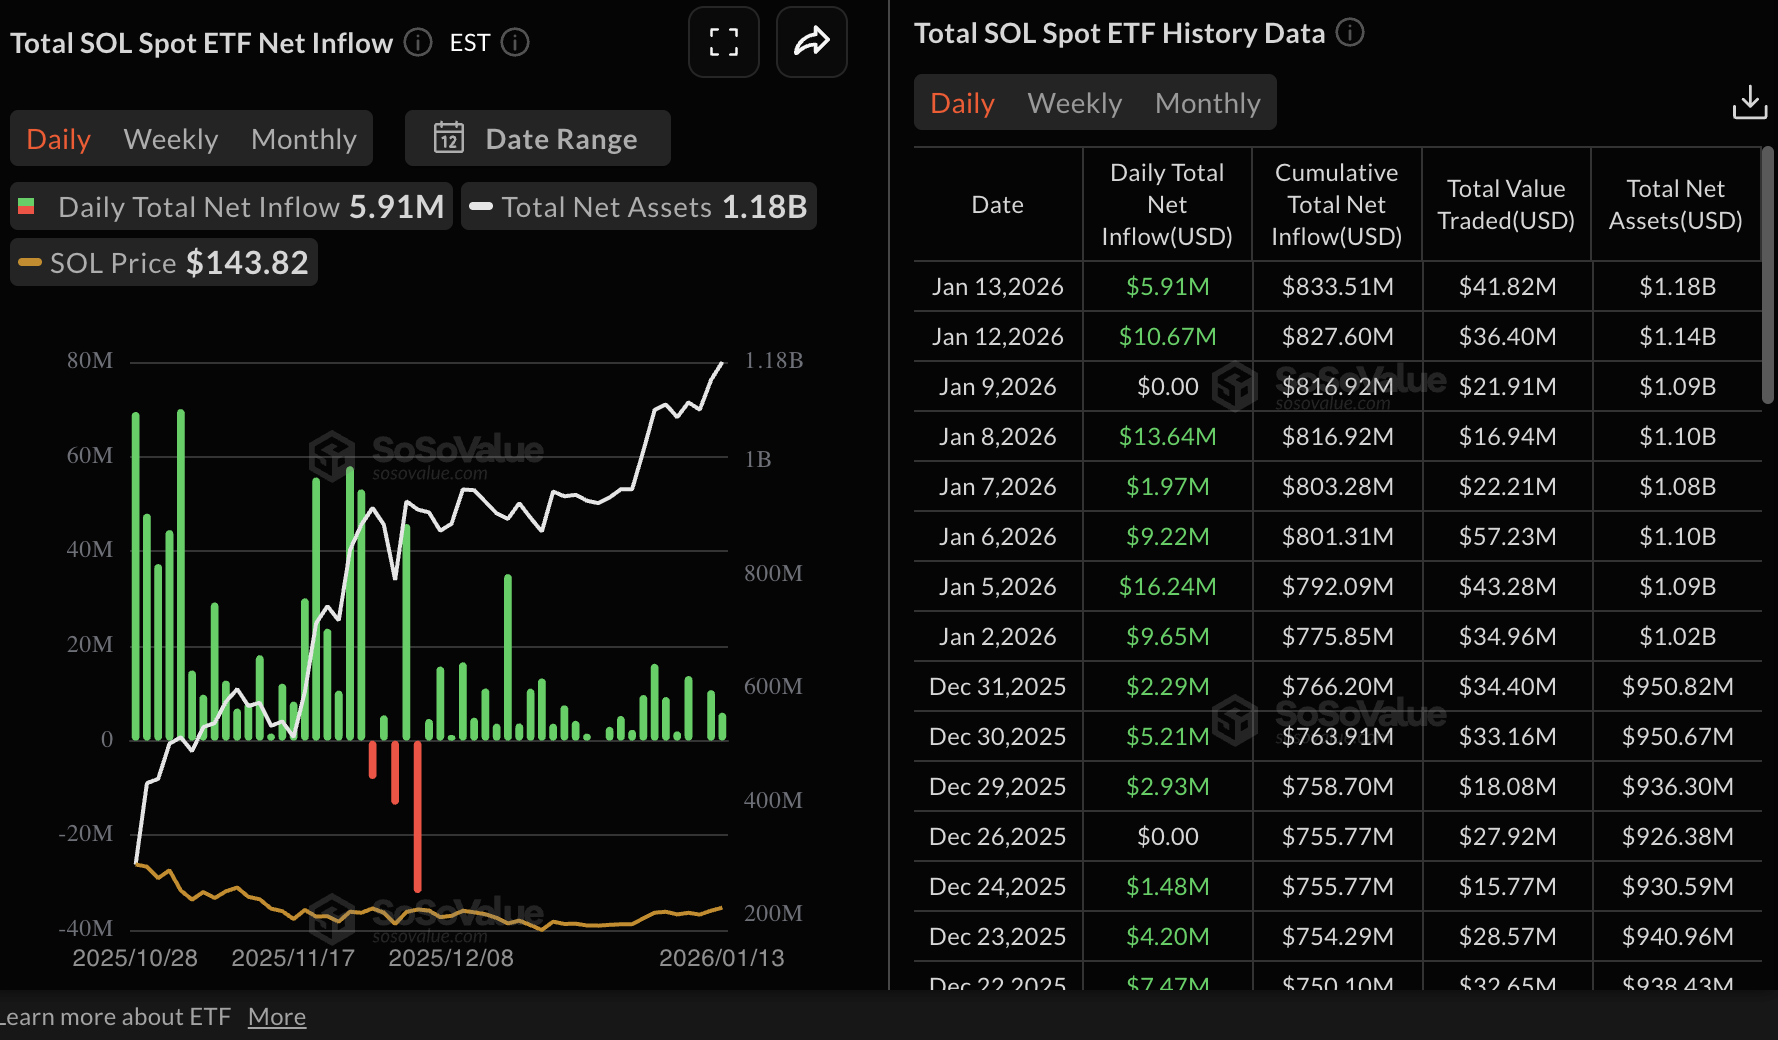
Institutional interest is materializing through Solana Exchange Traded Funds (ETFs), which recorded almost $6 million in inflows on Tuesday. Despite the mild inflow, demand for US-listed SOL spot ETFs has remained largely stable.
SoSoValue data shows cumulative inflow volume of approximately $834 million and net assets of $1.18 billion. Nascent institutional inflows suggest Solana could be poised for adoption and an extended uptrend in the short to medium-term.
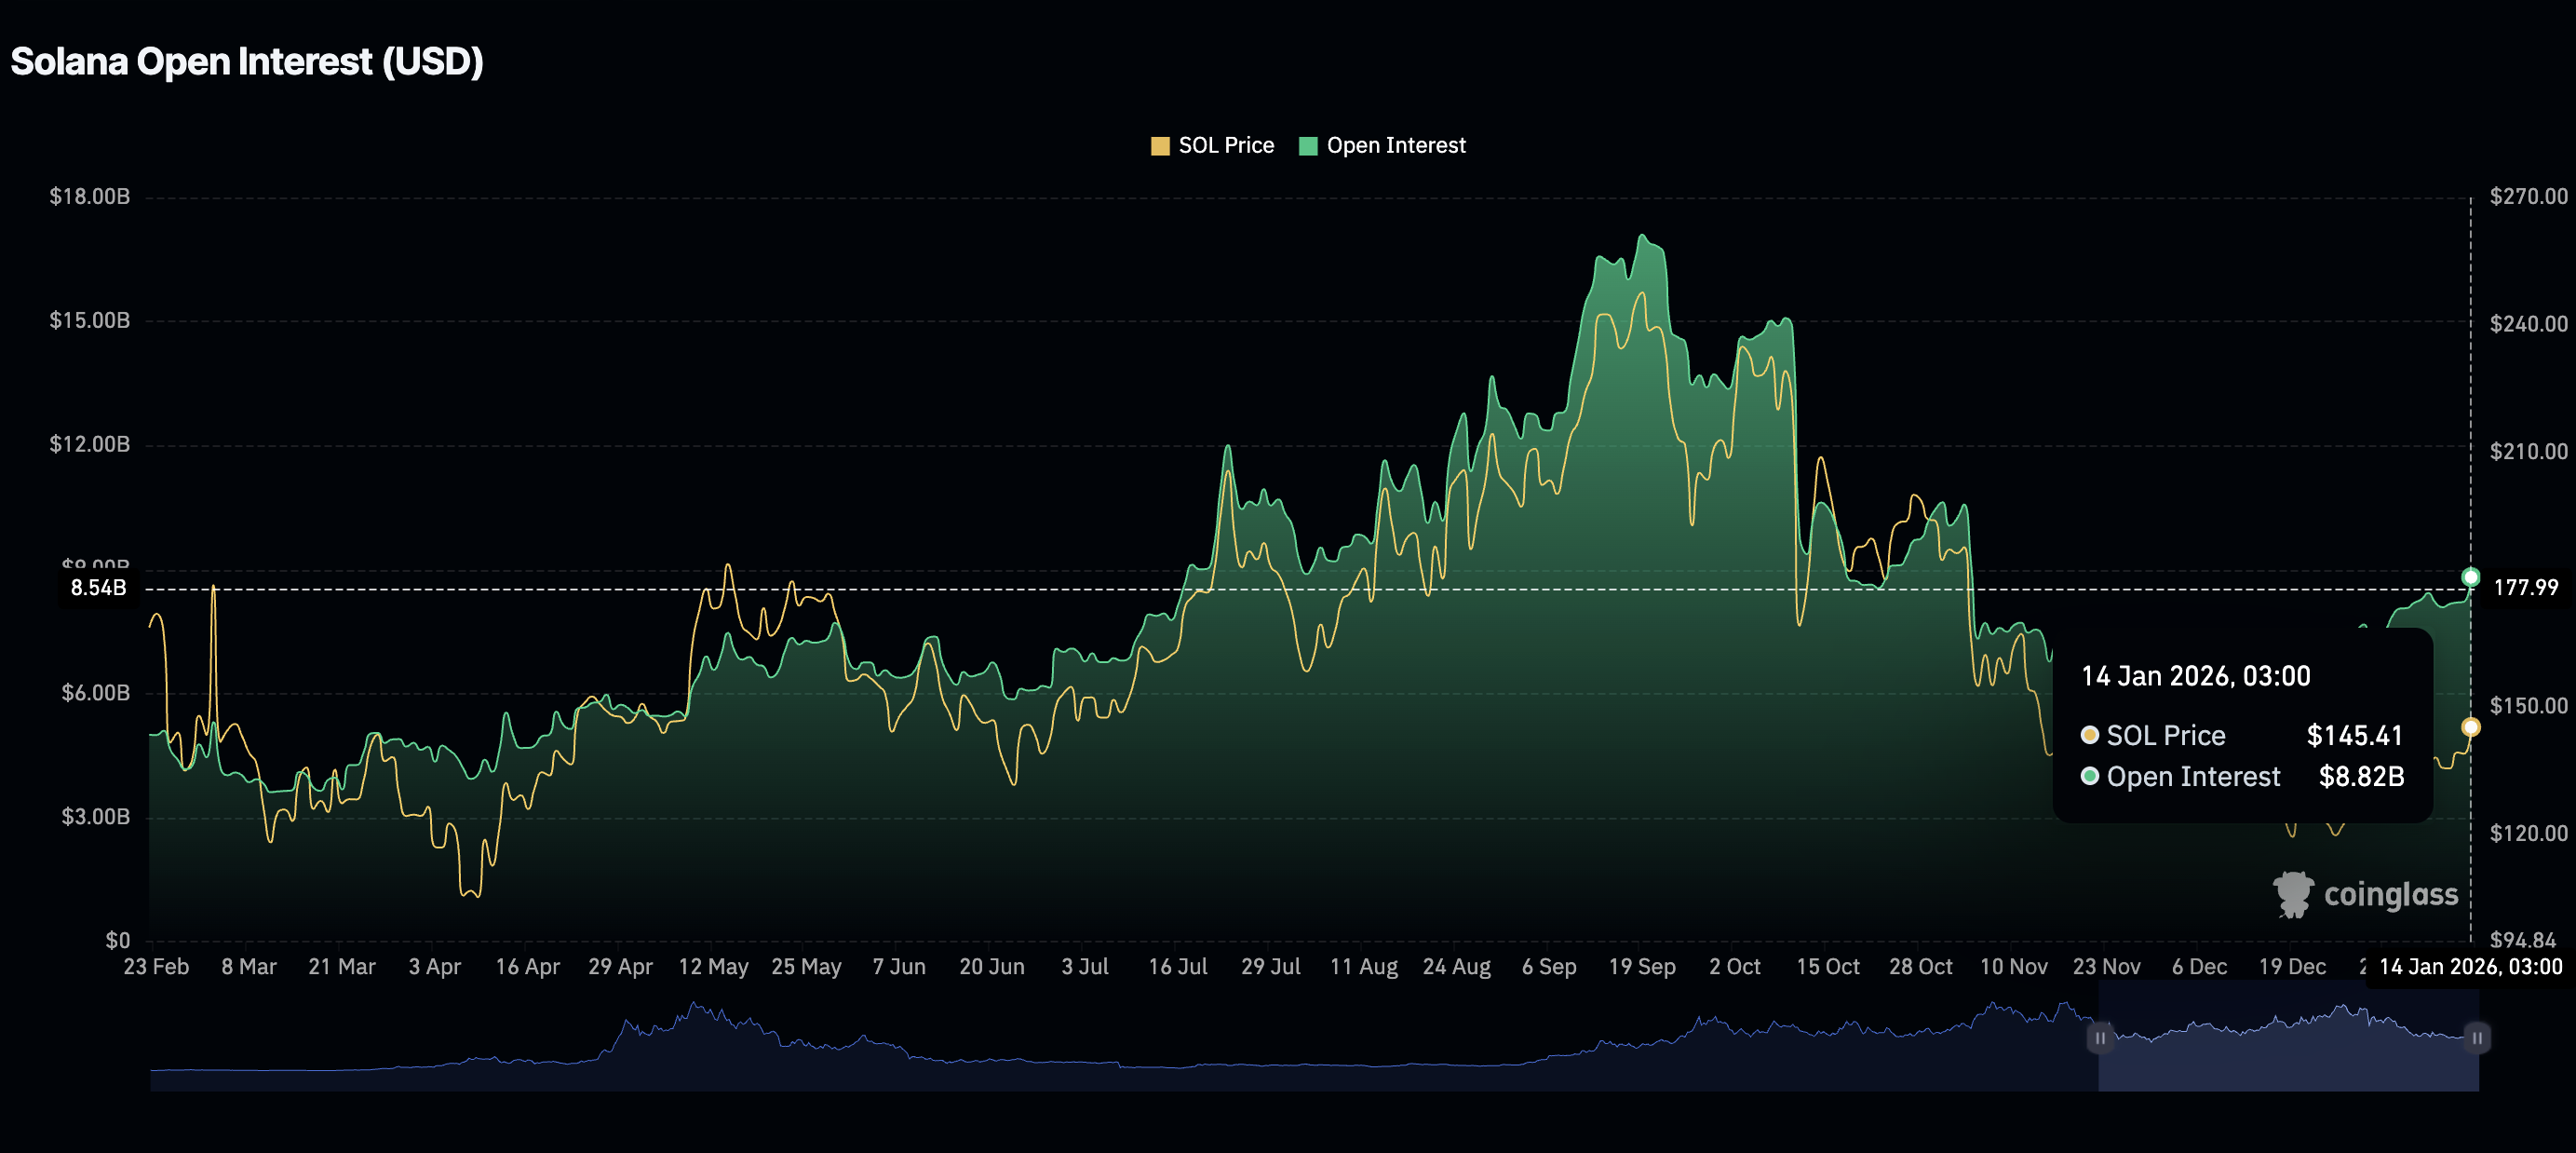
Meanwhile, the Solana derivatives market reflects investors’ optimism for a price recovery, with futures Open Interest (OI) rising to $8.8 billion on Wednesday, its highest level since early November.
The futures OI, which represents the notional value of outstanding futures contracts, stood at $7.38 billion on January 1. The surge reflects the strengthening retail demand and trader positioning ahead of a potential short-term breakout.
Technical outlook: Solana’s falling wedge pattern breakout eyes $200
Solana is trading above $146 at the time of writing on Wednesday, supported by a convergence of key technical indicators. The Relative Strength Index (RSI) has risen to 68 on the daily chart, signaling a buildup of bullish momentum.
The Moving Average Convergence Divergence (MACD) indicator holds above the signal line on the same chart, prompting investors to lean more into risk for a higher reward ratio if SOL extends the uptrend above a falling wedge pattern.
The breakout projects a potential 44% increase in value to $200, but first, Solana should close above the 100-day Exponential Moving Average (EMA) at $149 to confirm its bullish thesis.
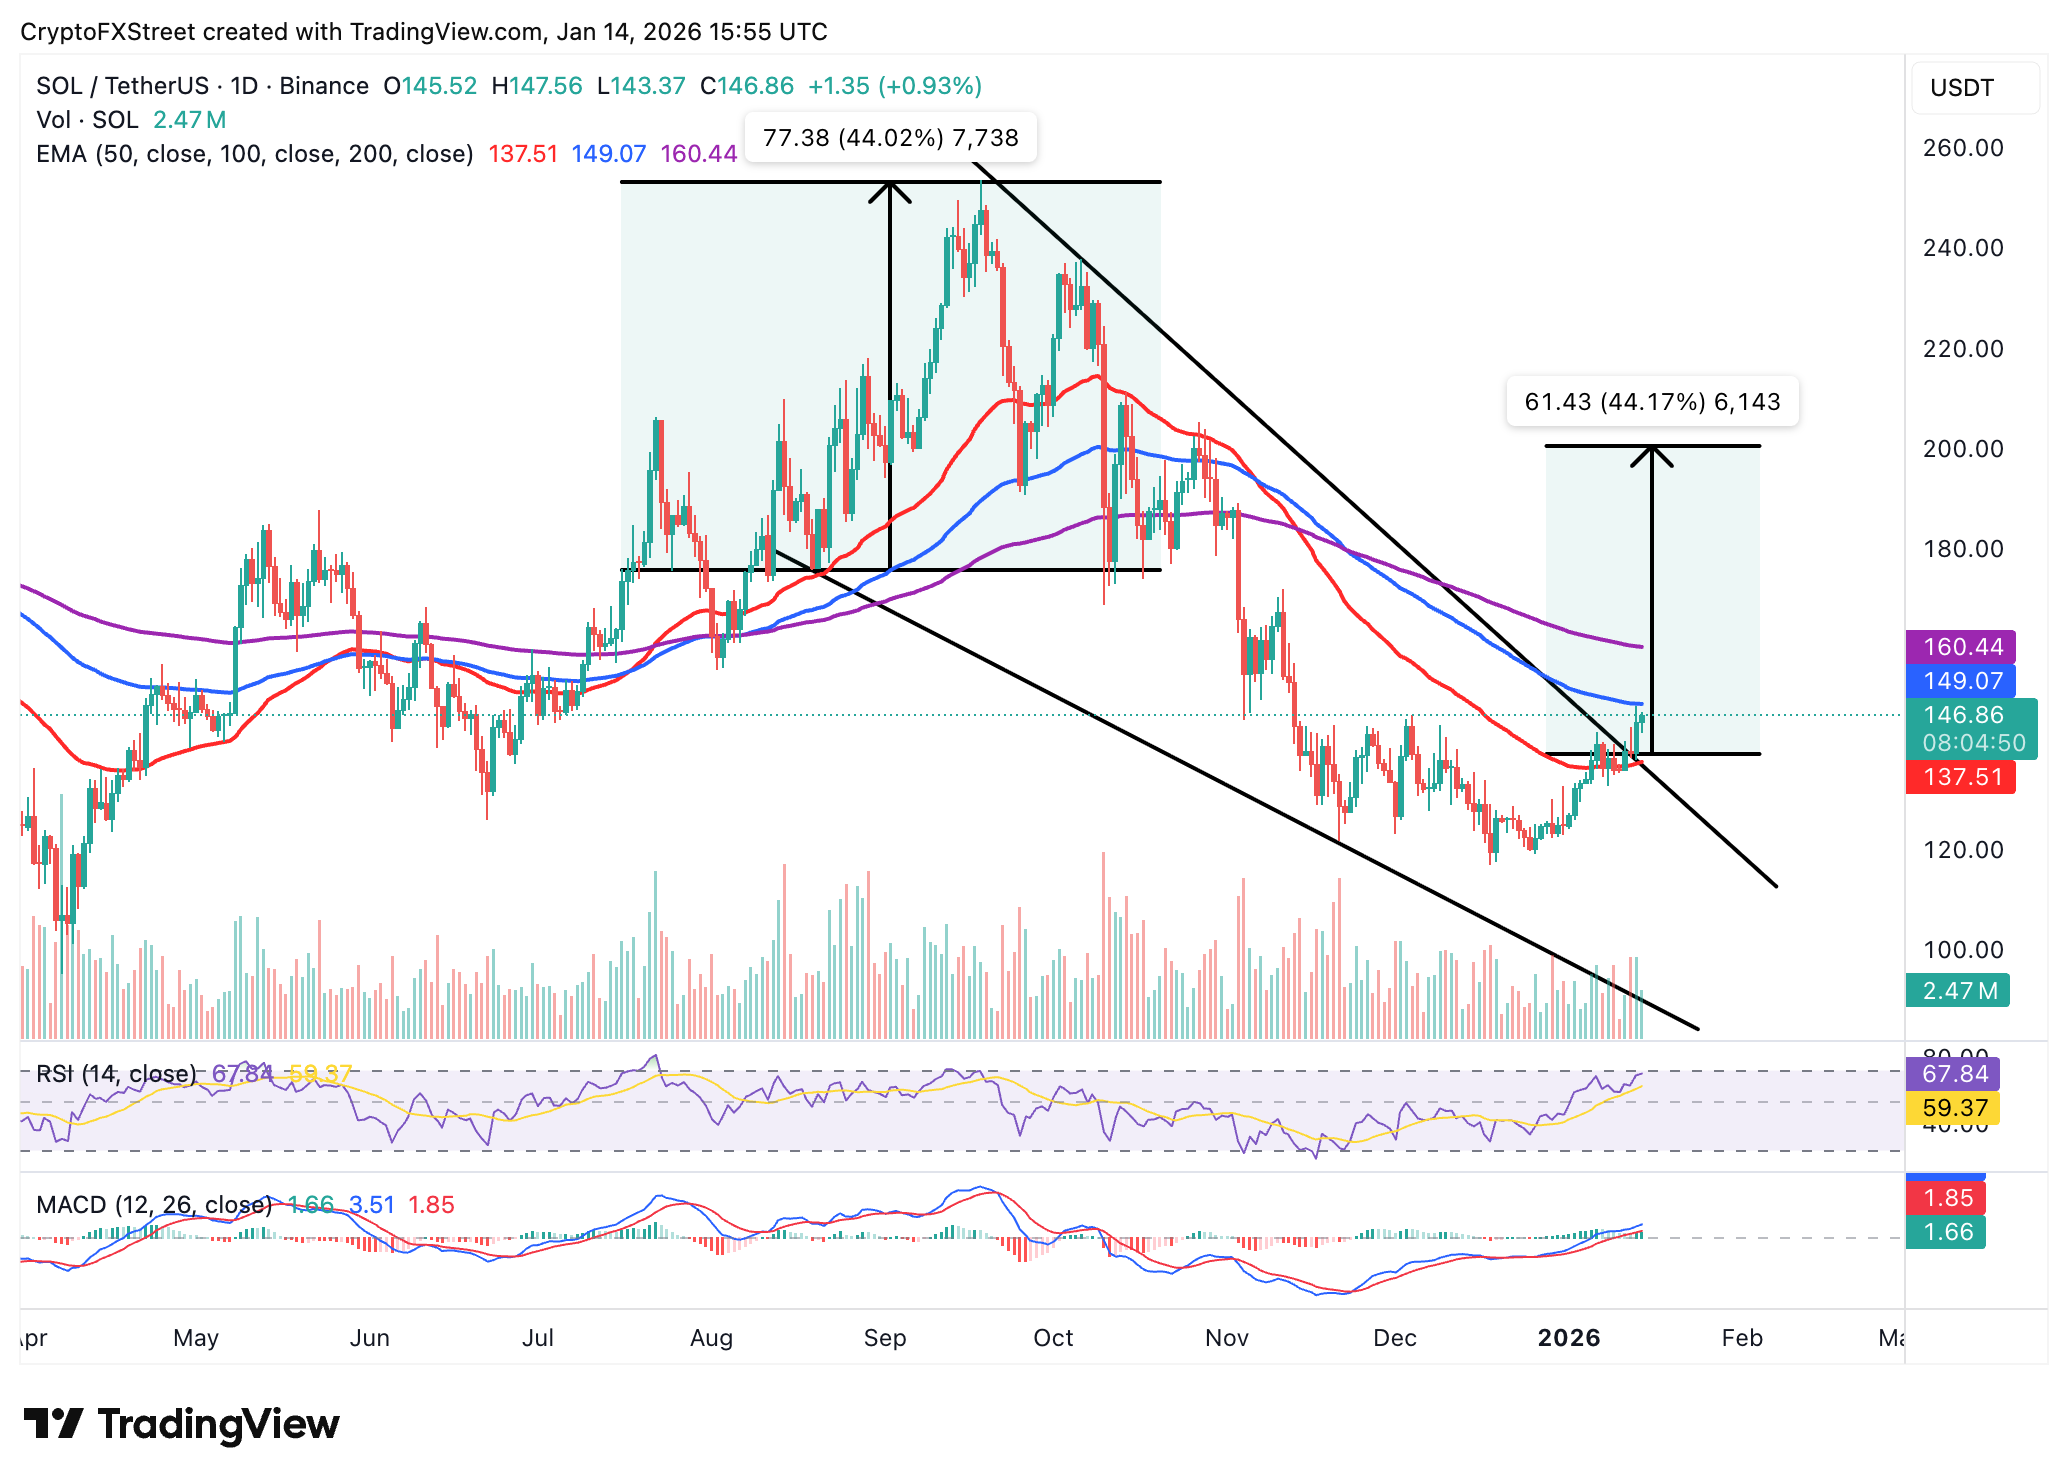
Looking ahead, more resistance is anticipated at the 200-day EMA ($160), which could introduce another supply risk amid potential profit-taking. Meanwhile, support at the 50-day EMA ($138) remains critical for Solana’s bullish outlook. If the price closes below that level, a correction could extend to the next key support at $120.
Crypto ETF FAQs
An Exchange-Traded Fund (ETF) is an investment vehicle or an index that tracks the price of an underlying asset. ETFs can not only track a single asset, but a group of assets and sectors. For example, a Bitcoin ETF tracks Bitcoin’s price. ETF is a tool used by investors to gain exposure to a certain asset.
Yes. The first Bitcoin futures ETF in the US was approved by the US Securities & Exchange Commission in October 2021. A total of seven Bitcoin futures ETFs have been approved, with more than 20 still waiting for the regulator’s permission. The SEC says that the cryptocurrency industry is new and subject to manipulation, which is why it has been delaying crypto-related futures ETFs for the last few years.
Yes. The SEC approved in January 2024 the listing and trading of several Bitcoin spot Exchange-Traded Funds, opening the door to institutional capital and mainstream investors to trade the main crypto currency. The decision was hailed by the industry as a game changer.
The main advantage of crypto ETFs is the possibility of gaining exposure to a cryptocurrency without ownership, reducing the risk and cost of holding the asset. Other pros are a lower learning curve and higher security for investors since ETFs take charge of securing the underlying asset holdings. As for the main drawbacks, the main one is that as an investor you can’t have direct ownership of the asset, or, as they say in crypto, “not your keys, not your coins.” Other disadvantages are higher costs associated with holding crypto since ETFs charge fees for active management. Finally, even though investing in ETFs reduces the risk of holding an asset, price swings in the underlying cryptocurrency are likely to be reflected in the investment vehicle too.
Nothing in this material constitutes investment advice, personal recommendation, investment research, an offer, or a solicitation to buy or sell any financial instrument. The content has been prepared without consideration of your individual investment objectives, financial situation, or needs, and should not be treated as such.
Past performance is not a reliable indicator of future performance and/or results. Forward-looking scenarios or forecasts are not a guarantee of future performance. Actual results may differ materially from those anticipated.
Mitrade makes no representation or warranty as to the accuracy or completeness of the information provided and accepts no liability for any loss arising from reliance on such information.
Recommended Articles


