CFDs are complex instruments and come with a high risk of losing money rapidly due to leverage. 74% of retail investor accounts lose money when trading CFDs with this provider. You should consider whether you understand how CFDs work and whether you can afford to take the high risk of losing your money.

Top Crypto Gainers: Dash, Internet Computer, Pump.fun rally approach crucial levels

Source Fxstreet
  • Dash hovers near $80 on Thursday, after a 35% jump on the previous day.
  • Internet Computer is up 3% above the 200-day EMA, following Wednesday's 25% rise.
  • Pump.fun approaches a key resistance level, up 18% so far this week, marking four consecutive days of recovery.

Dash (DASH), Internet Computer (ICP), and Pump.fun (PUMP) are the top-performing crypto assets over the last 24 hours. DASH and ICP secured double-digit gains on Wednesday, while PUMP marked its fourth day of recovery. Technically, ICP is likely to extend gains above its 200-day Exponential Moving Average (EMA), while Dash and Pump.fun are closing in on a key resistance level.

Dash eyes further gains above $80

Dash trades near $80 at press time on Thursday, holding 35% gains from Wednesday, which amount to roughly 120% gains so far this week. The privacy coin faces opposition from the 61.8% Fibonacci retracement level at $86, traced between the November 4 high at $150 and the December 19 low at $35 on the daily logarithmic chart.

If DASH clears this level, it could target the $100 psychological mark, followed by the 78.6% Fibonacci retracement level at $109.

The technical indicators on the daily chart suggest a surge in bullish momentum, as the Relative Strength Index (RSI) at 81 stabilizes in the overbought zone, while the Moving Average Convergence Divergence (MACD) remains steady, with consistently rising green histogram bars.

DASH/USDT daily logarithmic chart.

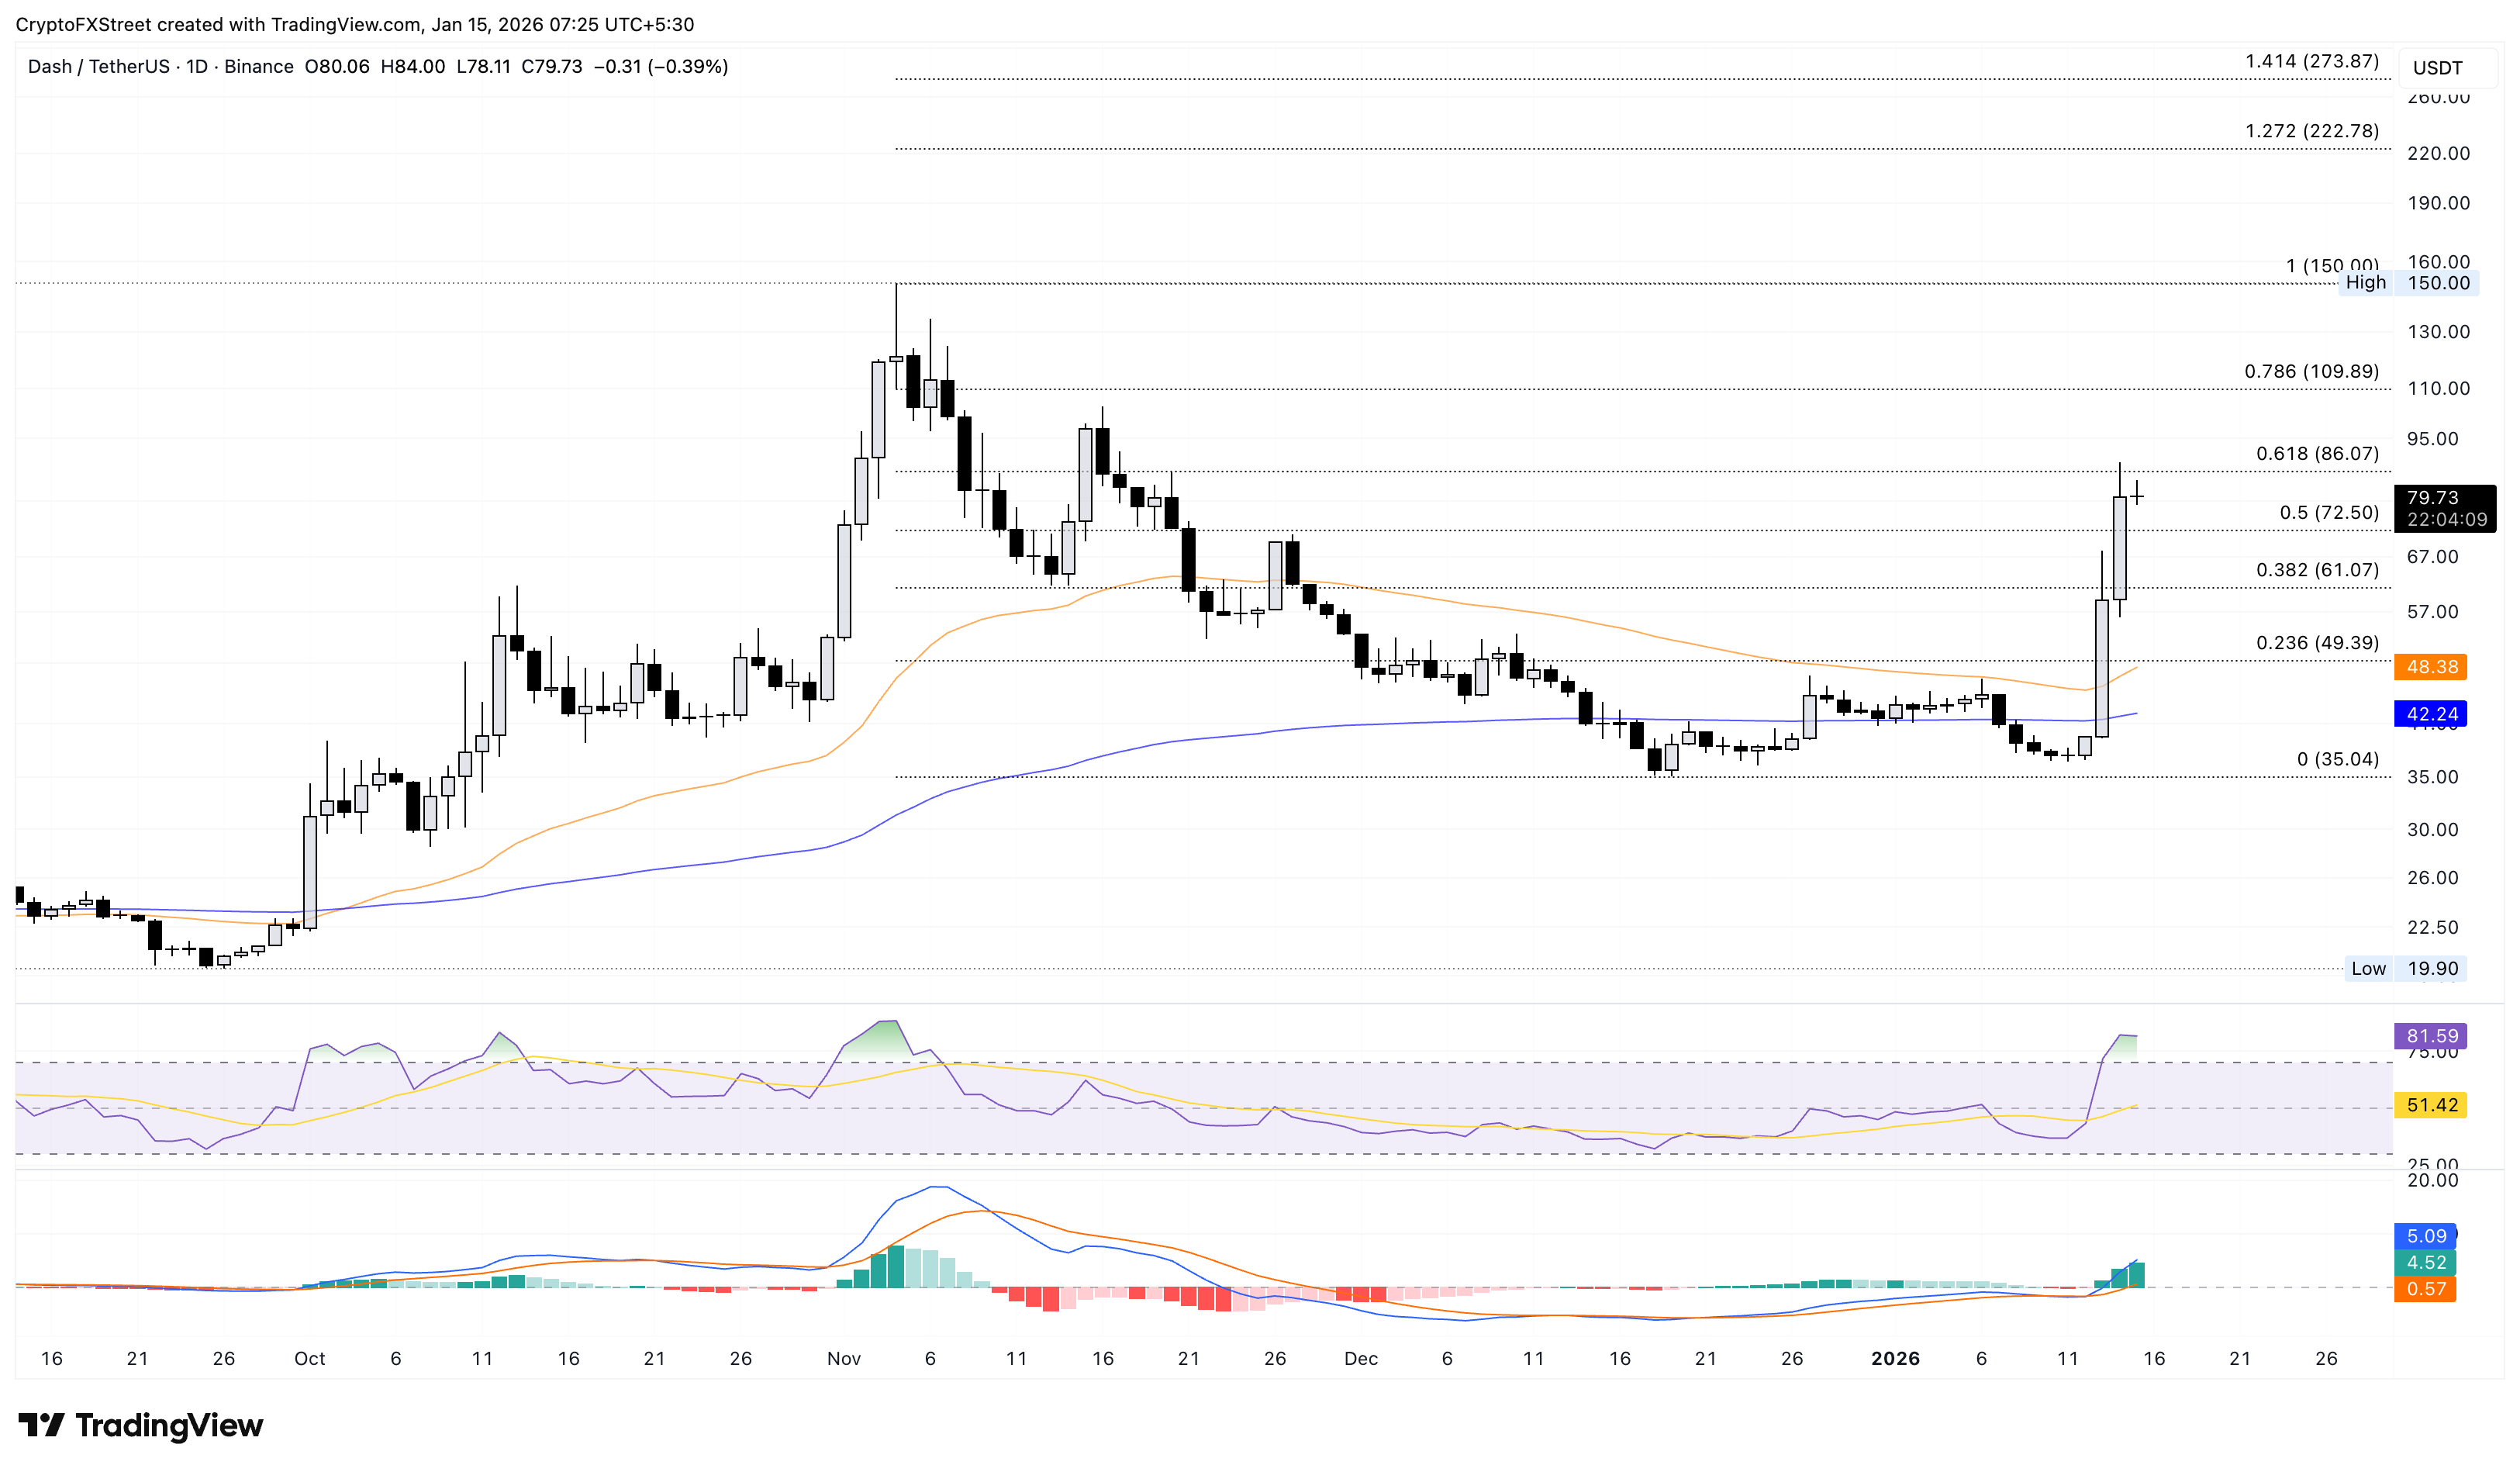
On the downside, the 50% Fibonacci retracement level at $72 could serve as the immediate support. 

Internet Computer approaches the $5 mark

Internet Computer edges higher by 3% at the time of writing on Thursday, extending above the 200-day EMA at $4.40. The ICP token approaches $5, and a close above it could target the key resistance level that capped gains between March and July 2025 at $6.25.

The RSI at 77 on the daily chart rises into the overbought zone, signaling increased buying pressure. Similarly, the steady upward trend in MACD reflects increasing bullish momentum. 

ICP/USDT daily logarithmic chart.

If ICP slips below $4.40, it could test the September 25 low at $3.97. 

Pump.fun’s recovery run faces a key resistance level

Pump.fun approaches $0.003000 after four consecutive days of recovery, amounting to 18% gains so far this week. If PUMP clears the $0.00300 round figure, it could target the R2 Pivot Point at $0.004052. 

Corroborating the upside potential, the RSI is at 64 on the daily chart, and the MACD is rising, indicating a boost in bullish momentum.

ICP/USDT daily price chart.

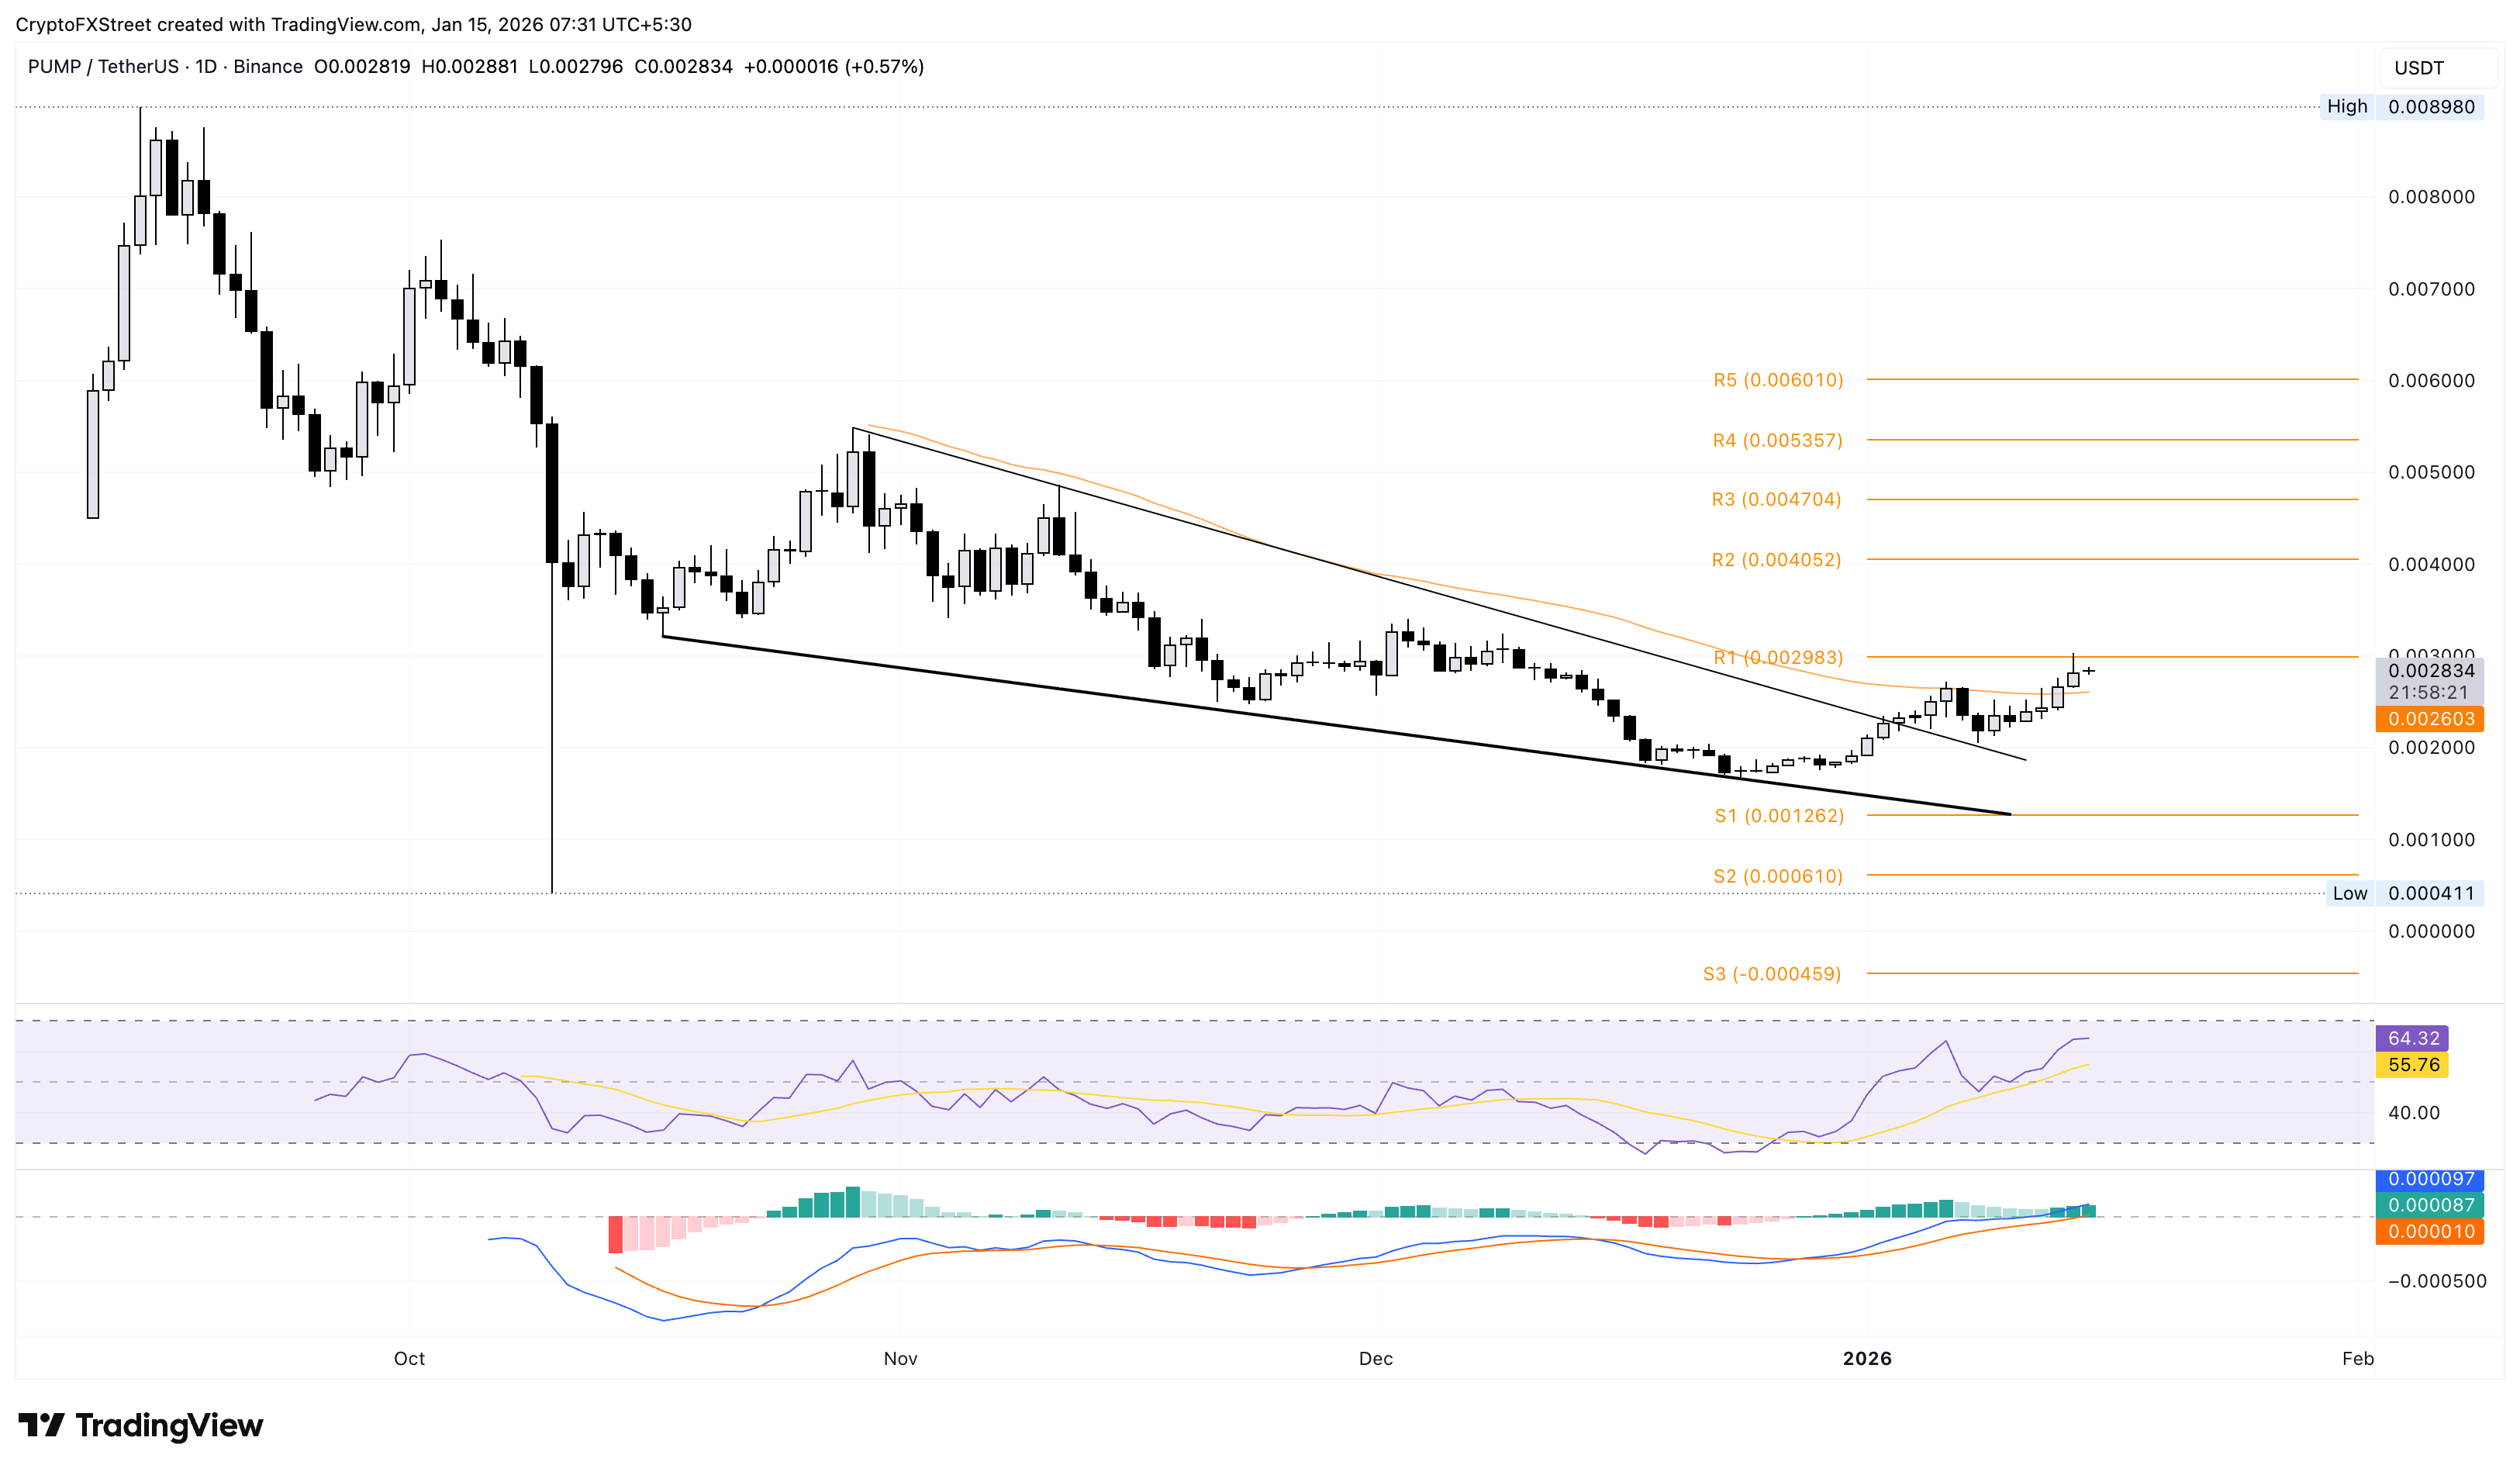
On the flip side, the $0.002000 round figure remains the crucial support level for PUMP.

Disclaimer: The content available on Mitrade Insights is provided for informational and marketing purposes only. It has not been prepared in accordance with legal requirements designed to promote the independence of investment research and is not subject to any prohibition on dealing ahead of the dissemination of investment research
Nothing in this material constitutes investment advice, personal recommendation, investment research, an offer, or a solicitation to buy or sell any financial instrument. The content has been prepared without consideration of your individual investment objectives, financial situation, or needs, and should not be treated as such.
Past performance is not a reliable indicator of future performance and/or results. Forward-looking scenarios or forecasts are not a guarantee of future performance. Actual results may differ materially from those anticipated.
Mitrade makes no representation or warranty as to the accuracy or completeness of the information provided and accepts no liability for any loss arising from reliance on such information.
placeholder
WTI hovers below $59.00 as US-Iran tensions ease, weekly loss loomsWest Texas Intermediate (WTI) Oil price moves little after two days of more than 3% losses, trading around $58.80 during the Asian hours on Friday. WTI price faces challenges as geopolitical risk premiums faded following easing fears of a possible US military strike on Iran.
Author  FXStreet
14 hours ago
West Texas Intermediate (WTI) Oil price moves little after two days of more than 3% losses, trading around $58.80 during the Asian hours on Friday. WTI price faces challenges as geopolitical risk premiums faded following easing fears of a possible US military strike on Iran.
placeholder
Cardano Price Forecast: Rejection at 50-day EMA tightens bearish gripCardano (ADA) edges lower by over 3% at press time on Thursday, extending the second rejection from the 50-day Exponential Moving Average (EMA) so far this month. A bearish side in the retail interest leads to a decline in Open Interest and lowered funding rates.
Author  FXStreet
Yesterday 07: 55
Cardano (ADA) edges lower by over 3% at press time on Thursday, extending the second rejection from the 50-day Exponential Moving Average (EMA) so far this month. A bearish side in the retail interest leads to a decline in Open Interest and lowered funding rates.
placeholder
Hedera Price Forecast: HBAR extends gains as ETF inflows boost sentiment Hedera (HBAR) is trading at around $0.127 on Wednesday, approaching a key resistance level; a breakout above this level would signal further gains. Institutional demand continues to strengthen this week, with spot HBAR Exchange-Traded Funds (ETFs) recording three consecutive days of inflows.
Author  FXStreet
Jan 14, Wed
Hedera (HBAR) is trading at around $0.127 on Wednesday, approaching a key resistance level; a breakout above this level would signal further gains. Institutional demand continues to strengthen this week, with spot HBAR Exchange-Traded Funds (ETFs) recording three consecutive days of inflows.
placeholder
WTI declines below $61.00 as US stockpile builds, Venezuelan exports resumeWest Texas Intermediate (WTI), the US crude oil benchmark, is trading around $60.70 during the Asian trading hours on Wednesday. The WTI price declines as Venezuela resumes exports and the American Petroleum Institute (API) shows a big build in US crude inventories.
Author  FXStreet
Jan 14, Wed
West Texas Intermediate (WTI), the US crude oil benchmark, is trading around $60.70 during the Asian trading hours on Wednesday. The WTI price declines as Venezuela resumes exports and the American Petroleum Institute (API) shows a big build in US crude inventories.
placeholder
BNB Price Forecast: On the verge of breakout as derivatives traders bet on gainsBNB (BNB), formerly known as Binance Coin, is trading above $910 at the time of writing on Tuesday, nearing the upper consolidation boundary. The two months of sideways price action could end, with improving sentiment in the derivatives market suggesting potential upside.
Author  FXStreet
Jan 13, Tue
BNB (BNB), formerly known as Binance Coin, is trading above $910 at the time of writing on Tuesday, nearing the upper consolidation boundary. The two months of sideways price action could end, with improving sentiment in the derivatives market suggesting potential upside.
goTop
quote