CFDs are complex instruments and come with a high risk of losing money rapidly due to leverage. 74% of retail investor accounts lose money when trading CFDs with this provider. You should consider whether you understand how CFDs work and whether you can afford to take the high risk of losing your money.

Pump.fun Price Forecast: PUMP climbs on release of creator-focused callout feature

Source Fxstreet
  • PUMP recovers nearly 5% on Friday, holding around 15% gains so far this week.
  • Pump.fun launched a new callout in the previous feature that lets creators share trending coins on the platform, boosting user activity.
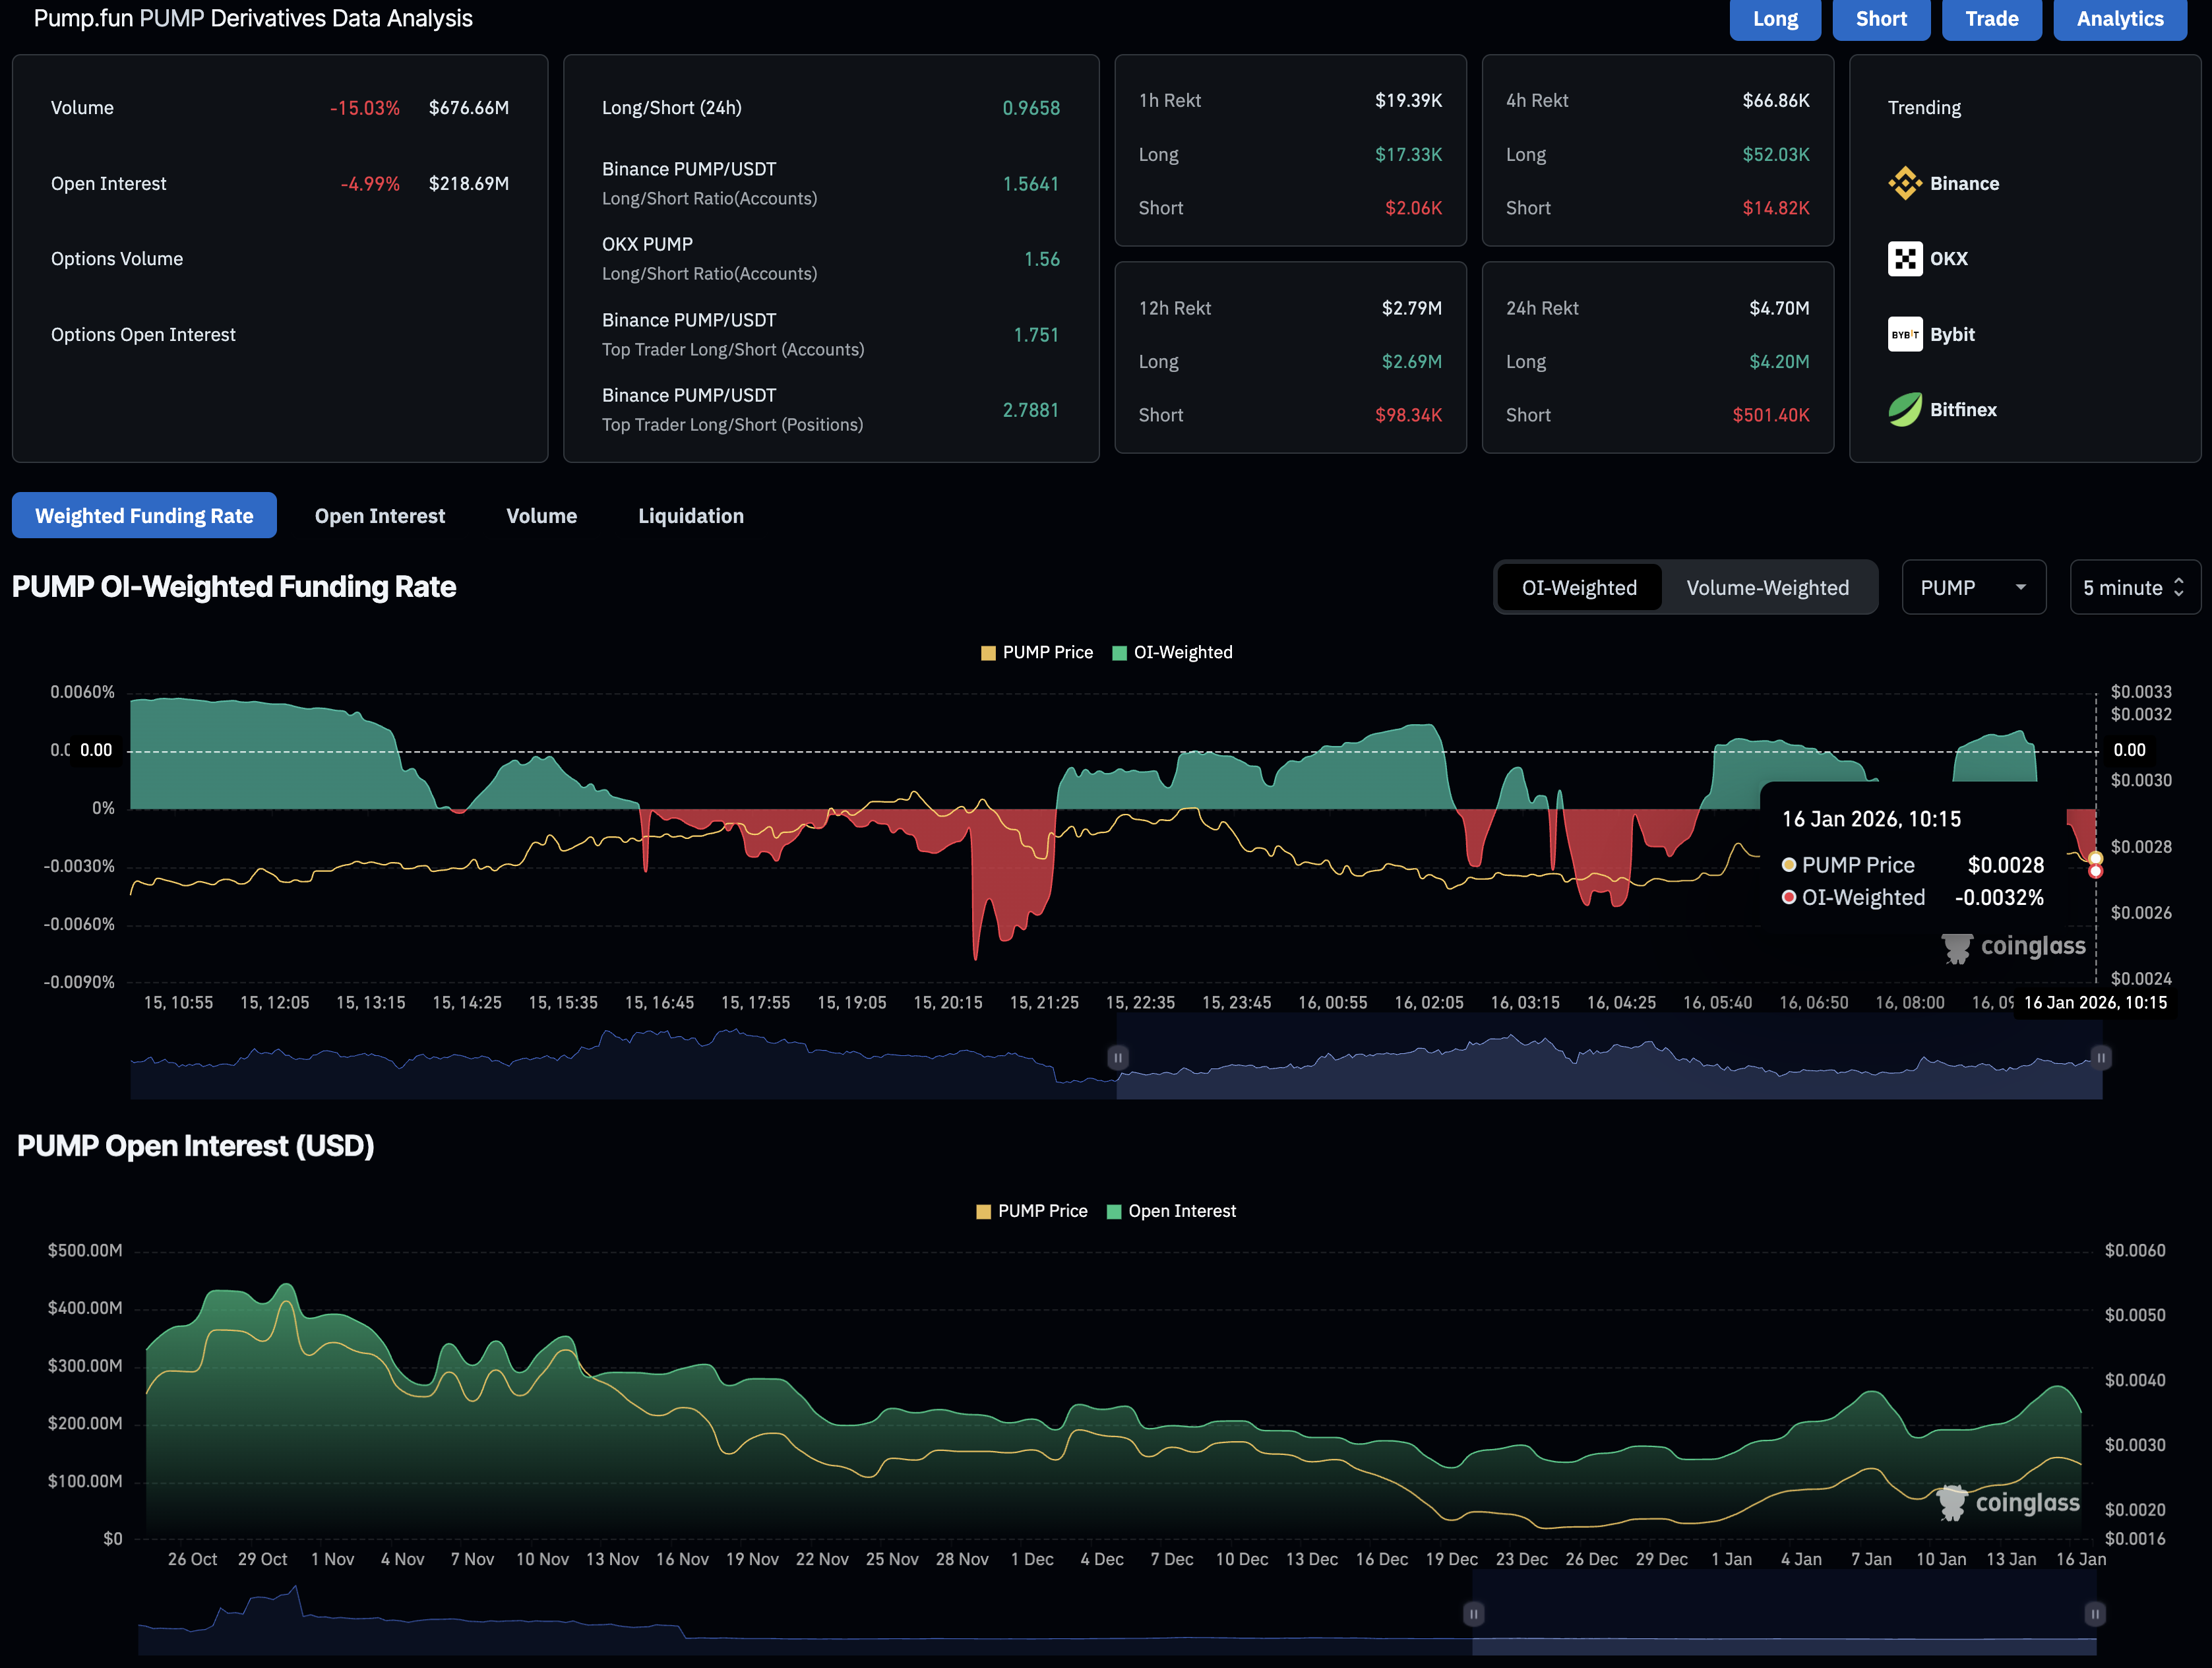
  • Derivatives data imply mixed retail sentiment as funding rates and Open Interest fluctuate. 

Pump.fun (PUMP) edges higher by almost 5% at press time on Friday, recovering from a 3% decline the previous day. The release of the new callout feature on the Solana-based launchpad platform for creators could boost trading activity. Still, the retail sentiment remains mixed as PUMP Open Interest and funding rates teeter. 

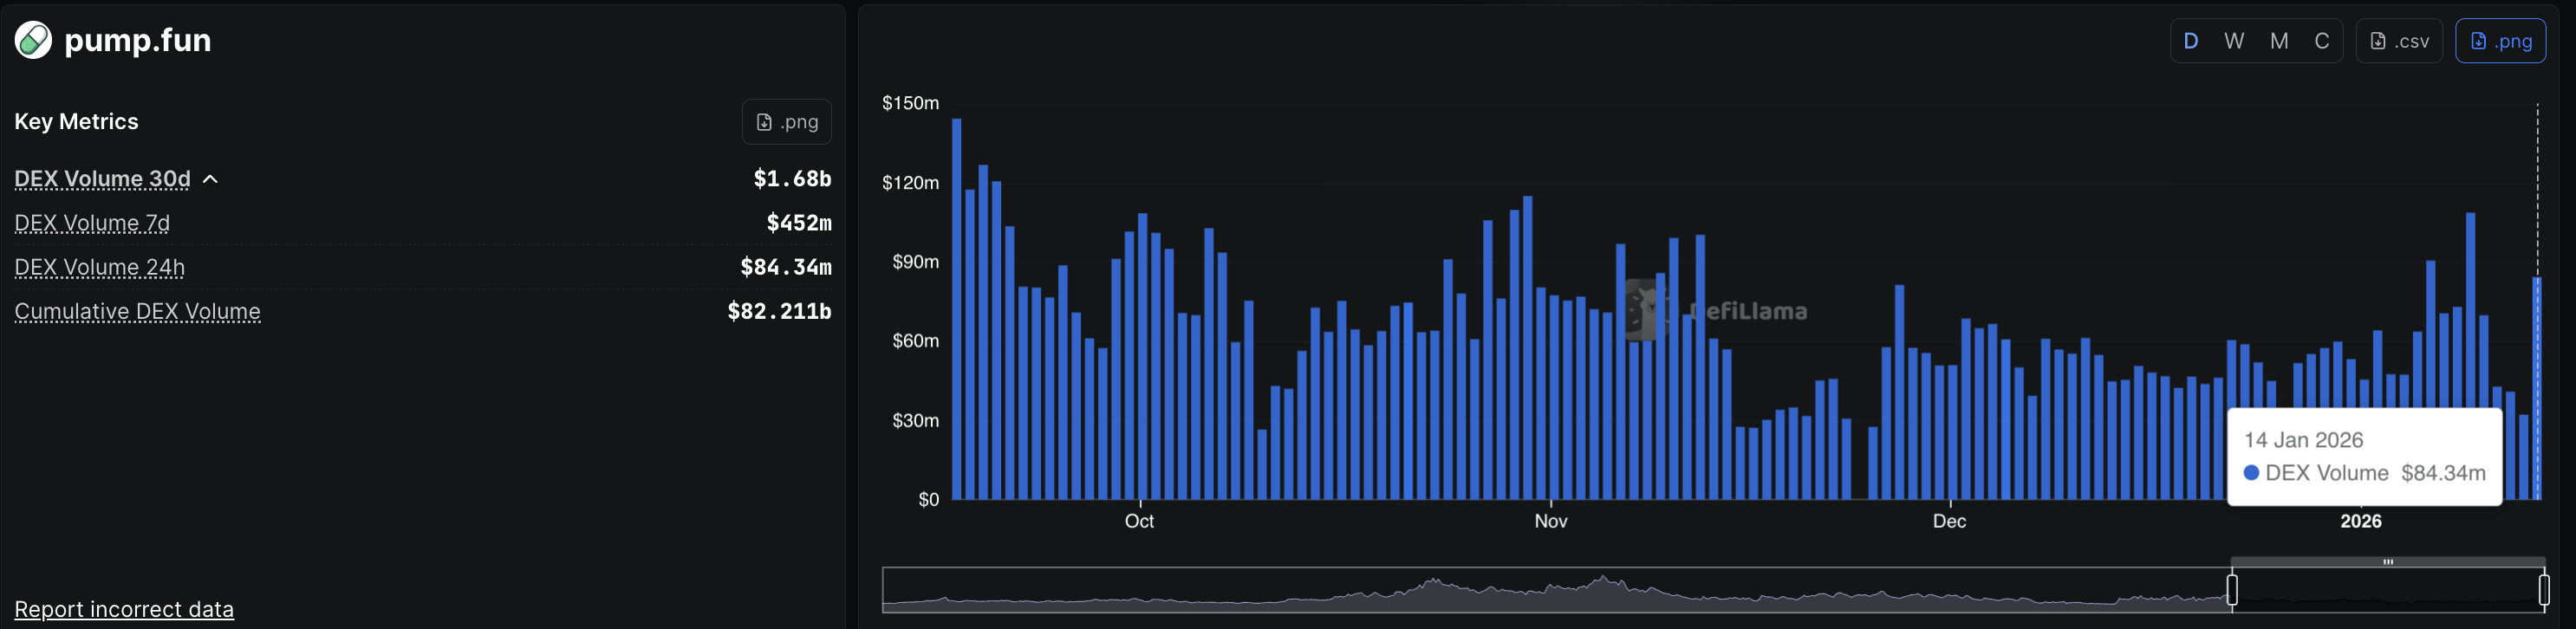
PUMP retail sentiment wavers amid DEX volume surge

Pump.fun released a callout feature on Thursday for creators to share listed coins with their followers, which could boost the social interest and trading activity on the platform. The release aligns with a recovery in DEX volume to $84.34 million, after a steady decline earlier this week.

Pump.fun DEX volume data. Source: DeFiLlama

Derivatives data show wavering retail interest in PUMP as capital flow and funding rates see-saw over the last week. CoinGlass data shows PUMP Open Interest (OI) is down 4.99% in the previous 24 hours to $218.69 million, pulled from $250 million twice so far this month. The near-term upside bias is cooling as OI continues to slope lower.

The OI-weighted funding rate is at -0.0032%, pulling into the negative territory, reflecting an incline among traders to hold short positions.

PUMP derivatives data. Source: CoinGlass

Technical outlook: Will PUMP clear the $0.003000 level?

PUMP approaches the $0.003000 round figure after facing rejection in the last two sessions. The upward slope in the 20-day Exponential Moving Average (EMA) above the 50-day EMA reflects an upward bias. Additionally, PUMP holds a steady rise above these moving averages, indicating buy strength.

The Moving Average Convergence Divergence (MACD) remains above the signal line and in positive territory, although the histogram nearly plateaus, hinting at easing bullish momentum. The Relative Strength Index (RSI) at 64 rises toward the overbought zone, consistent with this week’s recovery.

If PUMP closes the day above $0.003000, it would keep the near-term bias supported and put the R2 Pivot Point at $0.004048 in focus as the next hurdle. 

PUMP/USDT daily price chart.

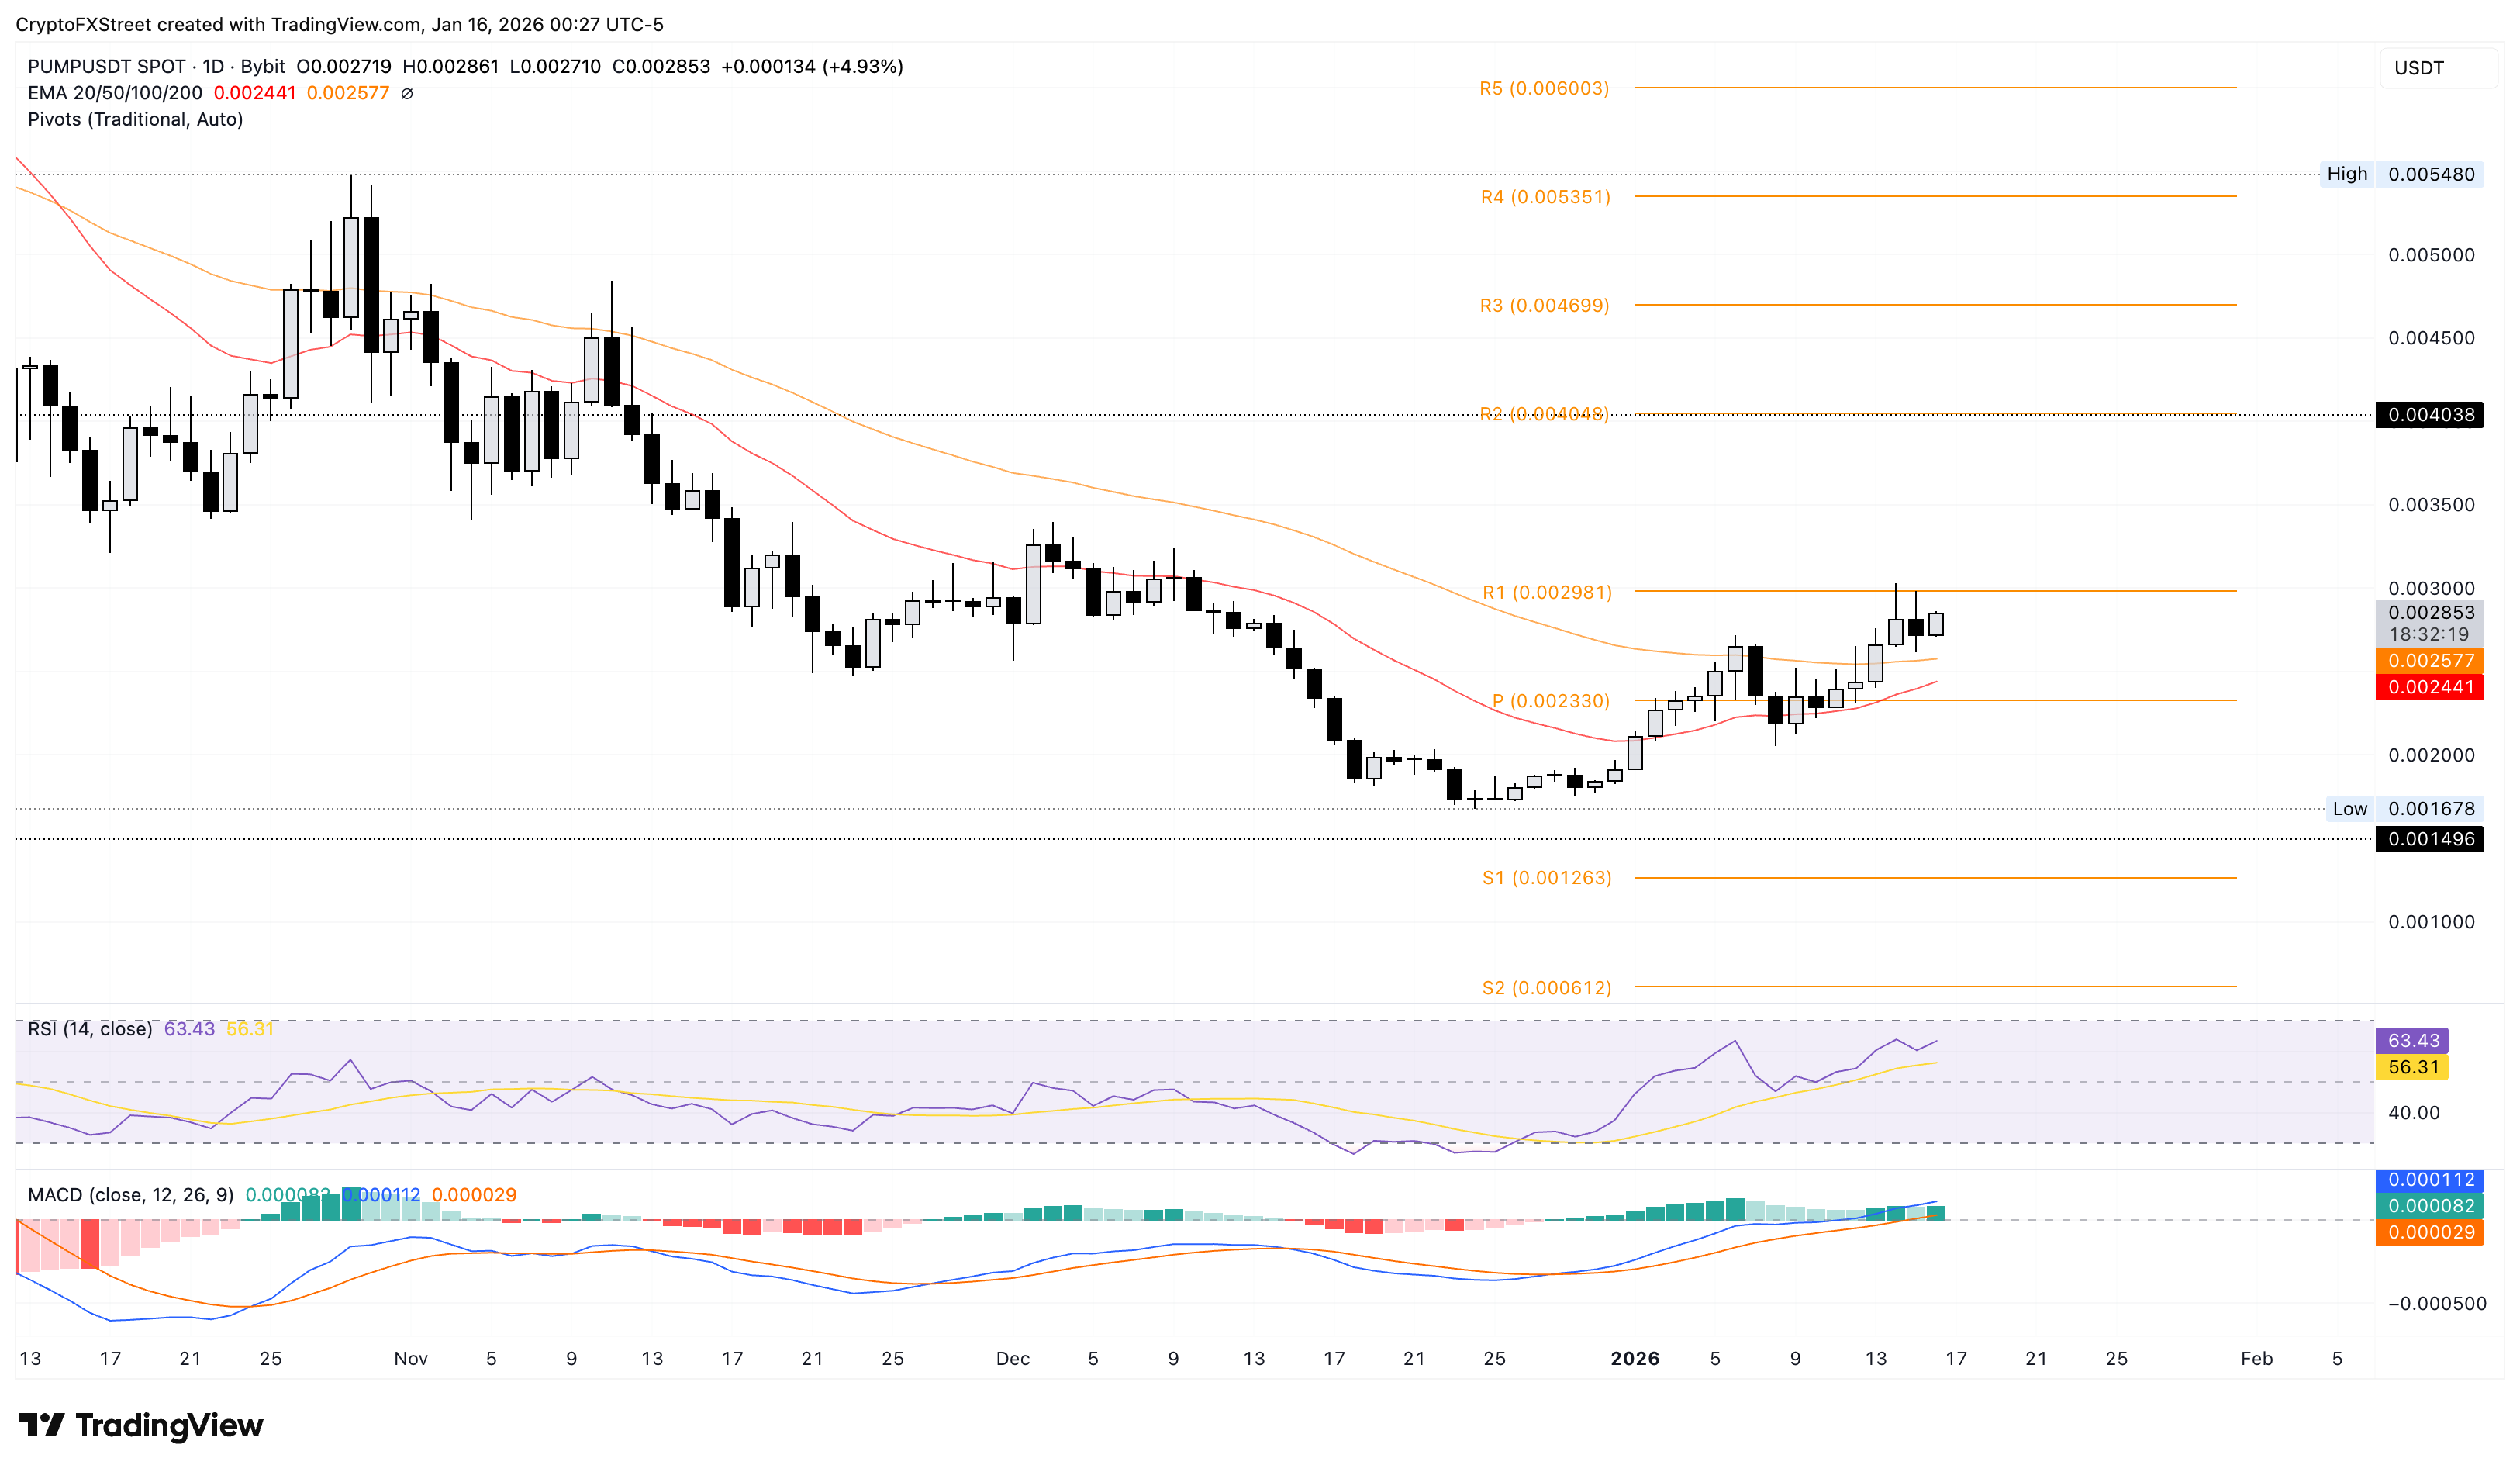
A slip beneath the 20-day EMA at $0.002577 would invite a deeper pullback to the centre Pivot Point at $0.002330, where buyers would need to reassert to avoid a loss of trend quality.  

(The technical analysis of this story was written with the help of an AI tool.)

Disclaimer: The content available on Mitrade Insights is provided for informational and marketing purposes only. It has not been prepared in accordance with legal requirements designed to promote the independence of investment research and is not subject to any prohibition on dealing ahead of the dissemination of investment research
Nothing in this material constitutes investment advice, personal recommendation, investment research, an offer, or a solicitation to buy or sell any financial instrument. The content has been prepared without consideration of your individual investment objectives, financial situation, or needs, and should not be treated as such.
Past performance is not a reliable indicator of future performance and/or results. Forward-looking scenarios or forecasts are not a guarantee of future performance. Actual results may differ materially from those anticipated.
Mitrade makes no representation or warranty as to the accuracy or completeness of the information provided and accepts no liability for any loss arising from reliance on such information.
placeholder
WTI hovers below $59.00 as US-Iran tensions ease, weekly loss loomsWest Texas Intermediate (WTI) Oil price moves little after two days of more than 3% losses, trading around $58.80 during the Asian hours on Friday. WTI price faces challenges as geopolitical risk premiums faded following easing fears of a possible US military strike on Iran.
Author  FXStreet
14 hours ago
West Texas Intermediate (WTI) Oil price moves little after two days of more than 3% losses, trading around $58.80 during the Asian hours on Friday. WTI price faces challenges as geopolitical risk premiums faded following easing fears of a possible US military strike on Iran.
placeholder
Cardano Price Forecast: Rejection at 50-day EMA tightens bearish gripCardano (ADA) edges lower by over 3% at press time on Thursday, extending the second rejection from the 50-day Exponential Moving Average (EMA) so far this month. A bearish side in the retail interest leads to a decline in Open Interest and lowered funding rates.
Author  FXStreet
Yesterday 07: 55
Cardano (ADA) edges lower by over 3% at press time on Thursday, extending the second rejection from the 50-day Exponential Moving Average (EMA) so far this month. A bearish side in the retail interest leads to a decline in Open Interest and lowered funding rates.
placeholder
Hedera Price Forecast: HBAR extends gains as ETF inflows boost sentiment Hedera (HBAR) is trading at around $0.127 on Wednesday, approaching a key resistance level; a breakout above this level would signal further gains. Institutional demand continues to strengthen this week, with spot HBAR Exchange-Traded Funds (ETFs) recording three consecutive days of inflows.
Author  FXStreet
Jan 14, Wed
Hedera (HBAR) is trading at around $0.127 on Wednesday, approaching a key resistance level; a breakout above this level would signal further gains. Institutional demand continues to strengthen this week, with spot HBAR Exchange-Traded Funds (ETFs) recording three consecutive days of inflows.
placeholder
WTI declines below $61.00 as US stockpile builds, Venezuelan exports resumeWest Texas Intermediate (WTI), the US crude oil benchmark, is trading around $60.70 during the Asian trading hours on Wednesday. The WTI price declines as Venezuela resumes exports and the American Petroleum Institute (API) shows a big build in US crude inventories.
Author  FXStreet
Jan 14, Wed
West Texas Intermediate (WTI), the US crude oil benchmark, is trading around $60.70 during the Asian trading hours on Wednesday. The WTI price declines as Venezuela resumes exports and the American Petroleum Institute (API) shows a big build in US crude inventories.
placeholder
BNB Price Forecast: On the verge of breakout as derivatives traders bet on gainsBNB (BNB), formerly known as Binance Coin, is trading above $910 at the time of writing on Tuesday, nearing the upper consolidation boundary. The two months of sideways price action could end, with improving sentiment in the derivatives market suggesting potential upside.
Author  FXStreet
Jan 13, Tue
BNB (BNB), formerly known as Binance Coin, is trading above $910 at the time of writing on Tuesday, nearing the upper consolidation boundary. The two months of sideways price action could end, with improving sentiment in the derivatives market suggesting potential upside.
goTop
quote