CFDs are complex instruments and come with a high risk of losing money rapidly due to leverage. 74% of retail investor accounts lose money when trading CFDs with this provider. You should consider whether you understand how CFDs work and whether you can afford to take the high risk of losing your money.

Bitcoin Cash trades lower, risks dead-cat bounce amid bearish signals

Source Fxstreet
  • Bitcoin Cash trades below $522 on Tuesday after multiple rejections at key resistance.
  • Derivatives and on-chain data suggest a bearish outlook, with rising short bets and sell-side dominance.
  • The technical outlook suggests a potential dead-cat bounce, with a downside target of $478.

Bitcoin Cash (BCH) trades in the red below $522 at the time of writing on Tuesday, after multiple rejections at key resistance. BCH’s derivatives and on-chain indicators point to growing bearish sentiment and raise the risk of a dead-cat bounce toward lower support levels.

Derivatives and on-chain metrics signal a bearish bias

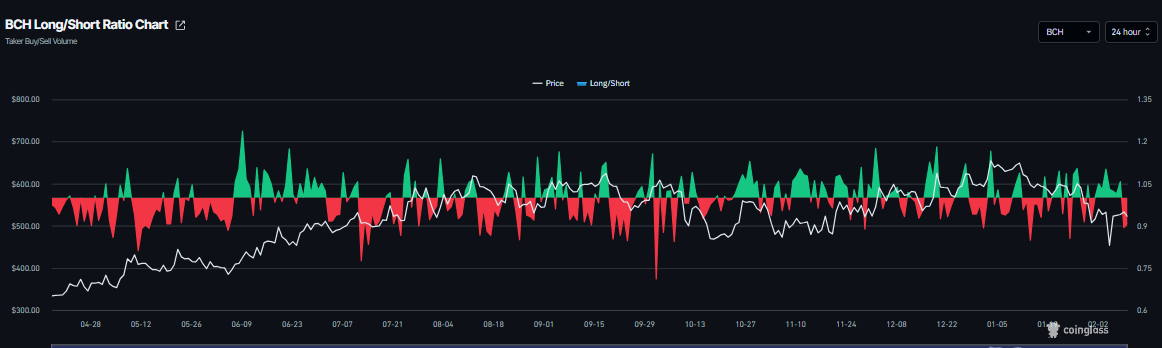
Bitcoin Cash’s derivatives data shows a bearish outlook. CoinGlass long-to-short ratio for HYPE reads 0.90 on Tuesday. This ratio, being below one, indicates bearish sentiment in the market, as more traders are betting on the asset’s price to fall.

BCH long-to-short ratio chart. Source: Coinglass

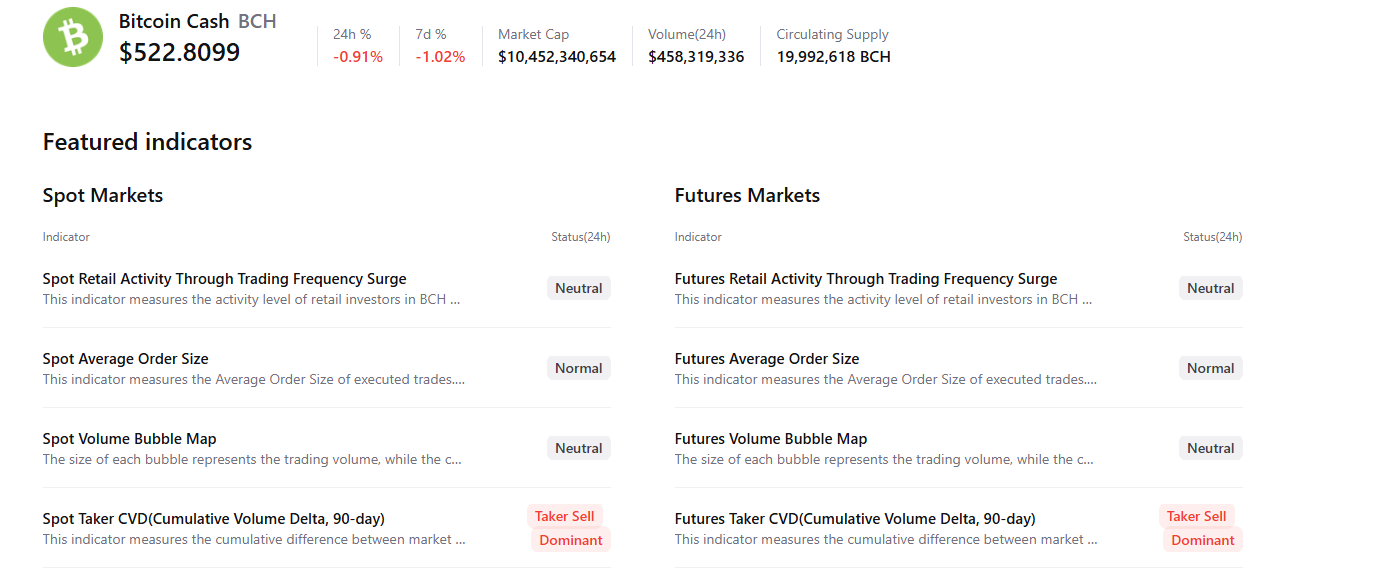
CryptoQuant’s summary data supports the negative outlook, as BCH’s spot and futures markets show sell dominance, signaling a correction ahead.

Bitcoin Cash Price Forecast: Dead-cat bounce scenario in play

Bitcoin Cash price has been rejected multiple times at the 61.8% Fibonacci retracement level (from the January 27 high of $603.90 to the February 6 low of $423.00) at $534.80. This level roughly coincides with the previously broken ascending trendline and the 200-day Exponential Moving Average (EMA) at $544.70, making this a key reversal zone. 

Moreover, the current price action suggests a potential dead-cat bounce — a brief price increase within a broader downtrend — with BCH trading at $525.40 on Tuesday.

If BCH continues its correction, it could extend the decline toward the daily support at $478.70.

The Relative Strength Index (RSI) reads 44, below its neutral level of 50 and points downward, suggesting bearish momentum is gaining traction. However, the Moving Average Convergence Divergence (MACD) lines are converging, increasing the likelihood of a bullish crossover. If the MACD fails to confirm a bullish crossover, it suggests bearish momentum remains intact, increasing the risk of a further correction.

BCH/USDT daily chart

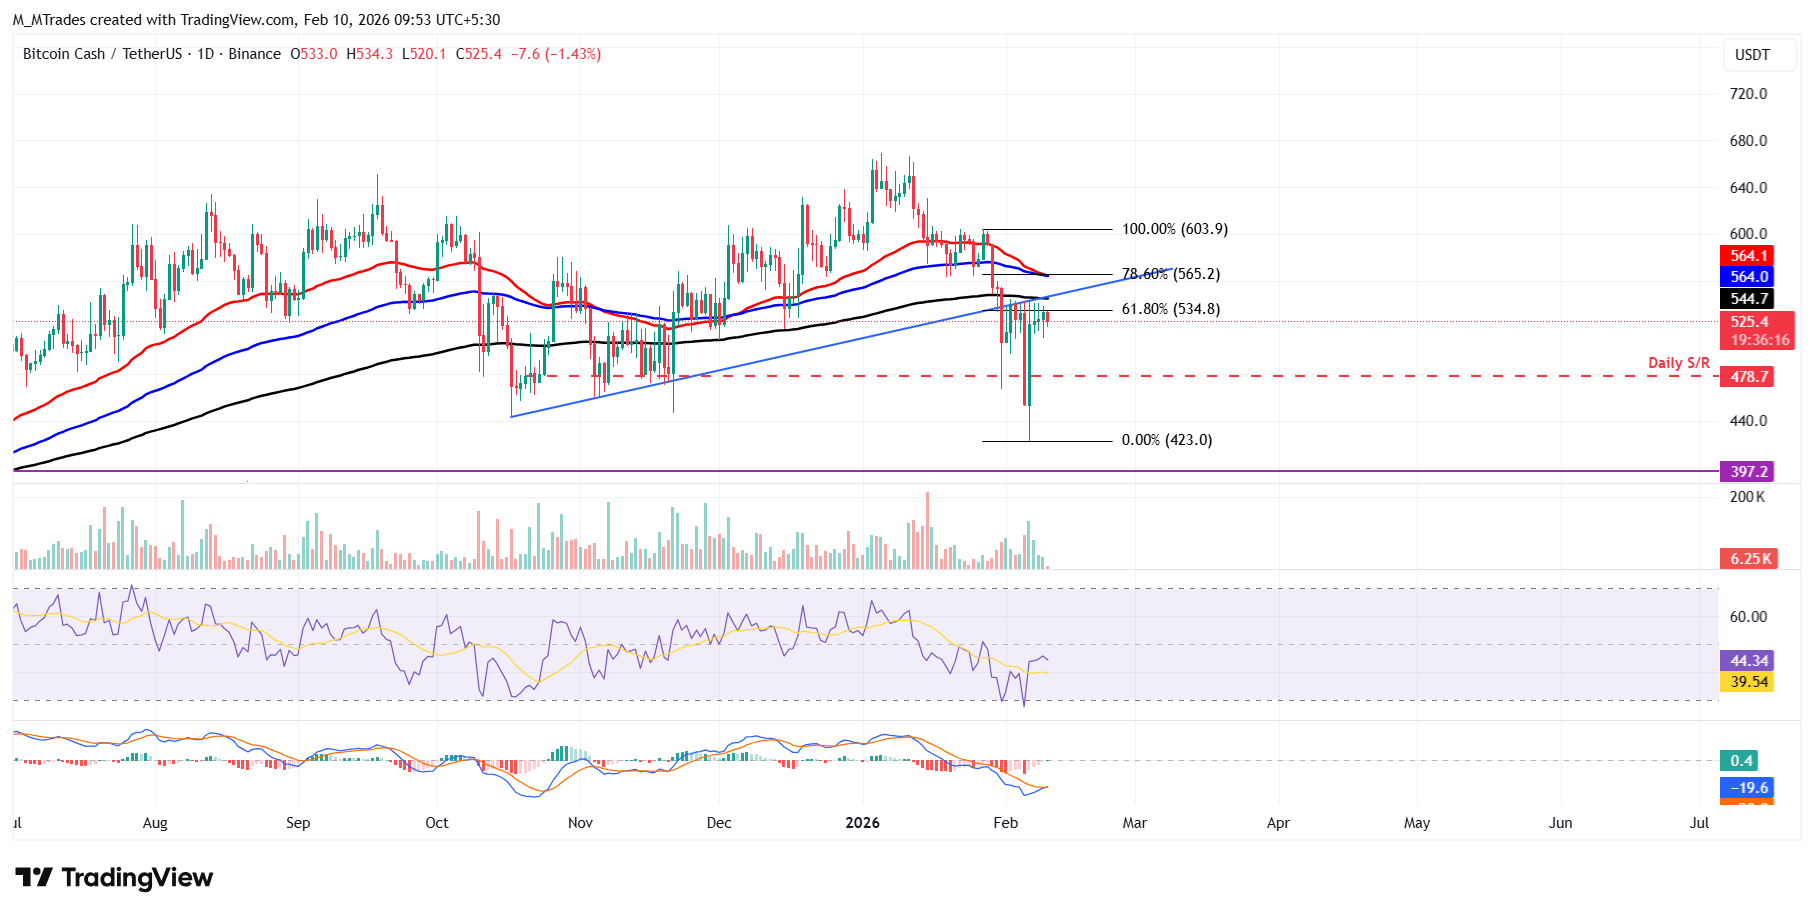
However, if BCH rallies and closes above the 200-day EMA at $544.70 on a daily basis, it could extend the advance toward the immediate resistance at $564.00, its 100-day EMA.

Disclaimer: The content available on Mitrade Insights is provided for informational and marketing purposes only. It has not been prepared in accordance with legal requirements designed to promote the independence of investment research and is not subject to any prohibition on dealing ahead of the dissemination of investment research
Nothing in this material constitutes investment advice, personal recommendation, investment research, an offer, or a solicitation to buy or sell any financial instrument. The content has been prepared without consideration of your individual investment objectives, financial situation, or needs, and should not be treated as such.
Past performance is not a reliable indicator of future performance and/or results. Forward-looking scenarios or forecasts are not a guarantee of future performance. Actual results may differ materially from those anticipated.
Mitrade makes no representation or warranty as to the accuracy or completeness of the information provided and accepts no liability for any loss arising from reliance on such information.
placeholder
Pi Network Price Forecast: PI falls as December token unlock overshadows gaming partnershipPi Network (PI) is down 4% by press time on Friday, after three days of an uptrend fueled by the CiDi Games partnership announcement on Wednesday.
Author  FXStreet
Nov 28, 2025
Pi Network (PI) is down 4% by press time on Friday, after three days of an uptrend fueled by the CiDi Games partnership announcement on Wednesday.
placeholder
GBP/USD Price Forecast: Softens below 1.3500 but retains positive technical outlookThe GBP/USD pair loses momentum near 1.3485 during the early European session on Monday, pressured by renewed US Dollar (USD) demand. The potential downside for a major pair might be limited, as the Bank of England (BoE) guided that monetary policy will remain on a gradual downward path.
Author  FXStreet
Dec 29, 2025
The GBP/USD pair loses momentum near 1.3485 during the early European session on Monday, pressured by renewed US Dollar (USD) demand. The potential downside for a major pair might be limited, as the Bank of England (BoE) guided that monetary policy will remain on a gradual downward path.
placeholder
Silver Price Forecast: XAG/USD rebounds above $77.00 amid market cautionSilver price (XAG/USD) edges higher after two days of losses, trading around $77.20 per troy ounce during the Asian hours on Friday. The prices of the precious metals, including Silver hold ground as traders adopt caution ahead of key US jobs data amid elevated geopolitical tensions.
Author  FXStreet
Jan 09, Fri
Silver price (XAG/USD) edges higher after two days of losses, trading around $77.20 per troy ounce during the Asian hours on Friday. The prices of the precious metals, including Silver hold ground as traders adopt caution ahead of key US jobs data amid elevated geopolitical tensions.
placeholder
WTI hovers below $59.00 as US-Iran tensions ease, weekly loss loomsWest Texas Intermediate (WTI) Oil price moves little after two days of more than 3% losses, trading around $58.80 during the Asian hours on Friday. WTI price faces challenges as geopolitical risk premiums faded following easing fears of a possible US military strike on Iran.
Author  FXStreet
Jan 16, Fri
West Texas Intermediate (WTI) Oil price moves little after two days of more than 3% losses, trading around $58.80 during the Asian hours on Friday. WTI price faces challenges as geopolitical risk premiums faded following easing fears of a possible US military strike on Iran.
placeholder
Silver price today: Silver rises, according to FXStreet dataSilver prices (XAG/USD) rose on Monday, according to FXStreet data. Silver trades at $81.78 per troy ounce, up 5.54% from the $77.48 it cost on Friday.
Author  FXStreet
Feb 09, Mon
Silver prices (XAG/USD) rose on Monday, according to FXStreet data. Silver trades at $81.78 per troy ounce, up 5.54% from the $77.48 it cost on Friday.
Related Instrument
goTop
quote