

Ripple Price Forecast: XRP’s bearish outlook deepens as US-Iran war weighs on sentiment
- XRP slides for the second consecutive day, reflecting risk-off sentiment in the broader crypto market.
- The US-Iran war is spreading across the Middle East, pressuring risk assets.
- Muted retail activity and mild ETF outflows could limit potential short-term recovery in XRP price.
Ripple (XRP) remains under pressure, trading around $1.35 at the time of writing on Monday. The remittance token extended its down leg to $1.27 on Saturday after the United States (US), in collaboration with Israel, launched attacks on Iran, killing the nation’s Supreme Leader, Ali Khamenei.
Although knee-jerk recovery pushed XRP to $1.43 on Sunday, the overall outlook leans bearishly as Iran escalates the war, striking several Middle East nations, including Iraq, Kuwait, Qatar, Saudi Arabia, Oman, Jordan and Bahrain, among others.
Risk sentiment is largely on the back foot, with investors on edge amid the escalation of the war. Global trade is also at risk, especially with Oil prices expected to increase. Since wars rarely favour risk assets, retail and institutional interest in XRP could continue to fade as the conflicts evolve.
XRP faces weak retail demand, mild ETF inflows
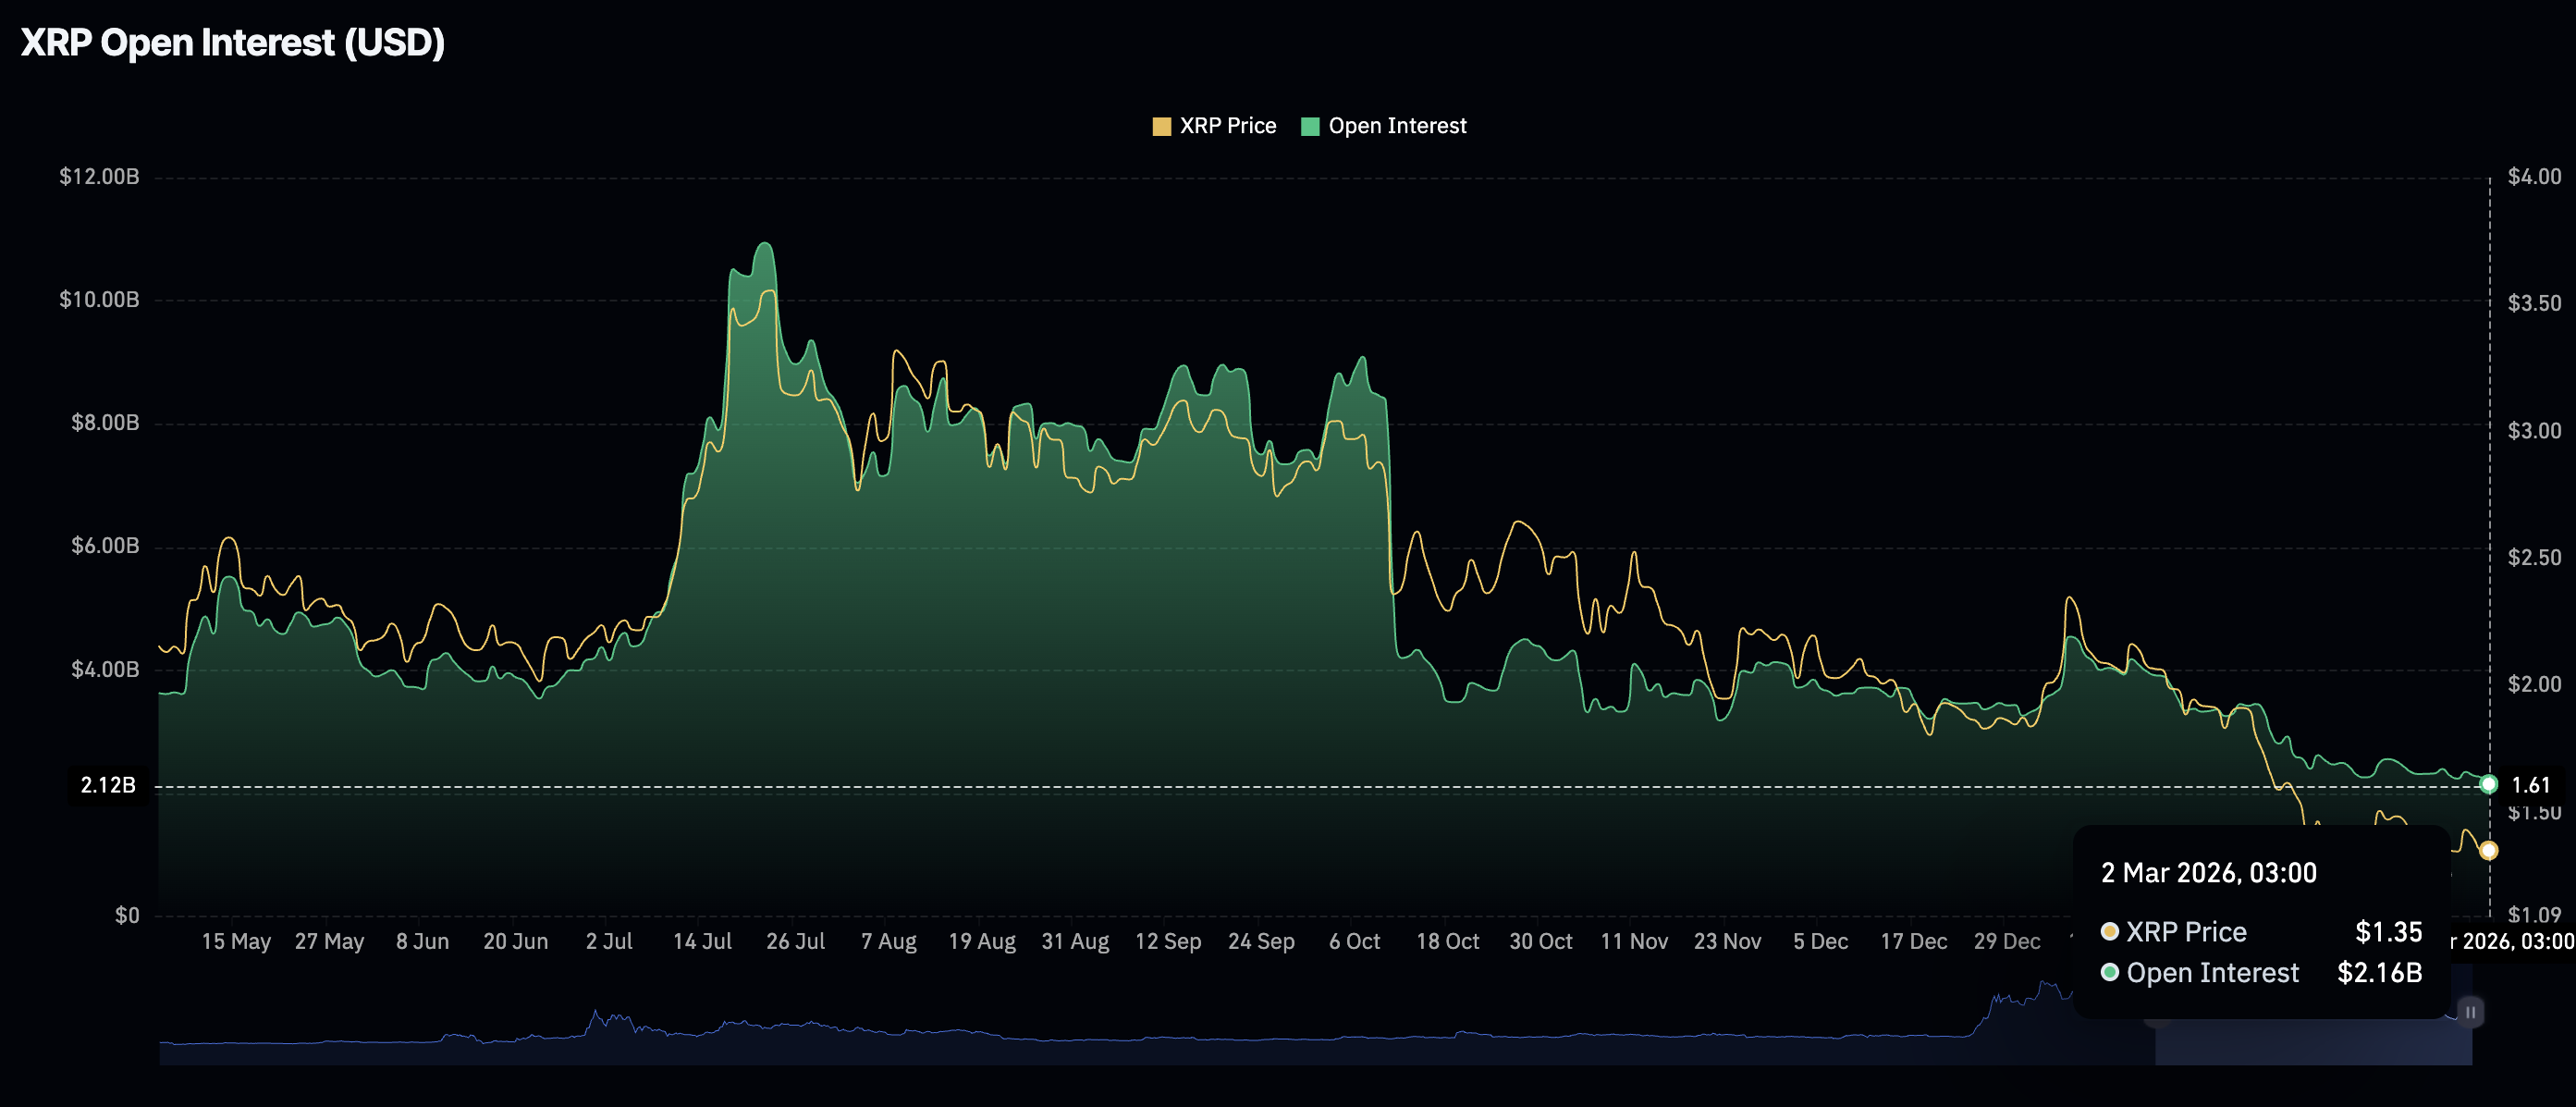
Retail investor interest in XRP has persistently waned, as evidenced by a significant slump in derivatives activity. CoinGlass data shows that the drop in futures Open Interest (OI) to $2.16 billion on Monday, from $2.26 billion the previous day, undermines risk appetite. The OI is at its lowest level since January 2025.
In contrast, OI hit a record $10.94 billion in July, coinciding with XRP reaching $3.66, the current all-time high. A steadily declining OI suggests that investors are unwilling to lean into risk and would rather close positions than open new ones.
Institutional interest in XRP remains low despite mild inflows of $2.21 million into spot Exchange-Traded Funds (ETFs) on Friday. Cumulative inflows totaled $9.55 million last week, bringing the net assets under management to $983 million.
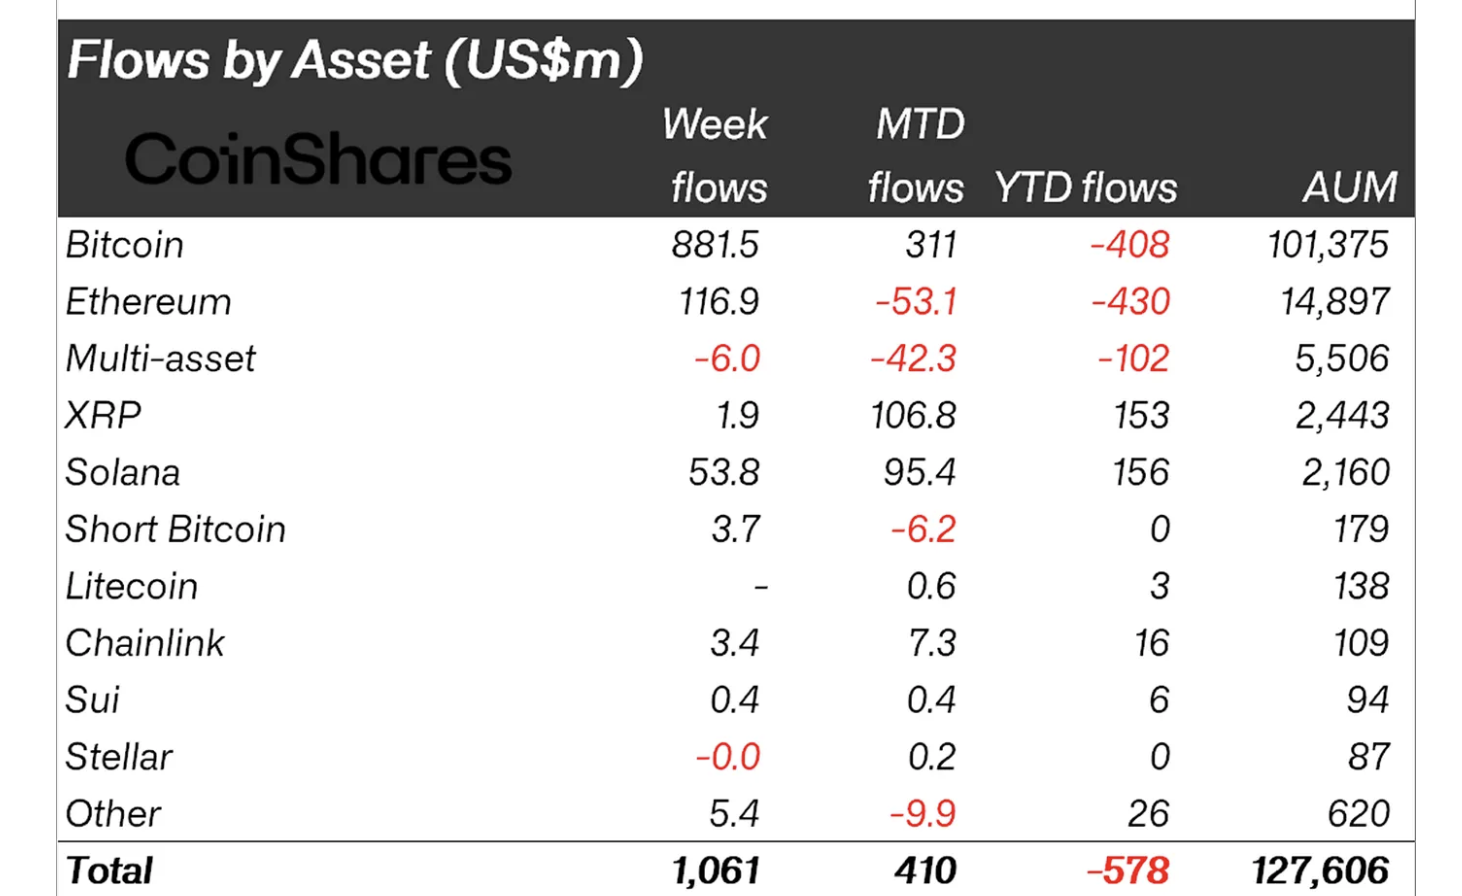
Meanwhile, digital assets products recorded $1 billion inflows last week, breaking a five-week outflow streak, according to CoinShares. XRP-related products saw $1.9 million in inflows, with total assets under management averaging $2.44 billion.
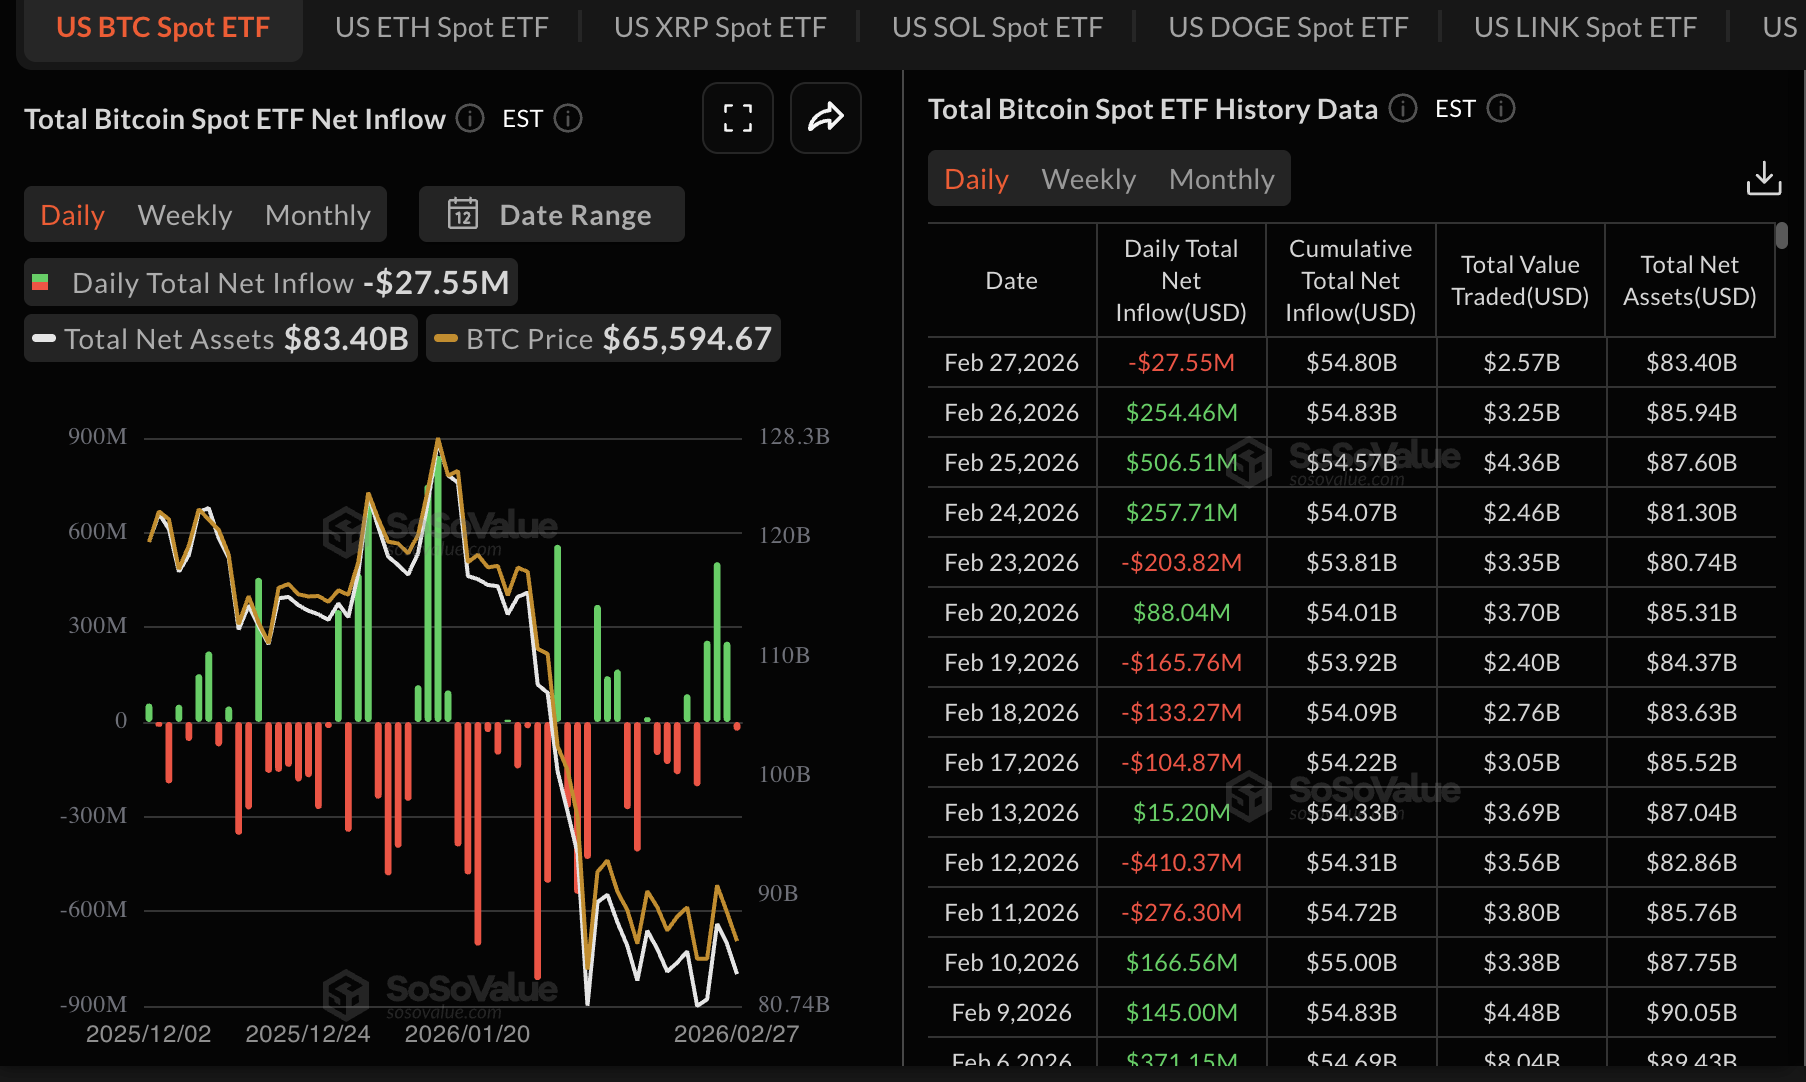
Inflows into Bitcoin (BTC) and Ethereum (ETH) totalled $886 million and $117 million, respectively, underscoring key technical resets and renewed whale accumulation.
“Digital asset investment products recorded $1 billion in inflows last week, ending a five-week stretch of outflows that totalled $4.0 billion. From a macro standpoint, it is difficult to attribute the shift in sentiment to a single catalyst,” CoinShares’ report states.
Technical outlook: Bearish indicators weigh on XRP
XRP trades around $1.35, well below the 50, 100 and 200-day Exponential Moving Averages (EMAs), which are clustered between $1.58 and $2.05. All three moving averages are sloping lower, keeping the broader trend under pressure despite recent recovery from the Saturday low of $1.27.
The Moving Average Convergence Divergence (MACD) indicator remains above the signal line on the daily chart, with the green histogram bars modestly expanding, suggesting mild bullish momentum and limited follow-through so far.
At the same time, the Relative Strength Index (RSI) around 39 is below the 50 midline on the same chart, reinforcing the view that sellers still retain an edge even as downside momentum has eased.
-1772455725612-1772455725616.png)
Meanwhile, immediate resistance emerges at $1.40, where recent candles have failed to break above the descending trendline. Further upside hurdles lie ahead, with the 50-day EMA at $1.59. A daily close above that moving average level would ease medium-term bearish pressure and open the way toward the 100-day EMA at $1.81.
Still, initial support lies at the recent floor and current spot area near $1.27. A clear break below this demand would expose XRP to the February low at $1.12.
Ripple FAQs
Ripple is a payments company that specializes in cross-border remittance. The company does this by leveraging blockchain technology. RippleNet is a network used for payments transfer created by Ripple Labs Inc. and is open to financial institutions worldwide. The company also leverages the XRP token.
XRP is the native token of the decentralized blockchain XRPLedger. The token is used by Ripple Labs to facilitate transactions on the XRPLedger, helping financial institutions transfer value in a borderless manner. XRP therefore facilitates trustless and instant payments on the XRPLedger chain, helping financial firms save on the cost of transacting worldwide.
XRPLedger is based on a distributed ledger technology and the blockchain using XRP to power transactions. The ledger is different from other blockchains as it has a built-in inflammatory protocol that helps fight spam and distributed denial-of-service (DDOS) attacks. The XRPL is maintained by a peer-to-peer network known as the global XRP Ledger community.
XRP uses the interledger standard. This is a blockchain protocol that aids payments across different networks. For instance, XRP’s blockchain can connect the ledgers of two or more banks. This effectively removes intermediaries and the need for centralization in the system. XRP acts as the native token of the XRPLedger blockchain engineered by Jed McCaleb, Arthur Britto and David Schwartz.
(The technical analysis of this story was written with the help of an AI tool.)
Nothing in this material constitutes investment advice, personal recommendation, investment research, an offer, or a solicitation to buy or sell any financial instrument. The content has been prepared without consideration of your individual investment objectives, financial situation, or needs, and should not be treated as such.
Past performance is not a reliable indicator of future performance and/or results. Forward-looking scenarios or forecasts are not a guarantee of future performance. Actual results may differ materially from those anticipated.
Mitrade makes no representation or warranty as to the accuracy or completeness of the information provided and accepts no liability for any loss arising from reliance on such information.
Recommended Articles


