



Crypto Overview: Bitcoin nears $75,000 amid the US grand deal – Aave, Algorand, Ethereum lead gains
- Bitcoin holds above $74,000 on Tuesday after a 5% rebound from the 50-day EMA on Monday.
- US Vice President JD Vance revealed potential grand deal exists for Iran if it ends its nuclear program.
- Aave, Algorand, and Ethereum lead the rally over the last 24 hours.
Bitcoin (BTC) steadies above $74,000 at press time on Tuesday after a 5% jump the previous day as the US blockades the Strait of Hormuz amid ongoing peace negotiations. US Vice President JD Vance shares a potential grand deal in motion for Iran while demanding an end to its nuclear program.
The broader cryptocurrency market sentiment is recovering, with liquidations crossing $500 million over the last 24 hours, driven by short liquidations. Meanwhile, Aave (AAVE), Algorand (ALGO), and Ethereum (ETH) are leading gains.
US blocks Hormuz amid the Vice President’s grand plan framework
US and Iran continue to negotiate ceasefire conditions, while the US forces start to blockade the Strait of Hormuz, obstructing transiting ships from the coastal region. Meanwhile, JD Vance, in an interview, suggested that the “ball is in the Iranian court” as the US negotiations mainly focus on the nuclear material exiting Iran and stopping its Uranium enrichment program.
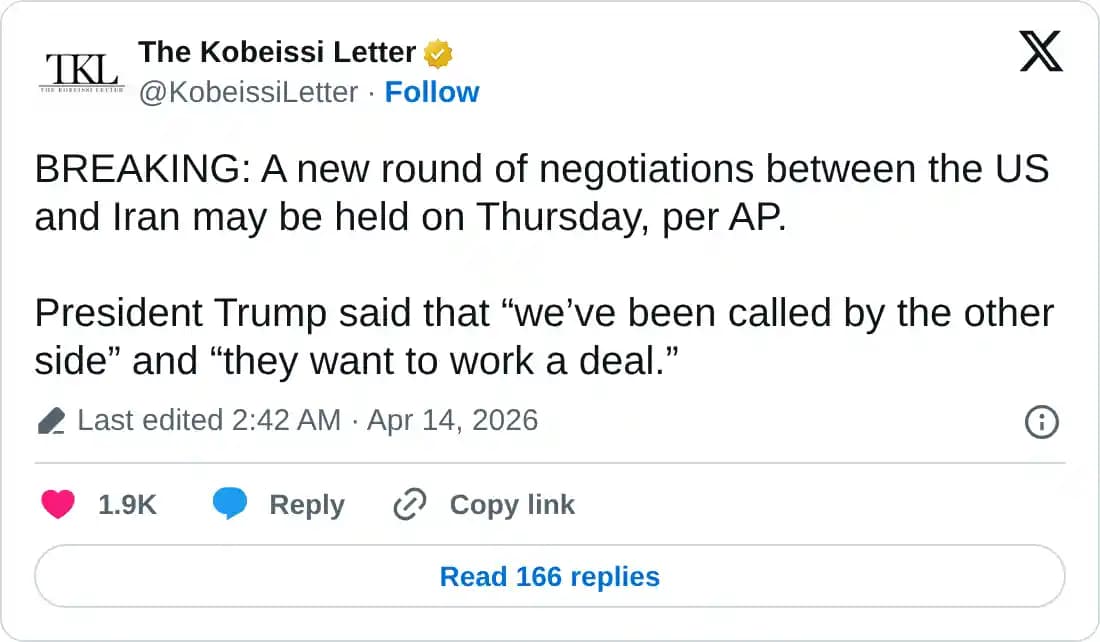
According to The Kobeissi Letter, President Trump said that “we’ve been called by the other side” and “they want to work a deal.”
Short squeeze in the crypto market
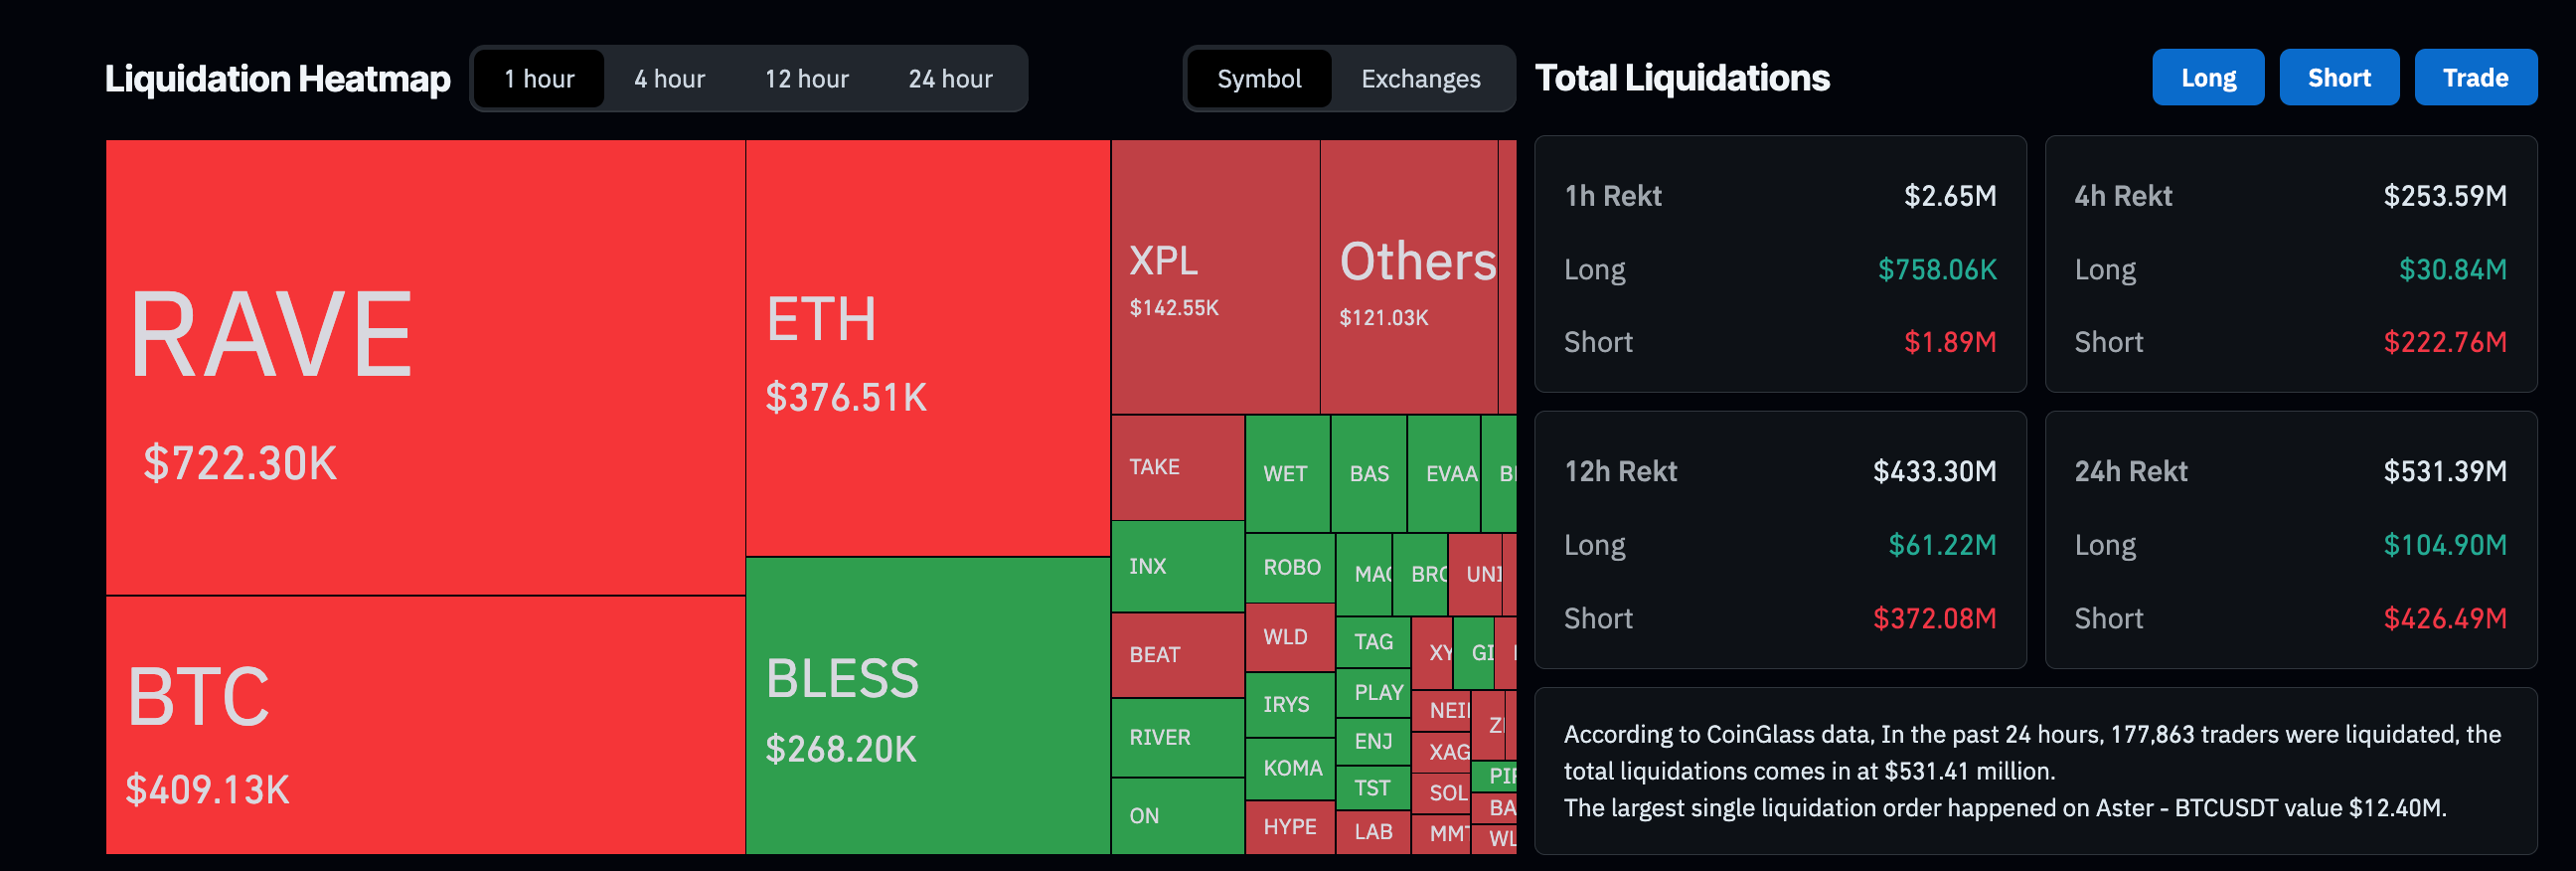
The peace negotiations are boosting risk-on sentiment in the cryptocurrency market. CoinGlass data shows $531 million in total liquidations over the last 24 hours, driven by $426 million in short liquidations, suggesting a bearish wipeout.
Bitcoin inches closer to $75,000
Bitcoin holds a neutral-to-bullish tone as it consolidates above the 50-day Exponential Moving Average (EMA) at $71,019 while still capped beneath the 100-day EMA at $75,309. The immediate resistance is clustered around the 100-day EMA at $75,309.83 and the 23.6% Fibonacci retracement at $75,623, measured from the $126,199 to $60,000 downswing.
A daily close above this zone would open the way toward the 200-day EMA at $82,936.74 and then to the 50% retracement level at $93,099.
Momentum supports the constructive bias, with the Relative Strength Index (RSI) hovering around 62 and the Moving Average Convergence Divergence (MACD) in positive territory, suggesting upside pressure is gaining traction rather than fading.
On the downside, initial support is provided by the 50-day EMA at $71,019.83; a break below this line would weaken the current constructive tone and expose a deeper retracement toward the structural anchor of the Fibonacci setup near $60,000.
Top Crypto Gainers: Aave, Algorand, and Ethereum regain strength
AAVE remains in a broader bearish context as price holds below the 50-day, 100-day, and 200-day EMAs, with the nearest dynamic cap coming from the 50-day EMA around $106.74. The recent break above the descending trendline, now offering support near $97.32, suggests downside pressure is easing, while the MACD turns positive and the RSI hovers just above 50, hinting at a mild improvement in short-term momentum rather than a confirmed trend reversal.
On the topside, initial resistance is at the 50-day EMA near $106.74; a daily close above this barrier would open the way toward the 100-day EMA around $124.56, with the 200-day EMA, higher up near $155.93, as a more distant cap within the prevailing downtrend.
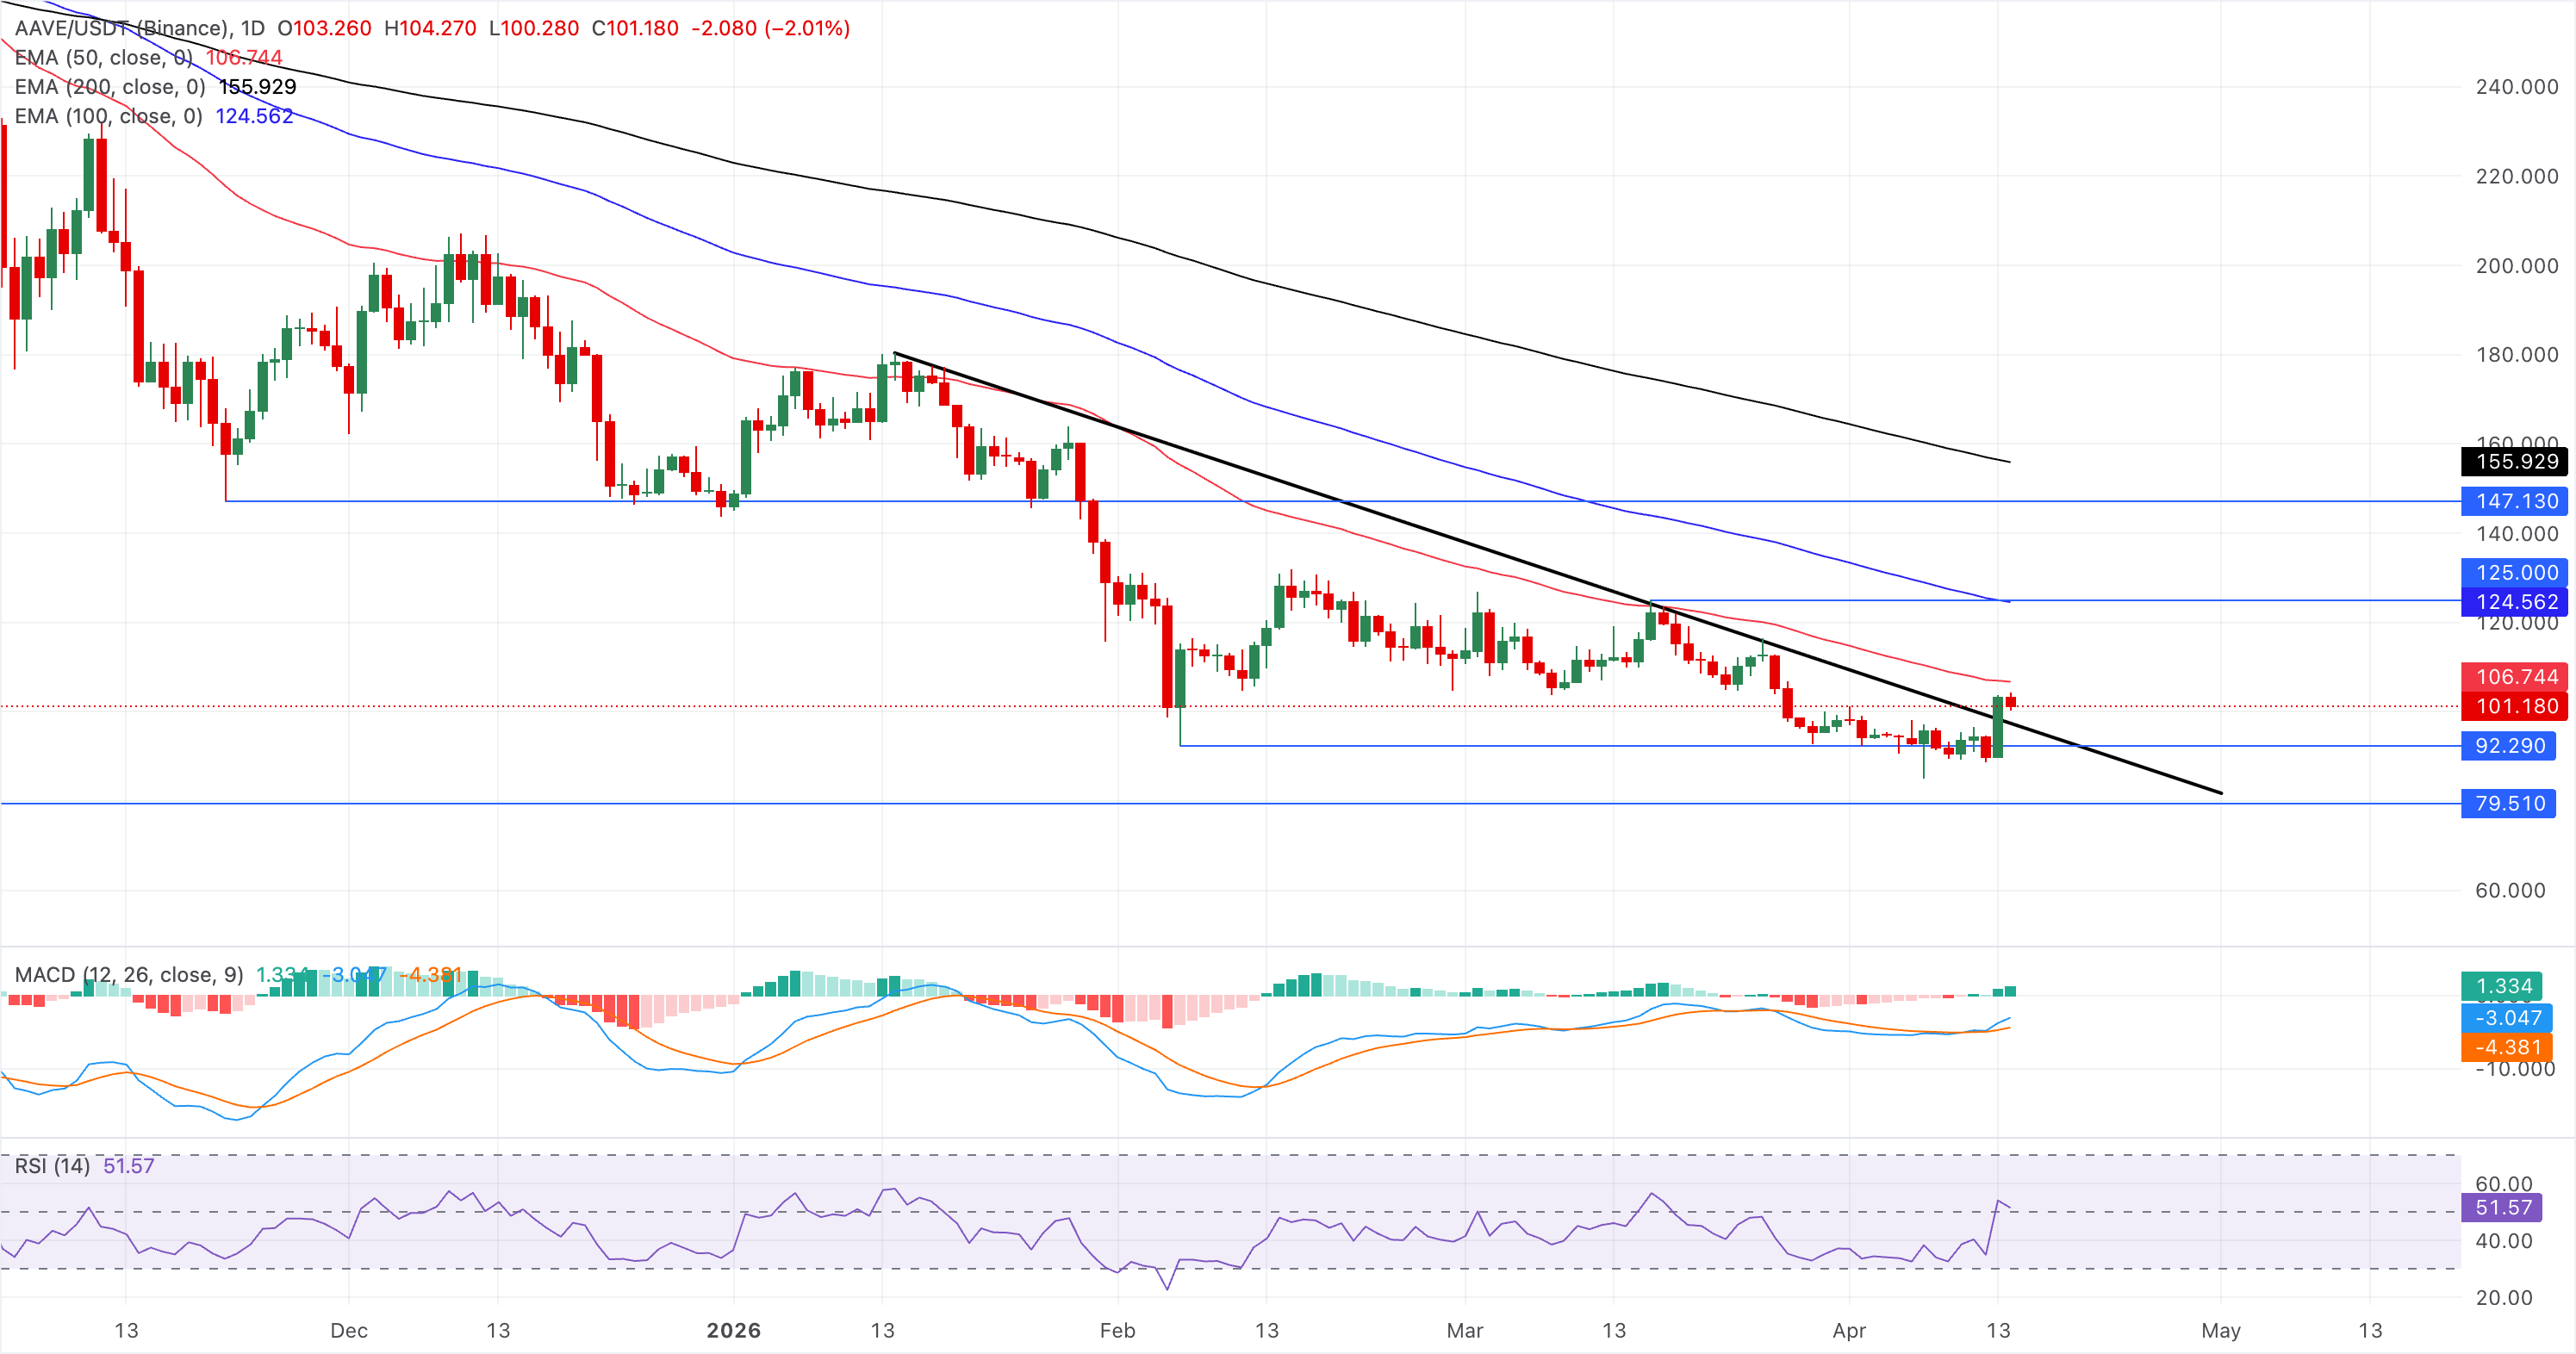
On the downside, the former descending resistance line that was broken around $97.32 now acts as first technical support, and a drop back below this level would expose the market to renewed selling pressure and a potential retest of lower prices within the existing bearish structure.
Algorand is maintaining a constructive near-term bias as it remains above its 50-day and 100-day EMAs at $0.1005 and $0.1070, respectively. This positioning suggests the recent pullback is a pause within an emerging bullish phase, although price is still capped below the 50% retracement of the downswing from $0.1456 to $0.0807 at $0.1132, while the RSI near 58 shows moderate positive momentum that is starting to cool in line with a flattening MACD line.
A decisive close above the 50% retracement at $0.1132 could open the path toward the 200-day EMA at $0.1283.
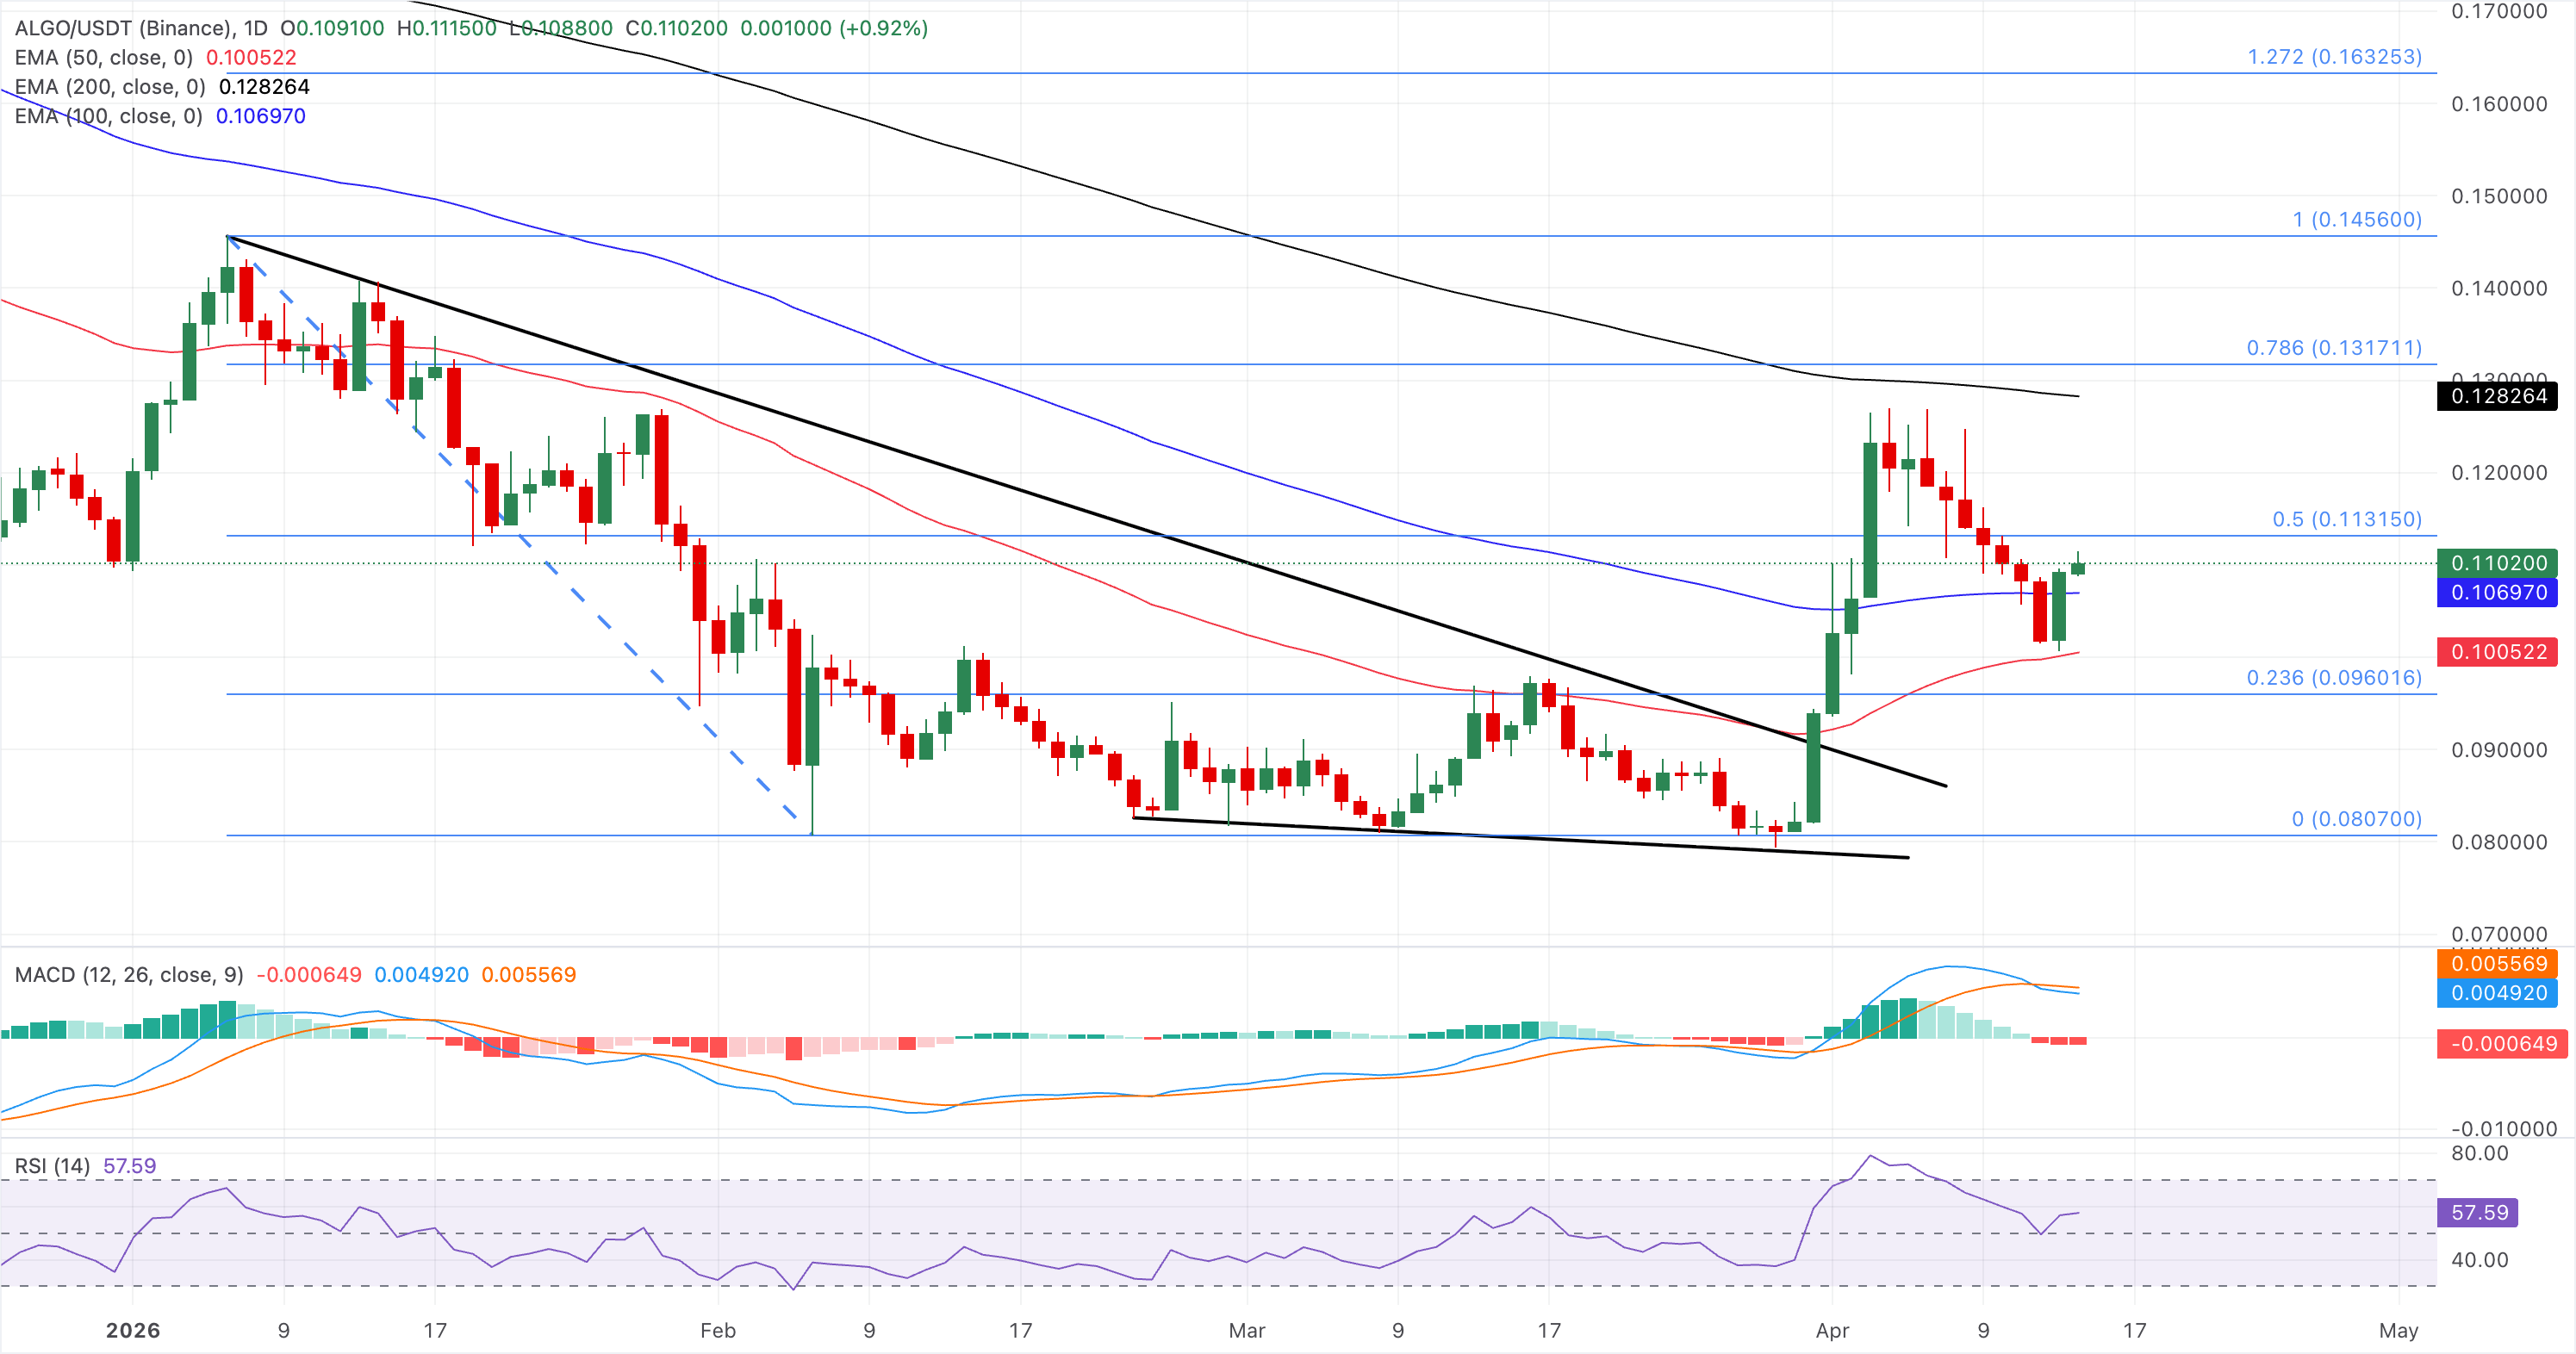
On the downside, initial support is seen at the 100-day EMA around $0.1070, ahead of the 38.2% retracement at $0.1055 and the 50-day EMA at $0.1005, with deeper protection at $0.0960 and the cycle low near $0.0807 if sellers regain control.
Ethereum maintains a constructive bullish tone as it holds above the 50-day EMA near $2,178 and the 100-day EMA around $2,355. The 50% retracement of the latest swing from $3,402 to $1,747 at roughly $2,575 is acting as the first upside barrier, while the 200-day EMA near $2,631 stays well above the price and caps the broader recovery outlook.
A rising MACD line with positive readings and an RSI hovering around 64 both suggest buyers retain control, though conditions are edging toward stretched rather than neutral.
A decisive close above the 50% retracement at $2,575 and the 200-day EMA at $2,631 could extend gains toward the 78.6% Fibonacci retracement level at $3,048.
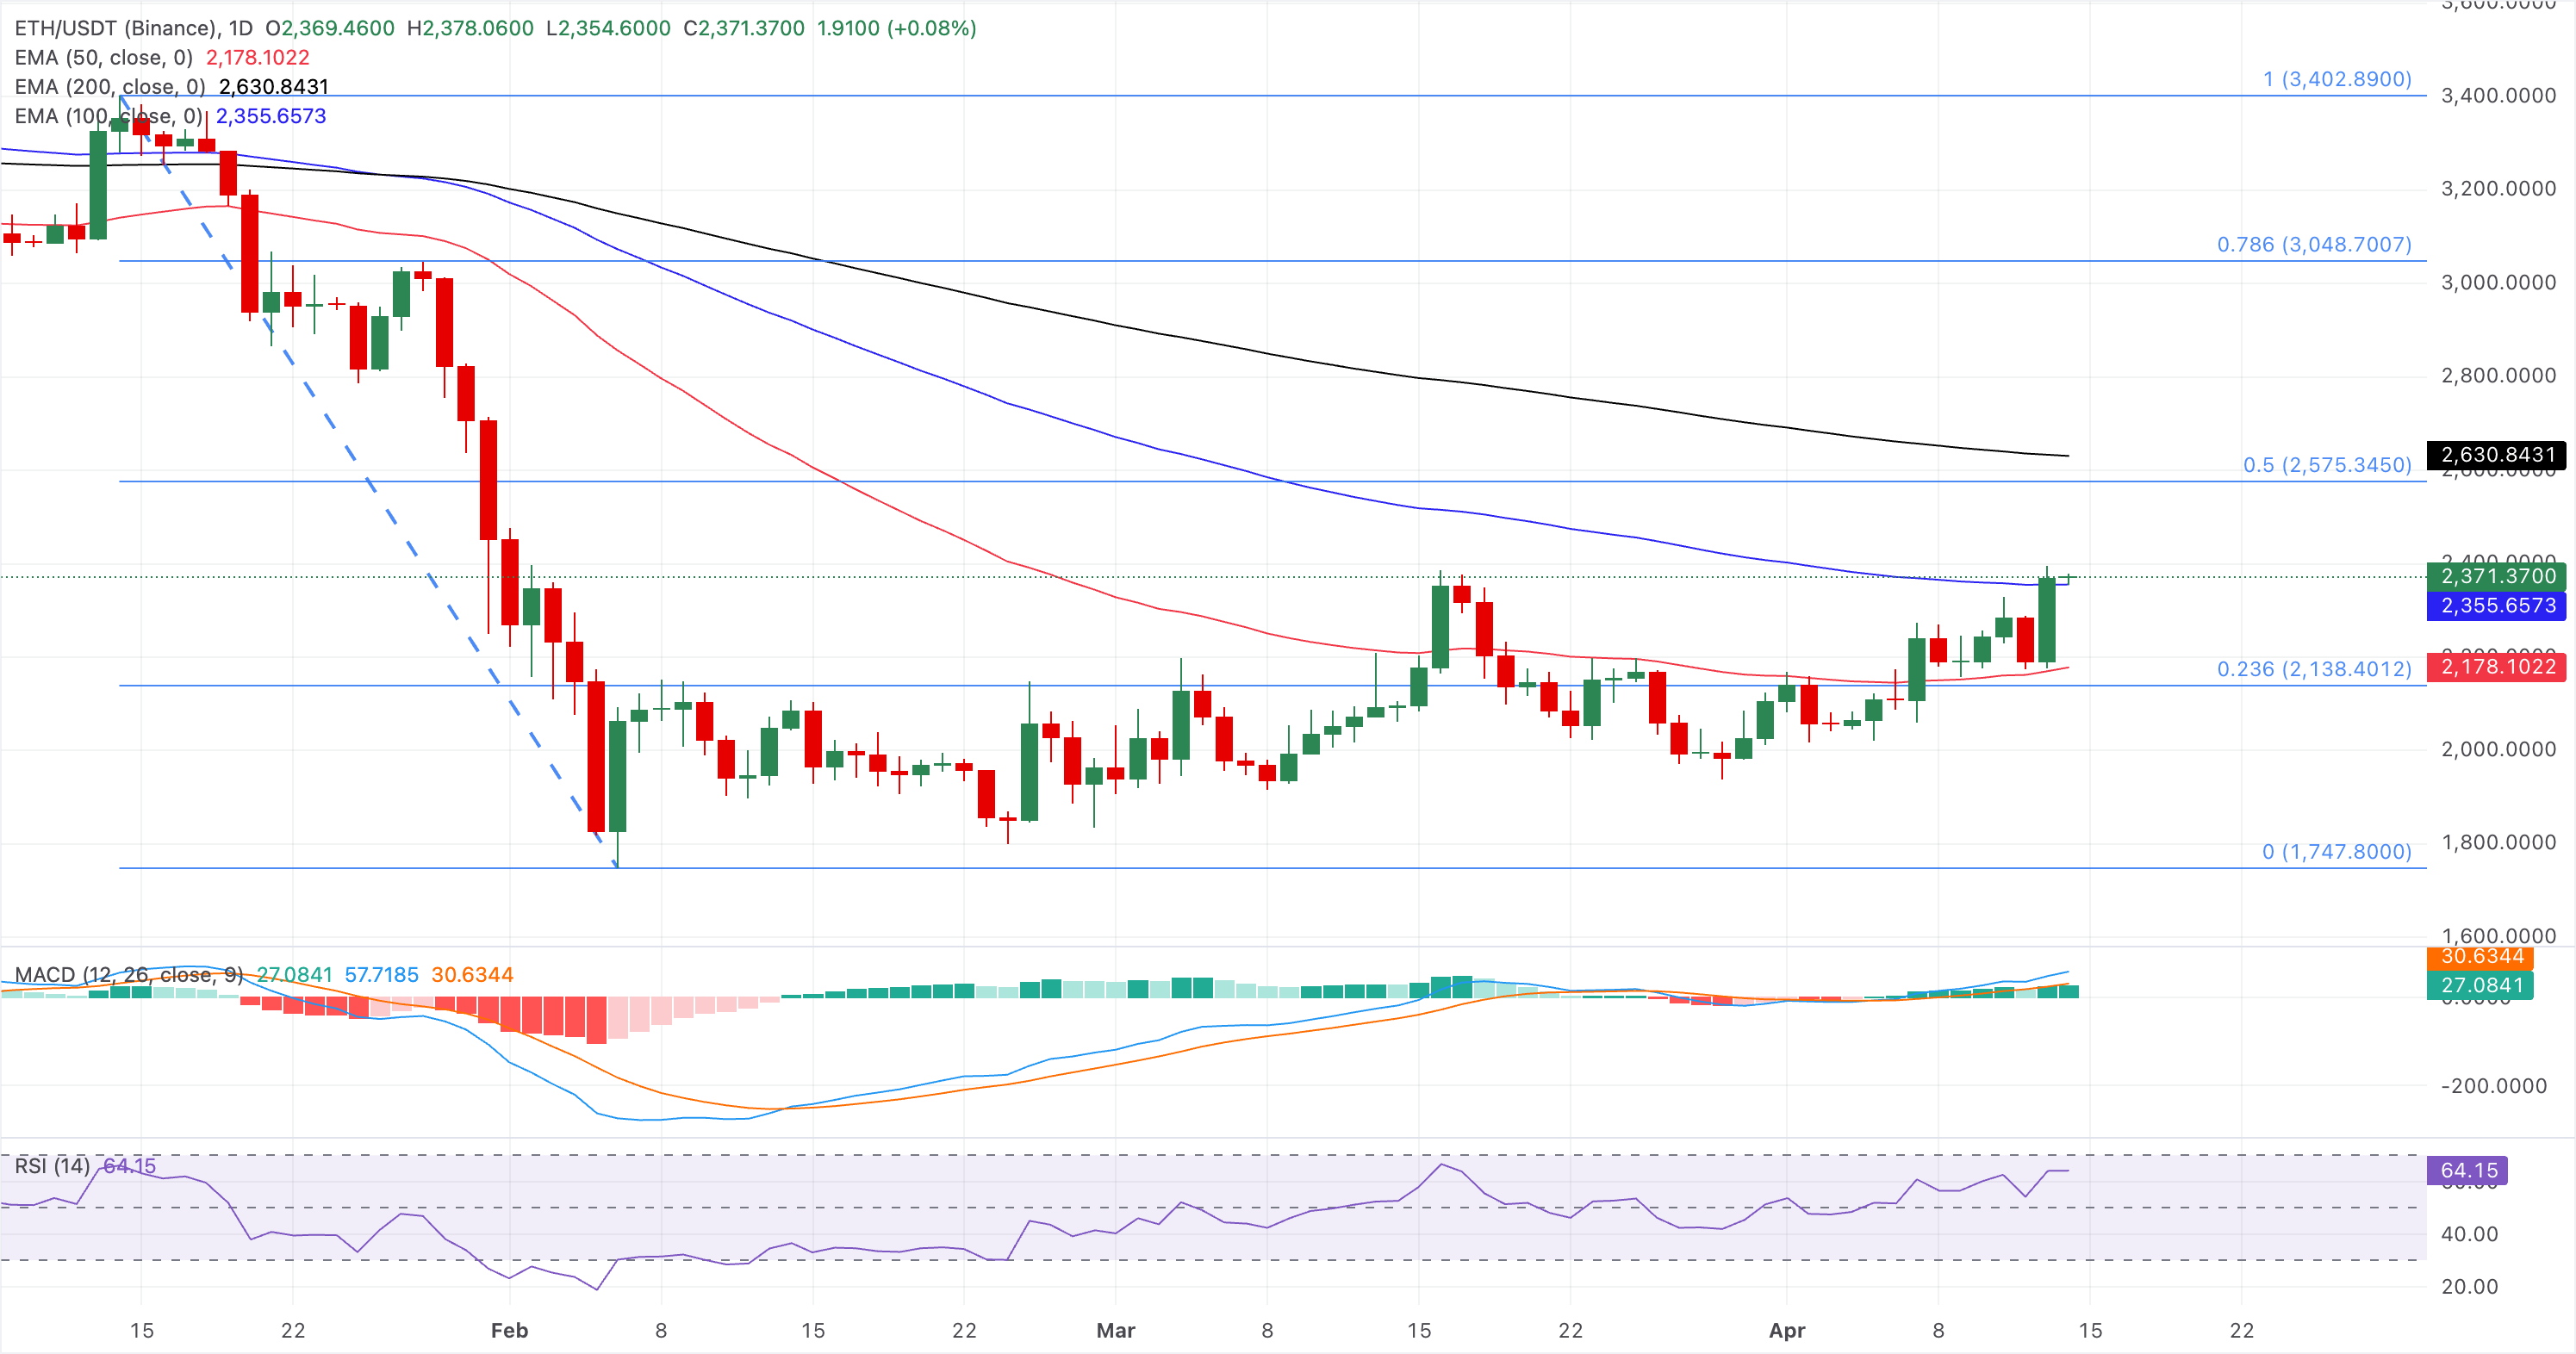
On the downside, initial support is provided by the 100-day EMA at roughly $2,356, ahead of the 50-day EMA near $2,178 and the 23.6% retracement around $2,138, with a deeper pullback toward the prior swing low region near $1,748 only likely if these intermediate floors give way.
(The technical analysis of this story was written with the help of an AI tool.)
Nothing in this material constitutes investment advice, personal recommendation, investment research, an offer, or a solicitation to buy or sell any financial instrument. The content has been prepared without consideration of your individual investment objectives, financial situation, or needs, and should not be treated as such.
Past performance is not a reliable indicator of future performance and/or results. Forward-looking scenarios or forecasts are not a guarantee of future performance. Actual results may differ materially from those anticipated.
Mitrade makes no representation or warranty as to the accuracy or completeness of the information provided and accepts no liability for any loss arising from reliance on such information.
Recommended Articles


