

Crypto Overview: Zcash, Chiliz, and Algorand extend gains as Bitcoin holds above $78,000
- Bitcoin hovers above $78,000 on Friday as the broader cryptocurrency market sentiment holds steady.
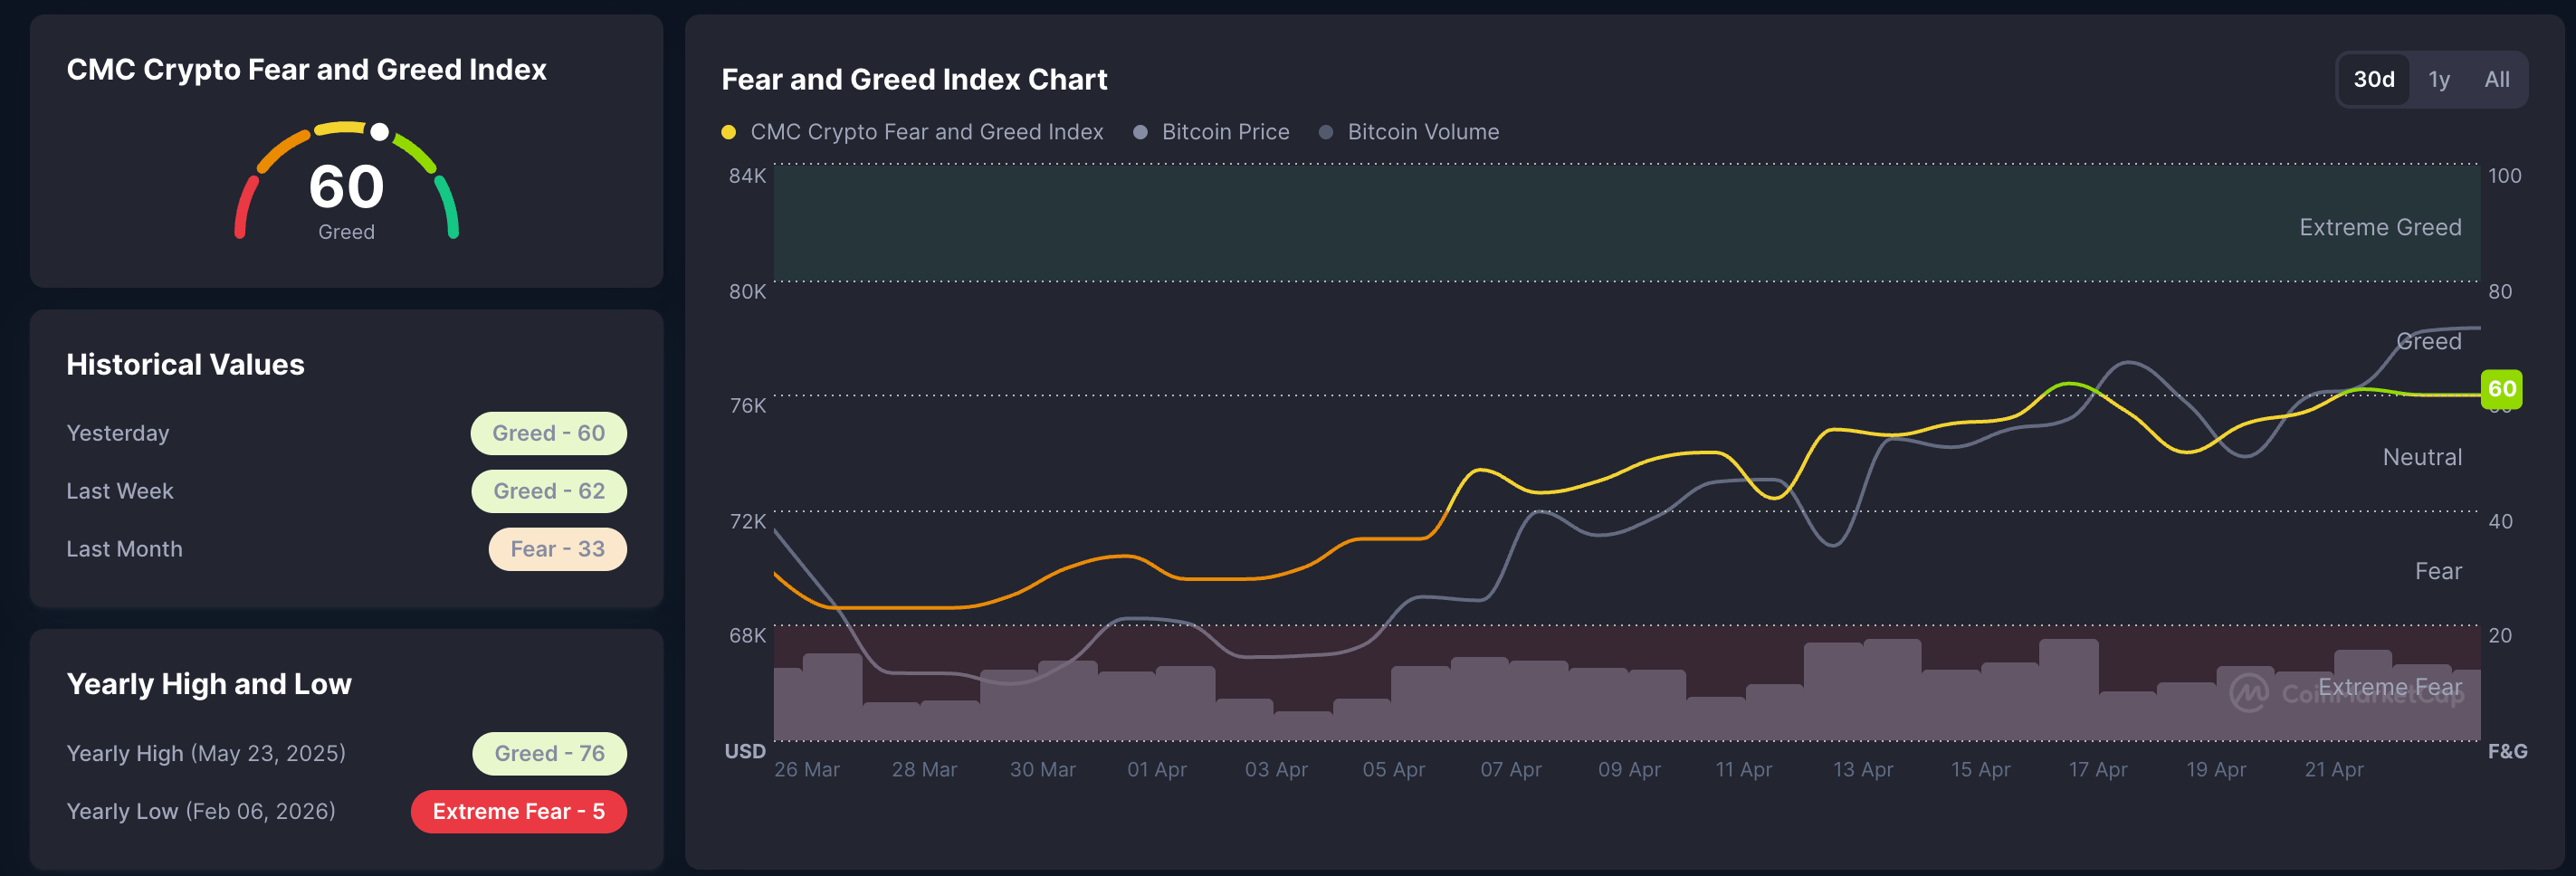
- The Crypto Fear and Greed Index remains at 60, indicating steady risk-on sentiment among investors.
- Zcash, Chiliz, and Algorand are leading gains over the last 24 hours.
The broader cryptocurrency market retains its newfound risk appetite as Bitcoin (BTC) holds above $78,000 on Friday, despite the US-Iran peace negotiations becoming volatile. Meanwhile, Zcash (ZEC), Chiliz (CHZ), and Algorand (ALGO) emerge as top performers over the last 24 hours.
Bitcoin remains resilient amid the US-Iran conflict
Bitcoin is holding above $78,000 at press time on Friday, up roughly 15% so far this month. The strong resilience in BTC's price is backed by institutional and Wall Street adoption, increased M2 liquidity, and the possibility that Iran will use BTC for toll payments across the Strait of Hormuz, as previously reported by FXStreet.
CoinMarketCap’s Crypto Fear and Greed Index remains at 60 on Friday, indicating persistent risk appetite among investors underpinned by Bitcoin’s resilience.
Will Zcash, Chiliz, and Algorand continue to rise?
Zcash trades at $344 at press time on Friday, after an 8% rise the previous day. The privacy coin holds well above both the 50-day Exponential Moving Average (EMA) at $294.01 and the 200-day EMA at $283.87, keeping the broader structure bullish despite the recent pullback from the $375 area.
This positioning above the major EMAs suggests underlying dip-buying interest, while the Relative Strength Index (RSI) around 61 indicates positive but not overextended momentum. However, the Moving Average Convergence Divergence (MACD) approaches the signal line as negative histogram bars contract, hinting that downside momentum has cooled.
The next topside hurdle for ZEC is likely to emerge near the prior swing high, close to the $400 psychological level.
On the downside, initial support is reinforced by the 50-day EMA at $294, ahead of the 200-day EMA near $284, both of which underpin the prevailing uptrend as long as they remain intact.
Chiliz trades above $0.050 at the time of writing on Friday, keeping a constructive bullish bias as price holds above both the 50-day and 200-day EMAs at $0.0407 and $0.0396, respectively. The move has also reclaimed the 50% retracement at $0.0476, turning it into underlying support.
The trend momentum remains strong, with the RSI hovering in overbought territory at 71 and the MACD line holding above the signal line, with expanding histogram bars above the zero line, which together suggest that upside pressure persists even as the rally looks stretched.
On the topside, immediate resistance is seen at the 78.6% Fibonacci retracement at $0.0572, with the prior swing high area around the 100% retracement at $0.0643 acting as a stronger bullish target if buyers extend the advance.
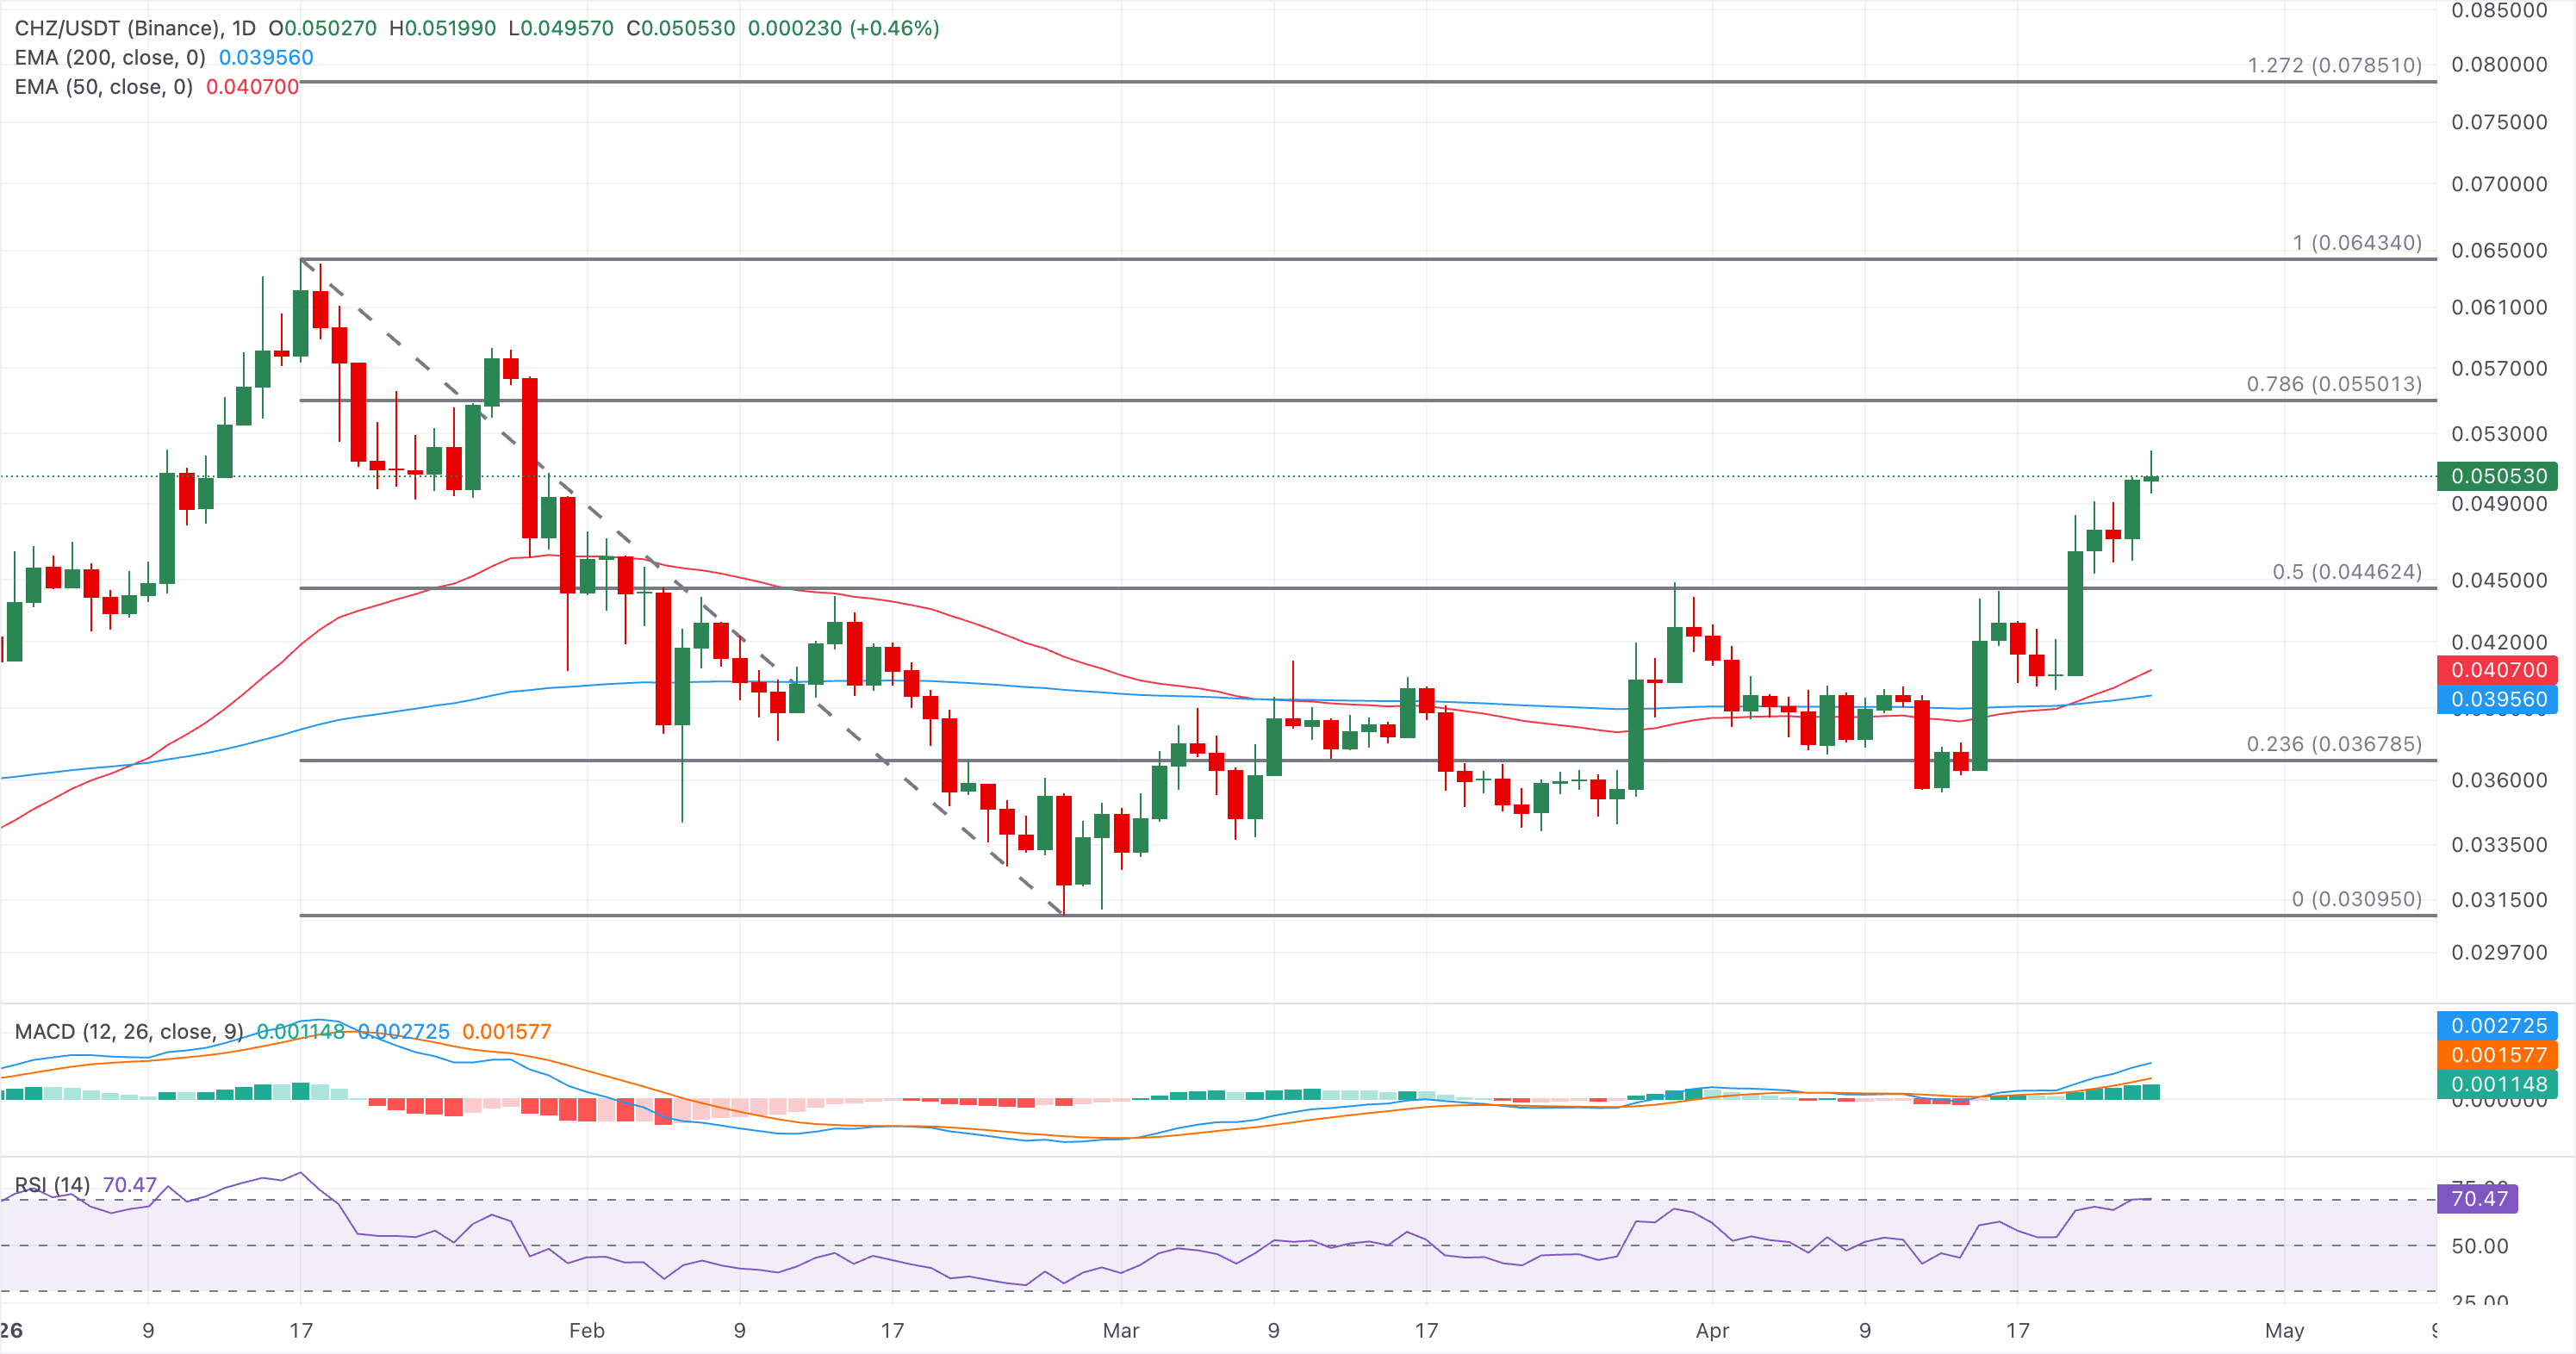
On the downside, initial support is now located at the 50% retracement at $0.0476, ahead of a deeper buffer near the 50-day EMA at $0.0407 and the 200-day EMA at $0.0396.
Algorand holds ground above the $0.1000 psychological level at press time on Friday. The pair holds a neutral-to-slightly-bullish near-term tone as price consolidates above the 50-day EMA at $0.1024 and just over the 38.2% Fibonacci retracement at $0.1055, suggesting emerging downside protection after the recent bounce.
However, the broader structure remains capped while ALGO trades well beneath the 200-day EMA at $0.1285 and under the descending resistance trend line, keeping recovery attempts corrective within a still-dominant higher-timeframe downtrend. The RSI at 52 signals balanced momentum after exiting oversold territory, while the negative MACD histogram suggests bullish momentum is tentative.
On the topside, initial resistance emerges at the 50% retracement at $0.1132, followed by the 78.6% Fibonacci retracement at $0.1317, forming a heavier supply band.
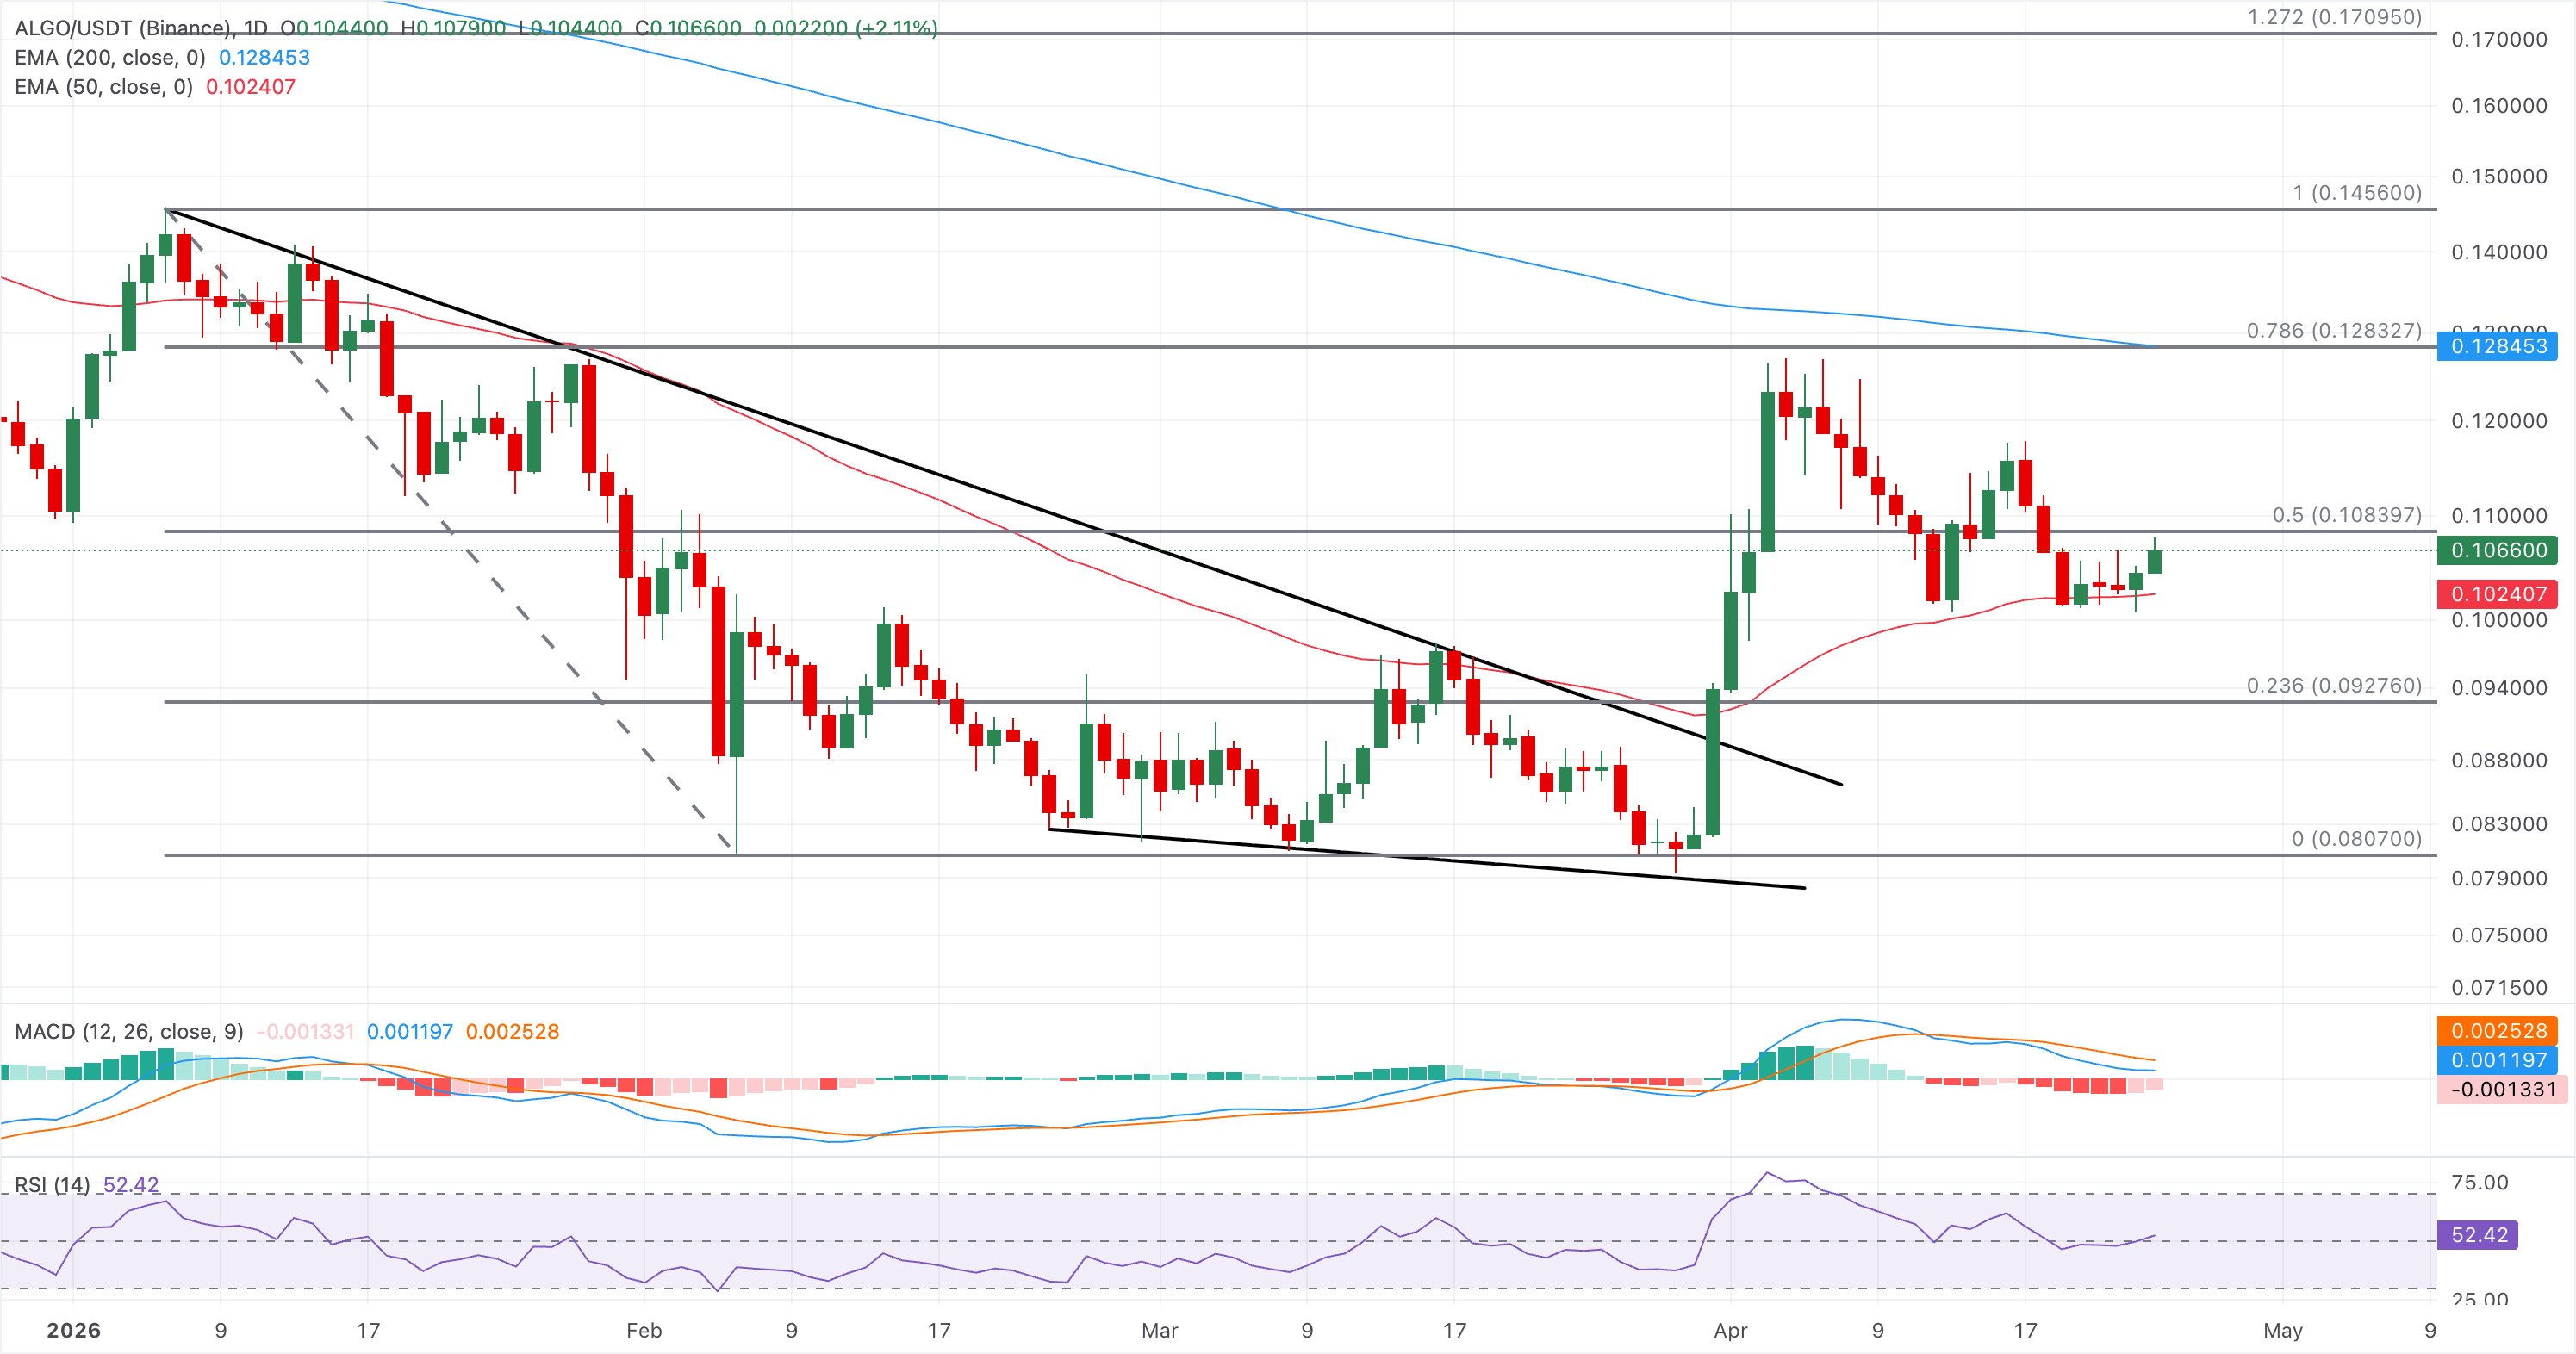
On the downside, immediate support is seen near the 50-day EMA at $0.1024 and the 38.2% Fibonacci retracement at $0.1055.
(The technical analysis of this story was written with the help of an AI tool.)
Nothing in this material constitutes investment advice, personal recommendation, investment research, an offer, or a solicitation to buy or sell any financial instrument. The content has been prepared without consideration of your individual investment objectives, financial situation, or needs, and should not be treated as such.
Past performance is not a reliable indicator of future performance and/or results. Forward-looking scenarios or forecasts are not a guarantee of future performance. Actual results may differ materially from those anticipated.
Mitrade makes no representation or warranty as to the accuracy or completeness of the information provided and accepts no liability for any loss arising from reliance on such information.
Recommended Articles


