



Crypto Overview: Bitcoin flashes further downside below $80,000 – Terra Classic and Toncoin lead decline
- Bitcoin hovers below $80,000 on Thursday after three consecutive days of losses.
- Market sentiment declines as liquidation data indicates a bullish positional wipeout.
- Terra Classic and Toncoin are leading the losses over the last 24 hours.
Bitcoin (BTC) is trading below $80,000 at press time on Thursday, after three straight days of losses so far this week. The crypto market sentiment is losing risk appetite amid a bullish positional wipeout in the derivatives market. Terra Classic (LUNC) and Toncoin (TON) lead the decline over the last 24 hours, extending the pullback after the previous week’s recovery.
Volatility surge weighs down crypto bulls
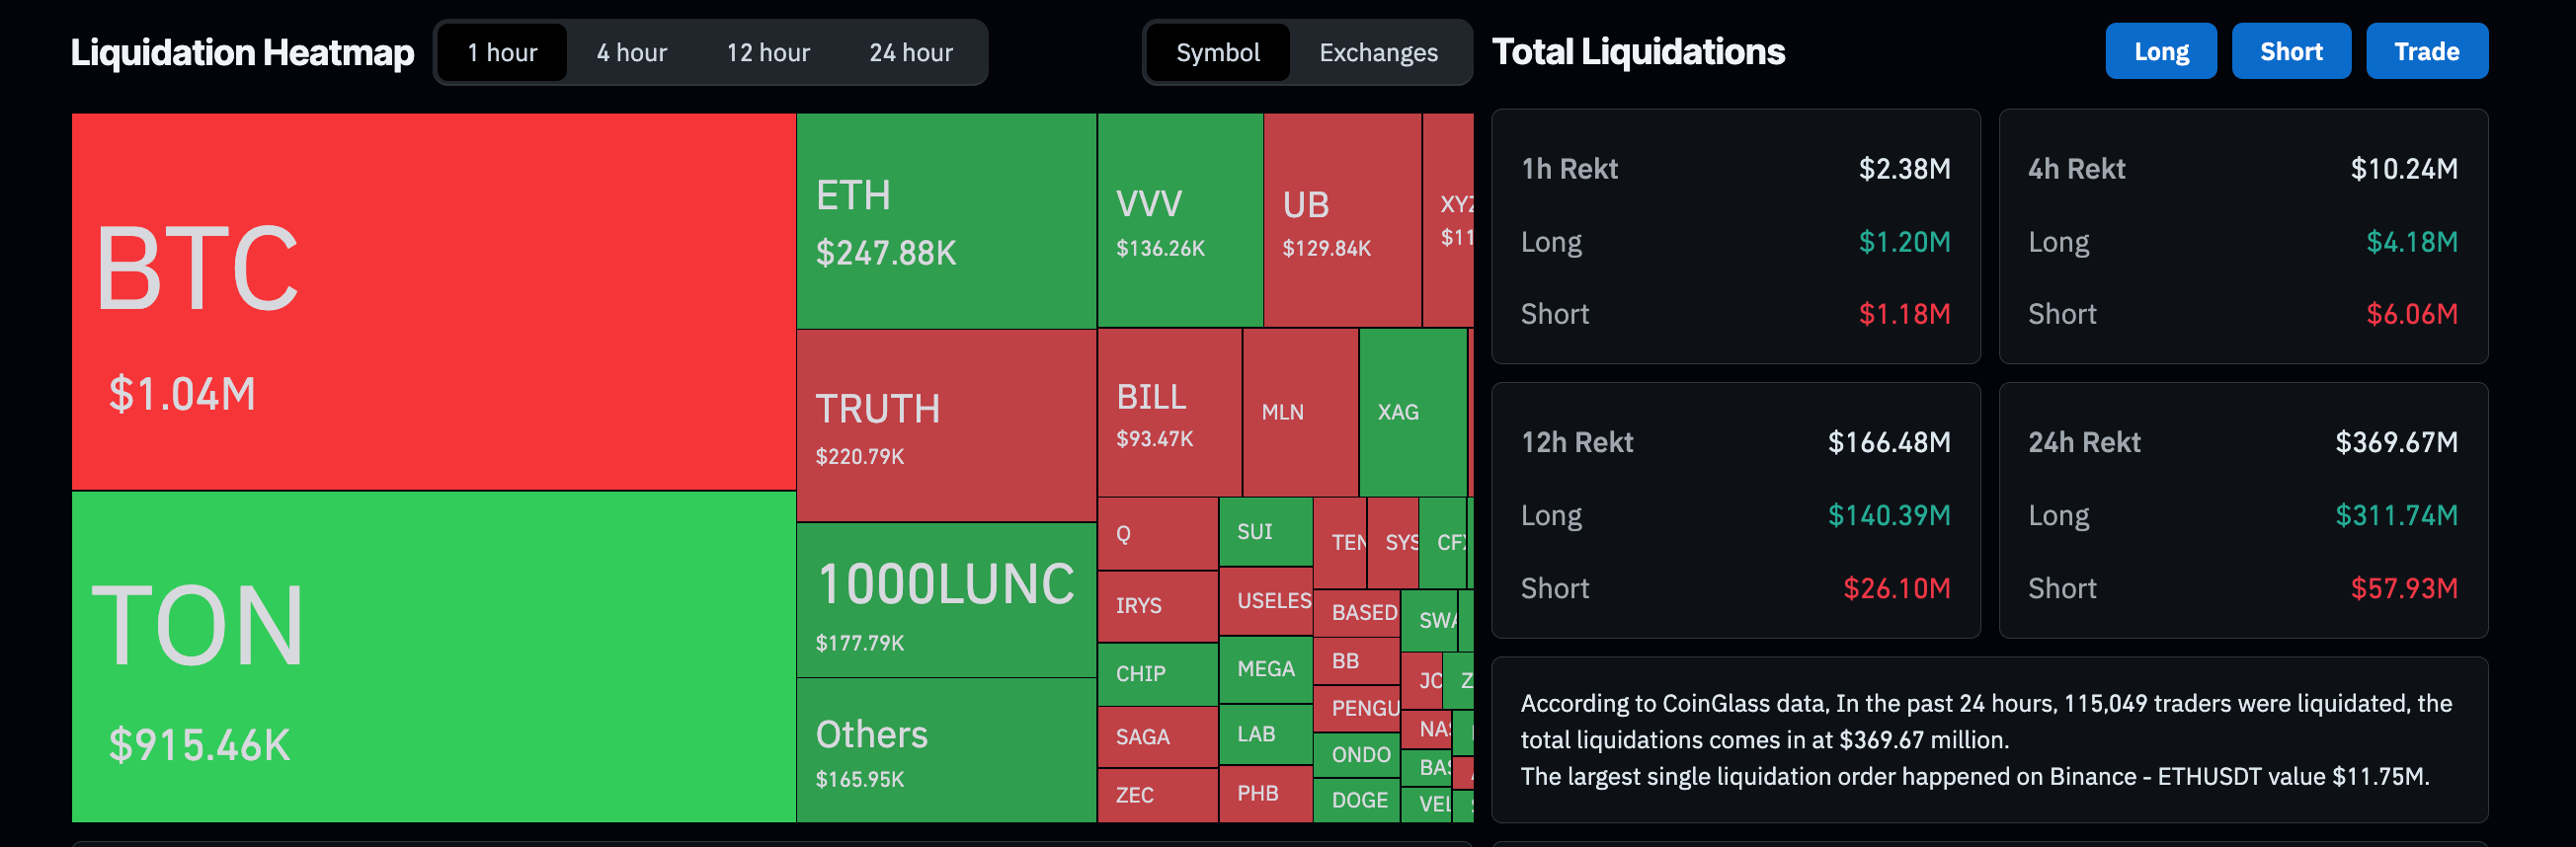
Bitcoin’s pullback below $80,000 triggered forced liquidations of highly leveraged bullish positions in the futures market, prompting a risk-off sentiment shift. CoinGlass data shows that total liquidations over the last 24 hours amount to roughly $370 million, led by $311 million in long liquidations. The largest liquidation in the same period occurred on the ETH-USDT trading pair on Binance, totaling $11.75 million.
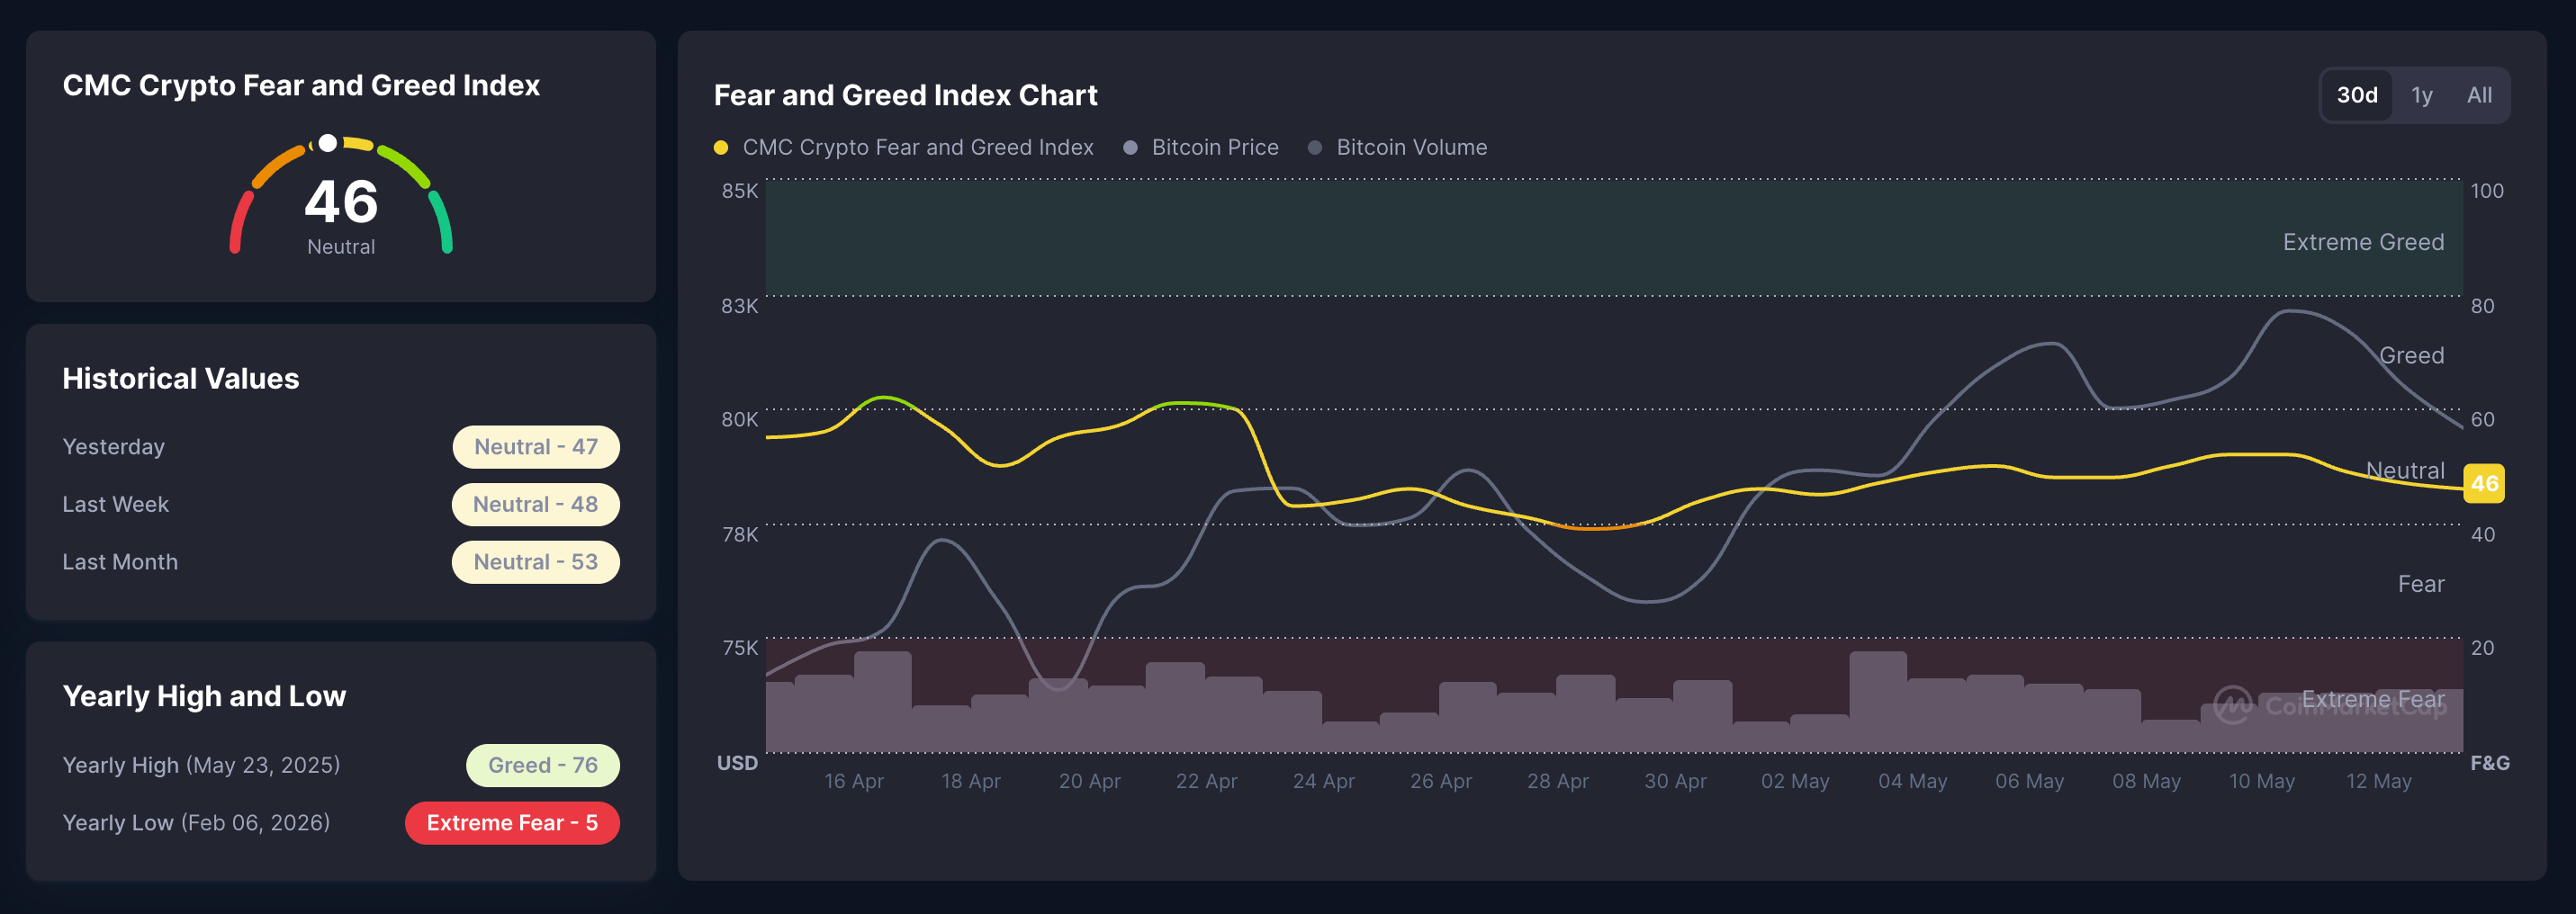
On the other hand, CoinMarketCap’s Crypto Fear and Greed Index is at 46, down from 52 on Monday, indicating that the sentiment is gradually shifting bearish.
Bitcoin recovery flips below $80,000
Bitcoin trades below $80,000 on Thursday but maintains a broadly constructive bias, holding well above the 50-day and 100-day Exponential Moving Averages (EMAs) at roughly $76,474 and $76,778, respectively. This placement suggests the broader uptrend remains intact, even as the Moving Average Convergence Divergence (MACD) line sits below its signal line after a crossover on Tuesday, hinting at a downside-flipped momentum, while the Relative Strength Index (RSI) around 55 still leans slightly in favor of buyers.
On the downside, immediate dynamic support is provided first by the 100-day EMA at $76,778, then by the 50-day EMA at $76,474, with the longer-term rising trendline break area around $70,051 coming into play only if sellers force a deeper correction.
On the topside, initial resistance emerges at the 200-day EMA near $81,842, where a daily close above would reopen the path toward fresh highs.
Could Luna Classic and Toncoin extend their losses?
Terra Classic is down over 3% at press time on Thursday, extending the decline for the third straight day. LUNC hovers above the 50-, 100-, and 200-period EMAs, which cluster into a tight pivot zone and leave the near-term tone broadly neutral.
Price action is consolidating after prior gains, while the RSI at 50 has eased back to the neutral zone, hinting at waning bullish momentum and a market that is pausing rather than trending.
The key support for LUNC lies at $0.000072, marked by the March 2 high, which serves as a resistance-turned-support level.
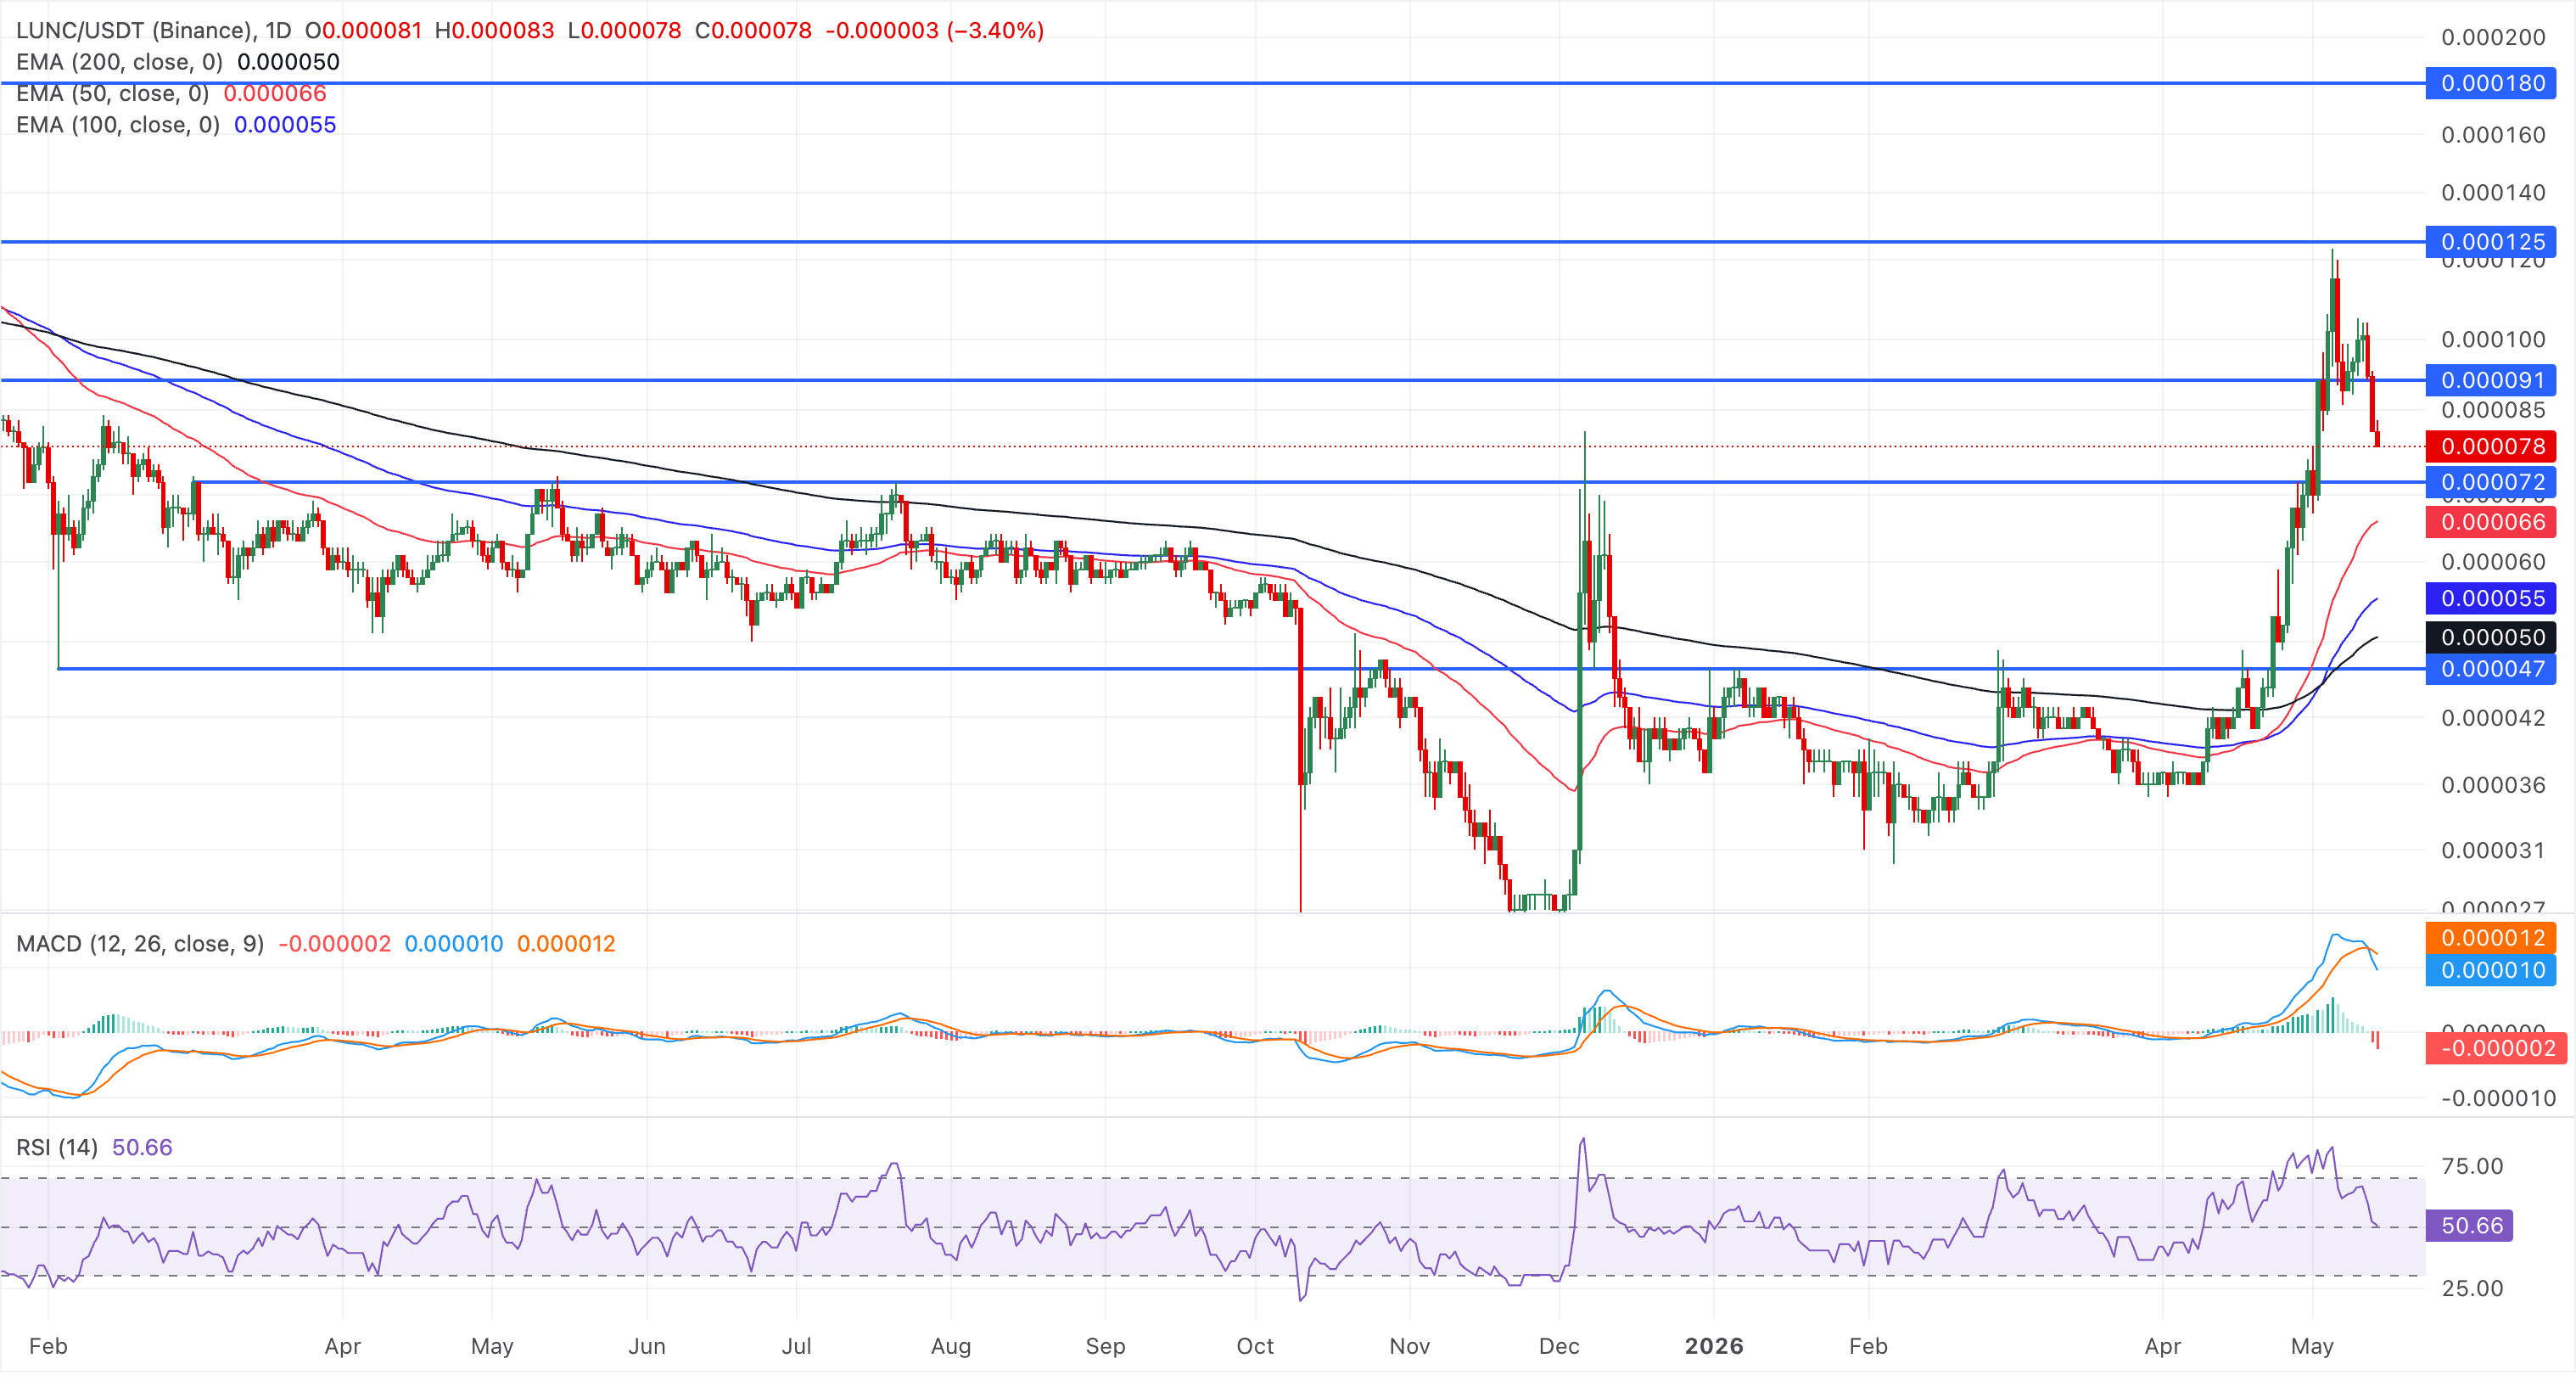
Looking up, a rebound in LUNC could retest the supply zone near the $0.000100 psychological threshold.
Toncoin holds above $2.00 at the time of writing on Thursday, trending lower for the fourth consecutive day this week. TON retains a largely constructive bullish bias despite the short-term decline, as price remains well above the 50-day, 100-day, and 200-day EMAs, which are clustered between roughly $1.57 and $1.75. The slope of these EMAs still points higher, suggesting the broader uptrend remains intact even as momentum cools.
The RSI at 59 is retreating from prior overbought readings while the MACD histograms flipped negative after a crossover on Monday.
The immediate support for TON lies at the $2.00 round figure, followed by the 200-day EMA near $1.75, offering the first notable layer of dynamic support, ahead of the 50-day EMA around $1.67 and the 100-day EMA close to $1.57.
On the upside, a rebound above $2.00 could retest the $2.37 resistance level, followed by the $2.89 ceiling, which capped the previous week's recovery on May 7.
(The technical analysis of this story was written with the help of an AI tool.)
Nothing in this material constitutes investment advice, personal recommendation, investment research, an offer, or a solicitation to buy or sell any financial instrument. The content has been prepared without consideration of your individual investment objectives, financial situation, or needs, and should not be treated as such.
Past performance is not a reliable indicator of future performance and/or results. Forward-looking scenarios or forecasts are not a guarantee of future performance. Actual results may differ materially from those anticipated.
Mitrade makes no representation or warranty as to the accuracy or completeness of the information provided and accepts no liability for any loss arising from reliance on such information.
Recommended Articles


