



Chainlink Price Forecast: LINK holds key support as on-chain and ETF demand strengthen
- Chainlink is near the key support zone around $9.91 on Thursday after correcting nearly 5% so far this week.
- On-chain data backs the bullish bias, with social dominance rising and trading volume increasing, indicating renewed market participation.
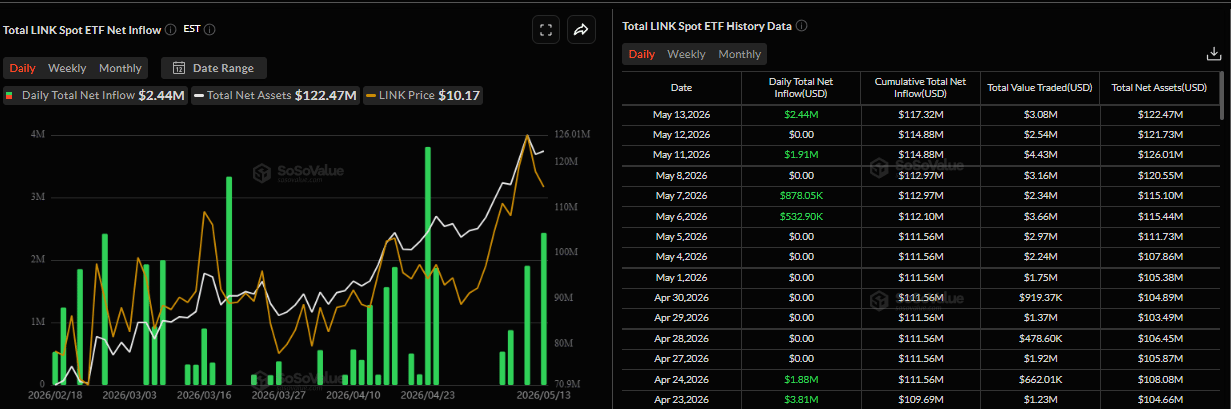
- US-listed spot ETFs recorded inflows of $2.22 million on Wednesday, signaling growing institutional demand.
Chainlink (LINK) is slipping toward the key support around $9.91 on Thursday after declining nearly 5% so far this week. Despite the recent pullback, improving on-chain metrics, with rising social dominance and trading volume, suggest bullish sentiment may be building for LINK. In addition, steady inflows into US-listed spot LINK Exchange Traded Funds (ETFs) signal growing institutional interest in LINK.
On-chain data supports a recovery ahead
Santiment’s Social Dominance metric for Chainlink supports a bullish outlook. The index measures the share of LINK-related discussions across the cryptocurrency media. The metric is in an upward trend, reading 0.232% on Thursday, reaching a new yearly high and levels not seen since November 2025, as shown in the chart below. This rise indicates growing market interest and sentiment among LINK investors.
 [08-1778730923451-1778730923452.14.52, 14 May, 2026].png)
In addition, the Chainlink ecosystem’s trading volume (the aggregate trading volume generated by all exchange applications on the chain) reached $741.06 million on Thursday, rising steadily since the end of April. This volume rise indicates a surge in traders’ interest and liquidity in LINK, boosting its bullish outlook.
 [08-1778730969734-1778730969735.23.55, 14 May, 2026].png)
Growing institutional demand
SoSoValue data shows that spot LINK ETFs recorded inflows of $2.44 million on Wednesday, after $1.91 million on Monday. If this inflow trend continues and intensifies this week, LINK could see a price surge.
Moreover, on Wednesday, Chainlink’s X post announced that Fidelity International, a global asset manager with $1+ trillion total client assets, launched FILQ, its first tokenized fund powered by Chainlink.
“Through onchain NAV, Chainlink is enabling Fidelity International to bring regulated yield-bearing liquidity into a 24/7 digital market,” said Chainlink X post.
This highlights a bullish outlook for Chainlink for the long term, as it indicates growing institutional adoption of blockchain infrastructure.
Chainlink Price Forecast: LINK could recover if key support holds
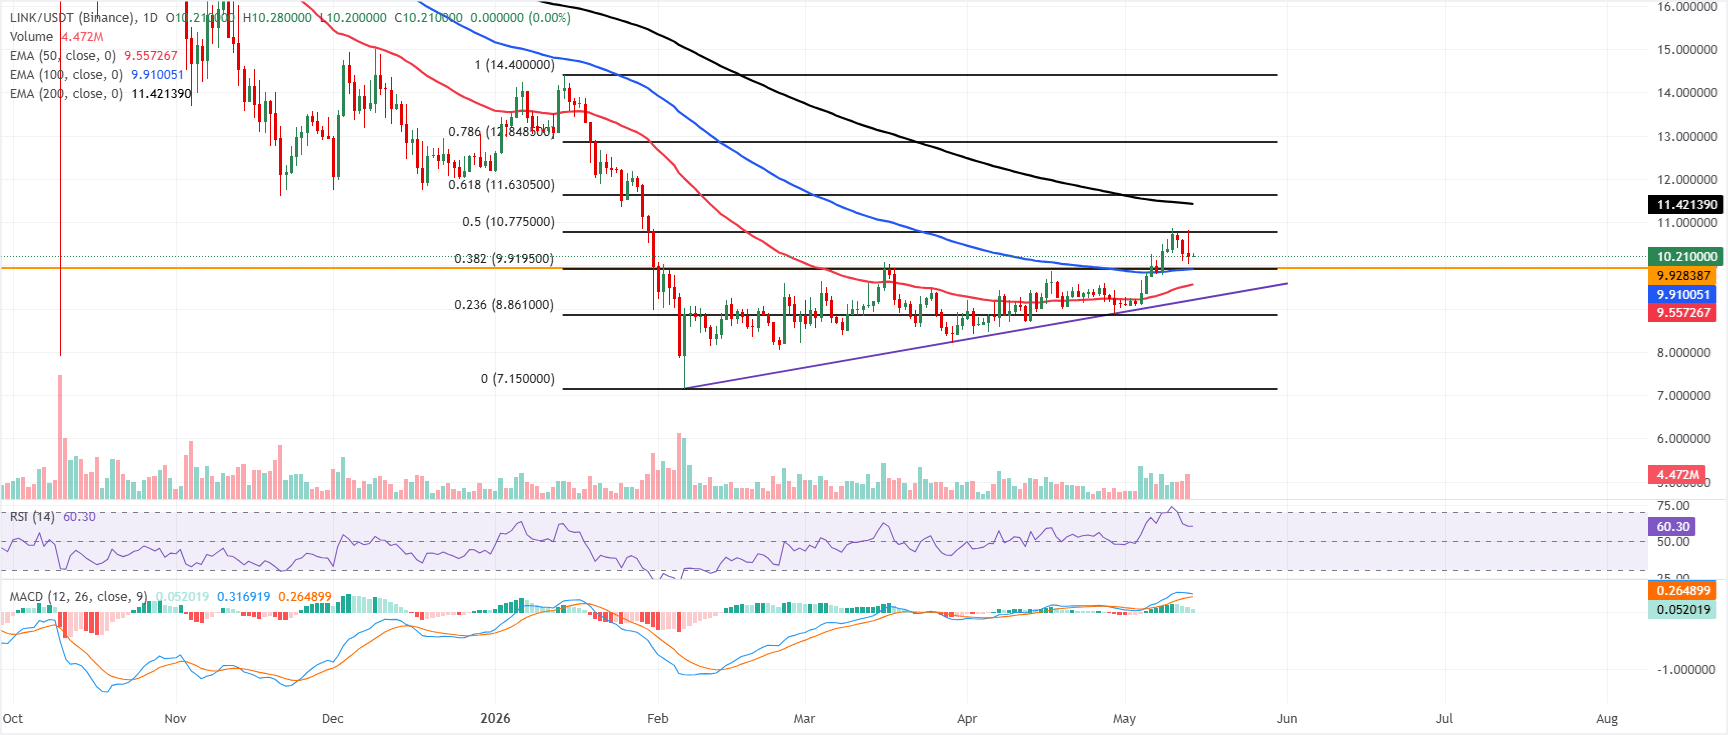
Chainlink trades at $10.22 on Thursday, maintaining a constructive bullish tone as it holds above the clustered mid-term supports while still trading below the longer-term Exponential Moving Average (EMA). The 100-day EMA around $9.91 and the 50-day EMA near $9.55 sit comfortably beneath the spot, reinforcing the recent breakout from the rising trendline that was last intersecting near $9.20.
Momentum remains supportive, with the Relative Strength Index (RSI) hovering just above 60 and the Moving Average Convergence Divergence (MACD) line still in positive territory, though its recent pullback hints at a moderated, rather than explosive, upside bias.
On the downside, initial demand emerges in a dense band around $9.93–$9.91, where a horizontal support at $9.93 aligns closely with the 38.2% Fibonacci retracement at $9.92 and the 100-day EMA, ahead of the 50-day EMA at about $9.56 and the prior trendline break zone near $9.20; a loss of this broader area would expose deeper retracement toward the 23.6% Fibonacci level at $8.86.
On the topside, bulls now face initial resistance at the 50% Fibonacci retracement near $10.78, with the 200-day EMA around $11.42 and the 61.8% retracement at $11.63 forming a higher supply zone that must be cleared to extend the prevailing advance.
(The technical analysis of this story was written with the help of an AI tool.)
Nothing in this material constitutes investment advice, personal recommendation, investment research, an offer, or a solicitation to buy or sell any financial instrument. The content has been prepared without consideration of your individual investment objectives, financial situation, or needs, and should not be treated as such.
Past performance is not a reliable indicator of future performance and/or results. Forward-looking scenarios or forecasts are not a guarantee of future performance. Actual results may differ materially from those anticipated.
Mitrade makes no representation or warranty as to the accuracy or completeness of the information provided and accepts no liability for any loss arising from reliance on such information.
Recommended Articles


