



Cardano Price Forecast: Bears in control of the momentum hint at further losses
- Cardano price trades below $0.260 on Monday after falling over 10% in the previous week.
- Mixed sentiment in the derivatives markets caps ADA recovery.
- On-chain data supports a bearish outlook, with falling social dominance and declining daily active addresses.
Cardano (ADA) remains under pressure, trading below $0.260 on Monday after correcting over 10% in the previous week. Mixed derivatives metrics and weakening on-chain data support a bearish outlook, hinting at a deeper correction for ADA.
Mixed derivatives metrics cap ADA recovery
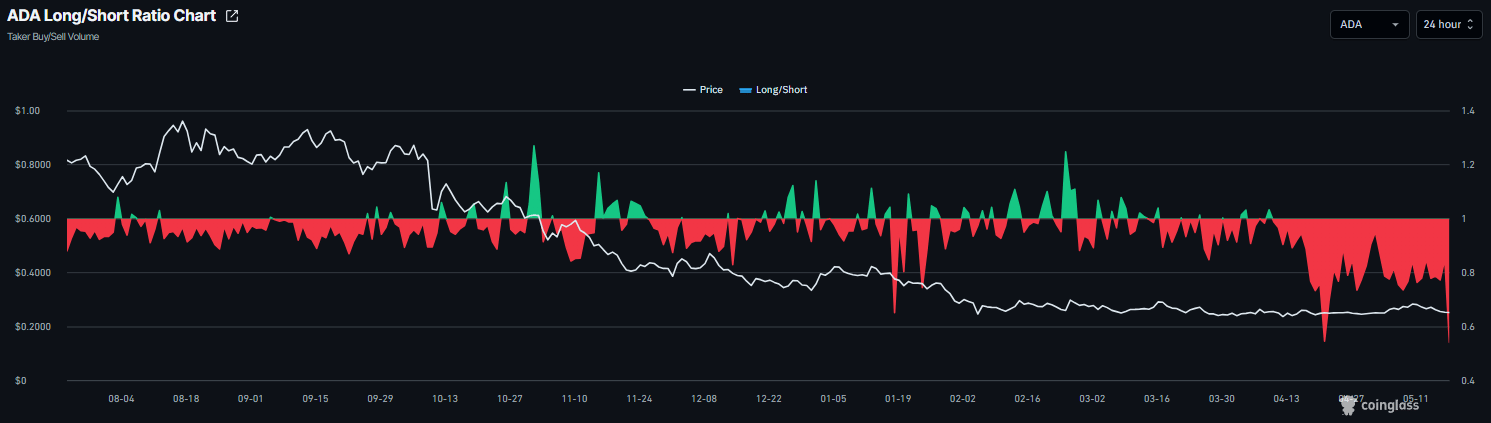
Cardano’s derivatives data show mixed signals, keeping the outlook cautious. CoinGlass’ long-to-short ratio for ADA reads 0.54 on Monday, the lowest level over a month. This ratio, being below one, reflects bearish sentiment in the market, as more traders are betting on the asset’s price to fall.
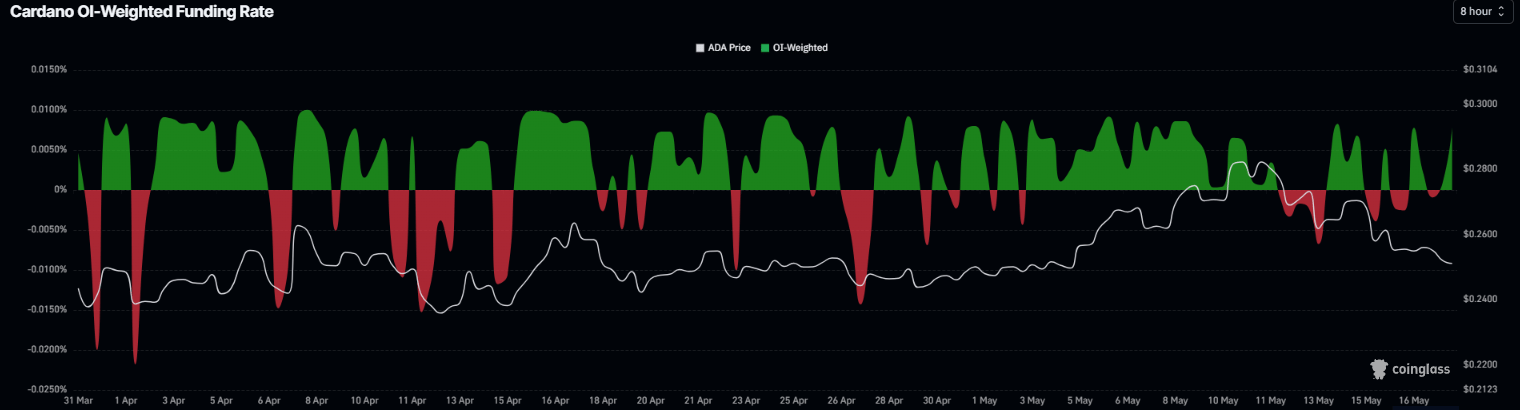
Meanwhile, the funding rates support improving sentiment. CoinGlass’ OI-Weighted Funding Rate data for Cardano flipped positive on Sunday and read 0.0078% on Monday. This positive rate indicates that longs are paying shorts and projecting a mild bullish sentiment.
This combination of derivatives metrics suggests indecision among Cardano investors and a lack of clear directional bias, which limits the likelihood of a sustained recovery.
On-chain data support a bearish bias
Santiment’s Social Dominance metric for Cardano supports a bearish outlook. The index measures the share of ADA-related discussions across the cryptocurrency media. The metric is in a downward trend, reading 0.009 on Monday, the lowest level over a year, as shown in the chart below. This fall indicates fading market interest and sentiment among ADA investors.
 [09-1779076735285.11.17, 18 May, 2026].png)
In addition, Santiment’s Daily Active Addresses index, which tracks network activity over time, also paints a bearish picture for Cardano. The metric has been steadily declining for a month and stands at 12,800 on Monday. This indicates that demand for ADA’s blockchain usage is decreasing, which doesn’t bode well for Cardano’s price.
 [08-1779076756136.49.07, 18 May, 2026].png)
Cardano Price Forecast: Momentum indicators show bearish outlook
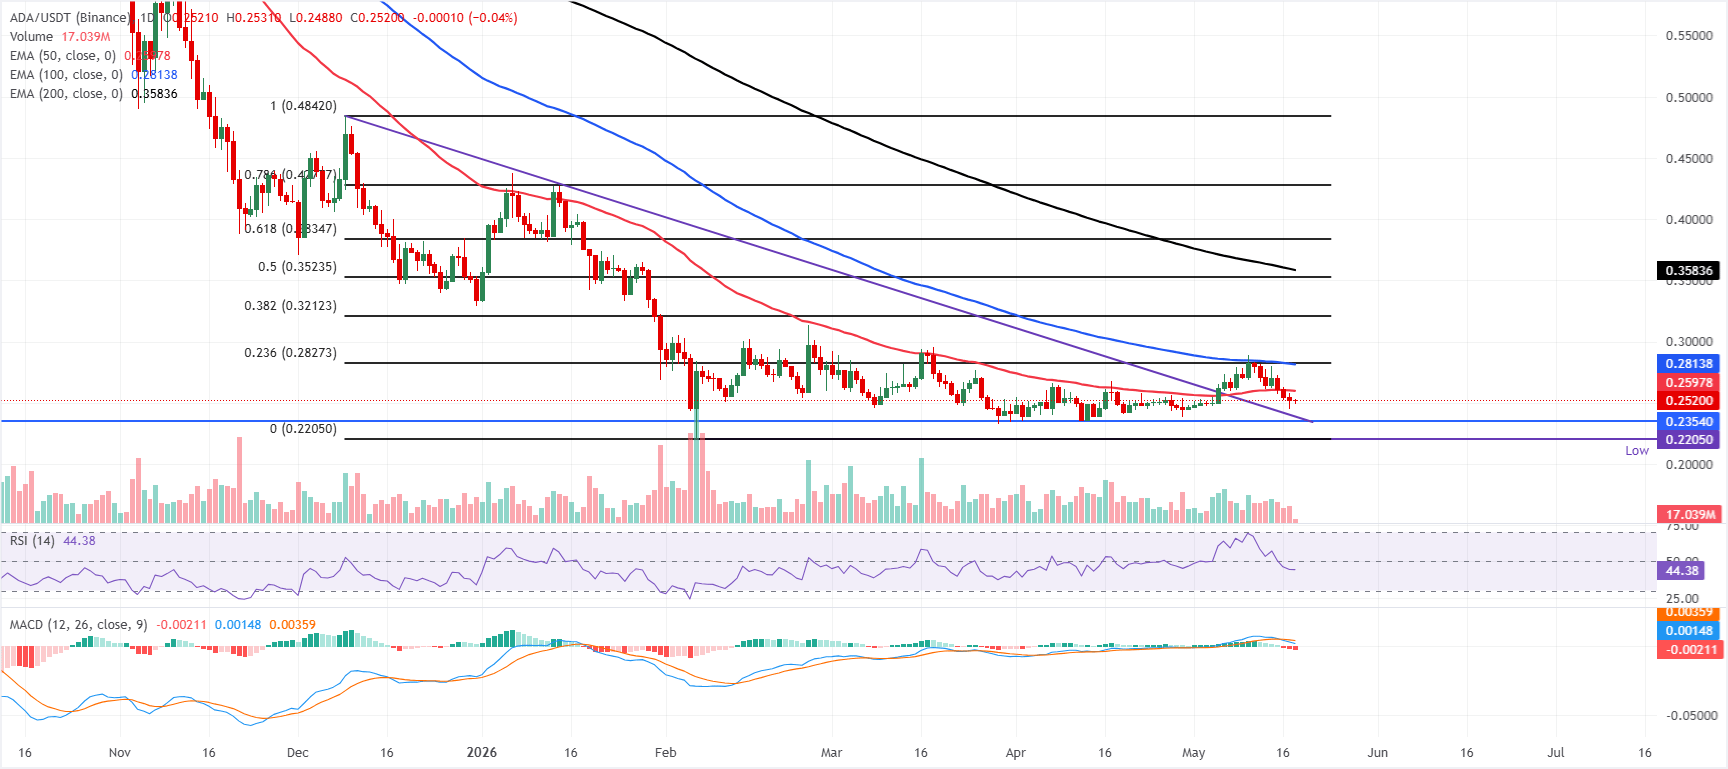
Cardano trades below $0.260 on Monday, following losses of over 10% in the previous week. ADA is maintaining a bearish near-term tone as price holds below the 50-day, 100-day, and 200-day Exponential Moving Averages (EMAs) at $0.259, $0.281, and $0.358, respectively.
The failure to sustain the recent bounce has left ADA consolidating just above the former trendline resistance-turned-support near $0.238. At the same time, the Relative Strength Index (RSI) hovers around 44, and the Moving Average Convergence Divergence (MACD) remains below zero, both suggesting that upside momentum remains subdued.
On the topside, initial resistance is located at the 50-day EMA around $0.259, with a stronger cap emerging between the 100-day EMA at $0.281 and the 23.6% Fibonacci retracement of the $0.220–$0.484 downswing at $0.282. Above that zone, subsequent hurdles align at the 38.2% retracement near $0.321, the 50% retracement at $0.352, and the 200-day EMA at $0.358.
On the downside, immediate support lies at the trendline break level around $0.238, followed by the horizontal floor at $0.235; a decisive drop below these levels would expose the cycle low near $0.220.
(The technical analysis of this story was written with the help of an AI tool.)
Nothing in this material constitutes investment advice, personal recommendation, investment research, an offer, or a solicitation to buy or sell any financial instrument. The content has been prepared without consideration of your individual investment objectives, financial situation, or needs, and should not be treated as such.
Past performance is not a reliable indicator of future performance and/or results. Forward-looking scenarios or forecasts are not a guarantee of future performance. Actual results may differ materially from those anticipated.
Mitrade makes no representation or warranty as to the accuracy or completeness of the information provided and accepts no liability for any loss arising from reliance on such information.
Recommended Articles


