



Crypto Overview: Bitcoin loses $74,000 amid Donald Trump's promise to never let crypto down
- Bitcoin hovers below $74,000 on Thursday, extending its third consecutive day of losses.
- US President Donald Trump addresses crypto again, focusing on future-proofing the CLARITY Act.
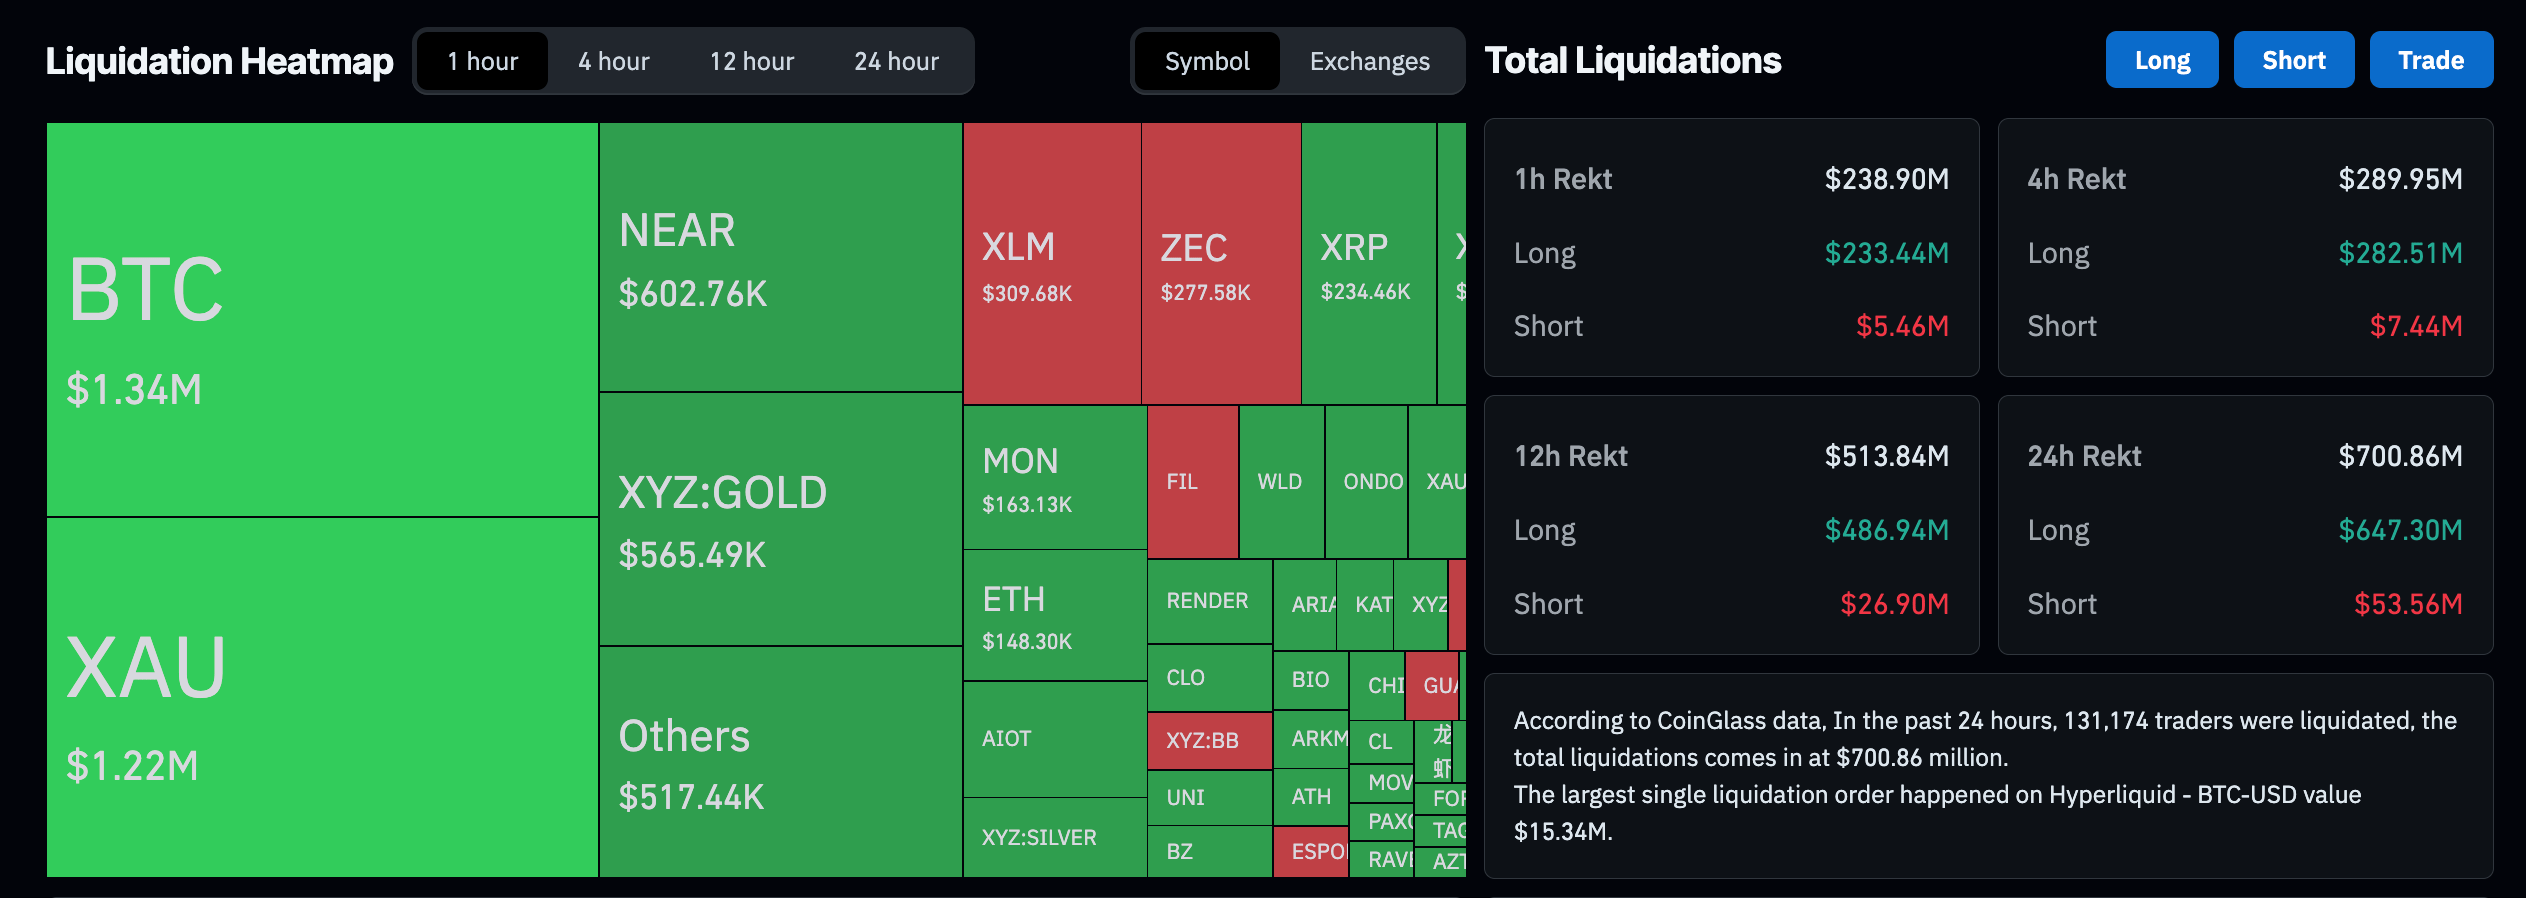
- Stellar emerges as the top performer over the last 24 hours, while the broader market records $700 million in liquidations.
Bitcoin (BTC) hovers below $74,000 at press time on Thursday, extending its third consecutive day of loss. US President Donald Trump addresses the growing pressure on crypto and focuses on future-proofing the market structure with the Digital Asset Market Clarity (CLARITY) Act.
Bitcoin’s pullback triggered $700 million in long liquidations in 24 hours, while Stellar (XLM) emerges as a bullish outlier, rising on its Depository Trust & Clearing Corporation (DTCC) partnership.
Trump’s promise to “never let crypto down”
Donald Trump shared a social media post on Thursday, boasting that the US is the new crypto capital of the world and that it is seeing the return of entrepreneurs under his leadership. Trump further added, “We will codify a FUTURE-PROOF Digital Asset Market Structure that cannot be undone by the Crypto Haters. The new Frontier of Finance is being built in America, and “TRUMP” will NEVER let Crypto down.” Trump addresses the crypto market as the CLARITY Act awaits a full Senate floor vote, which will require at least 60 votes for passage.

Crypto liquidation hits $700 million
A sudden surge in liquidation generally reflects increased market volatility, often marked by the biased wipeout of long or short positions. The total cryptocurrency market liquidation reached $700 million over the last 24 hours, driven by $647 million in long liquidations, at press time. This reflects a largely bullish wipeout, implying a sell-side dominance as Bitcoin loses ground.
Bitcoin risks further decline to $70,000
Bitcoin edges below $74,000 at press time on Thursday, maintaining a bearish near-term bias as it holds below the 50-day and 100-day Exponential Moving Averages (EMAs) at roughly $76,548 and $76,933, respectively, while the 200-day EMA, higher up near $82,766, keeps the broader structure capped.
Momentum signals reinforce the downside tone, with the Relative Strength Index (RSI) hovering around 37 and Moving Average Convergence Divergence (MACD) in negative territory, both suggesting persistent selling pressure despite the pair trading above a reclaimed trend-line support zone.
On the downside, initial support is seen near the April 19 low of $73,762, followed by a rising trendline near $71,700. A sustained break below this floor would open the way for deeper corrective losses.
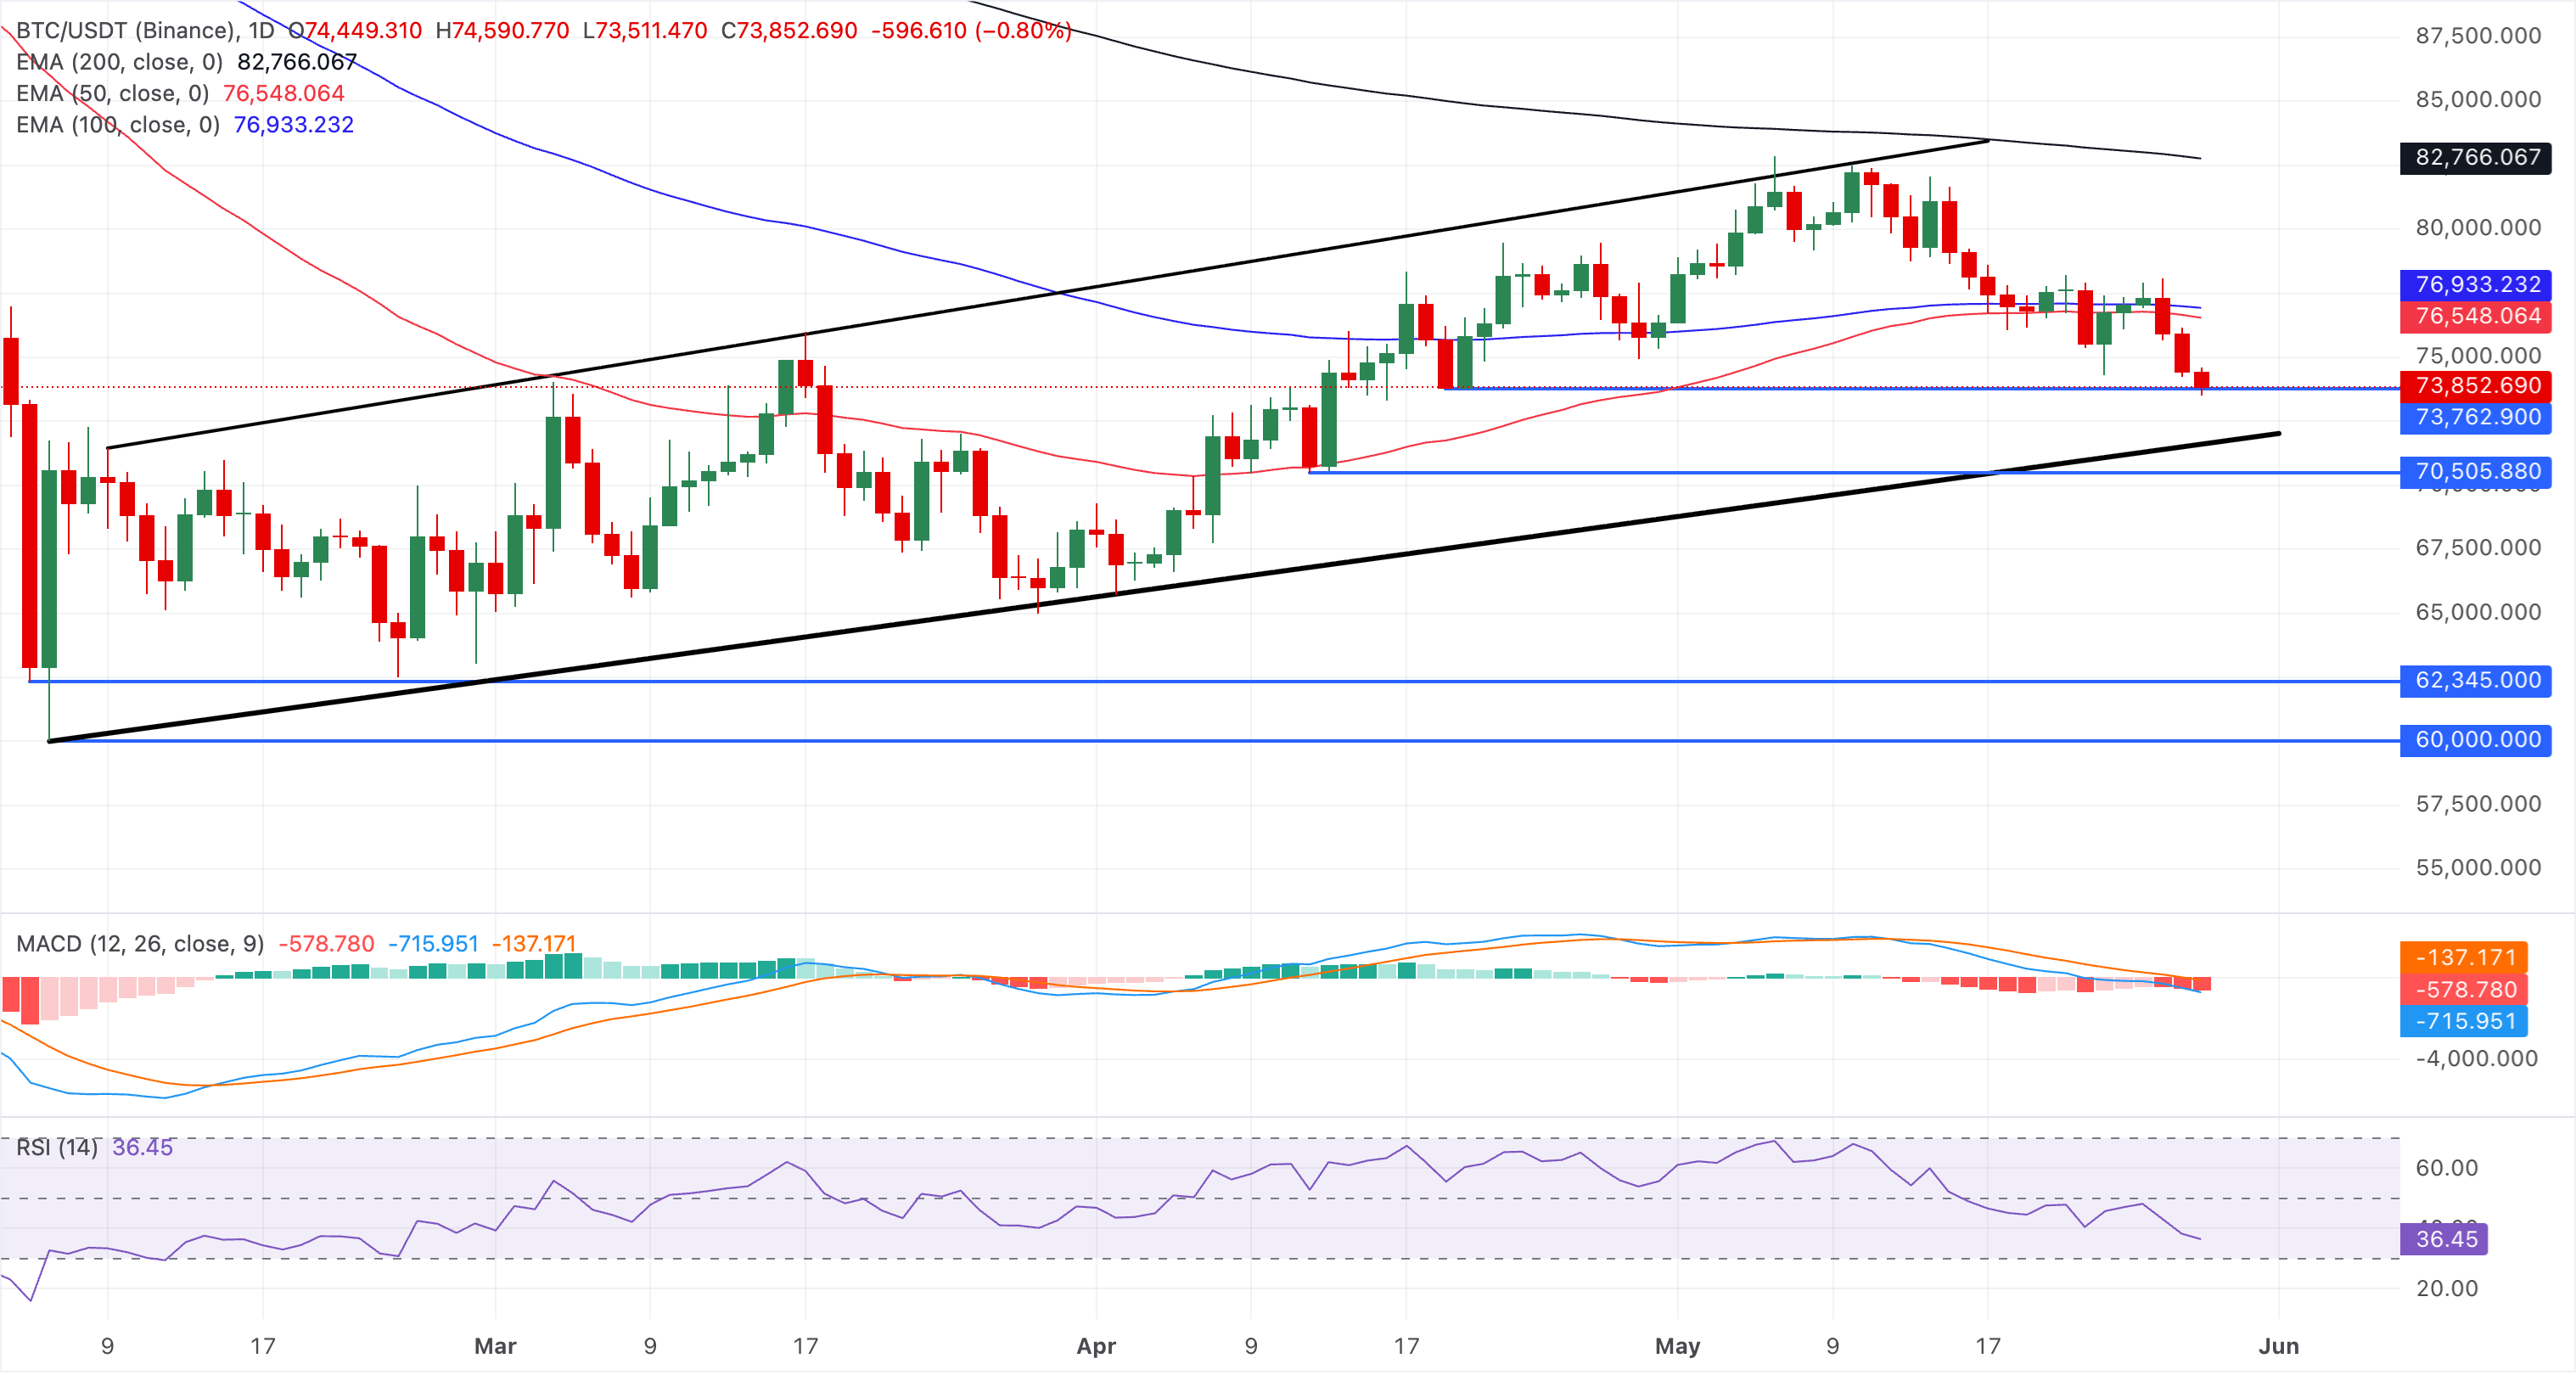
Looking up, immediate resistance emerges at the 50-day EMA around $76,548, followed by the 100-day EMA near $76,933.
Stellar extends short-term rally on DTCC partnership
Stellar is up 7% on Thursday, extending the 11% gains from the previous day. The rebound in XLM tests ground above the 100-day EMA at $0.1691, driven by the DTCC and the Stellar Development Foundation partnership to tokenize DTC‑custodied assets on its blockchain network.
The MACD histogram has turned positive with the MACD line above the signal line, and the RSI at 66 suggests firm upside momentum approaching overbought territory, hinting that the advance could slow as the pair nears the next major resistance area.
On the topside, initial resistance is defined by the February 1 high at $0.1826, followed by the 200-day EMA at $0.2035.
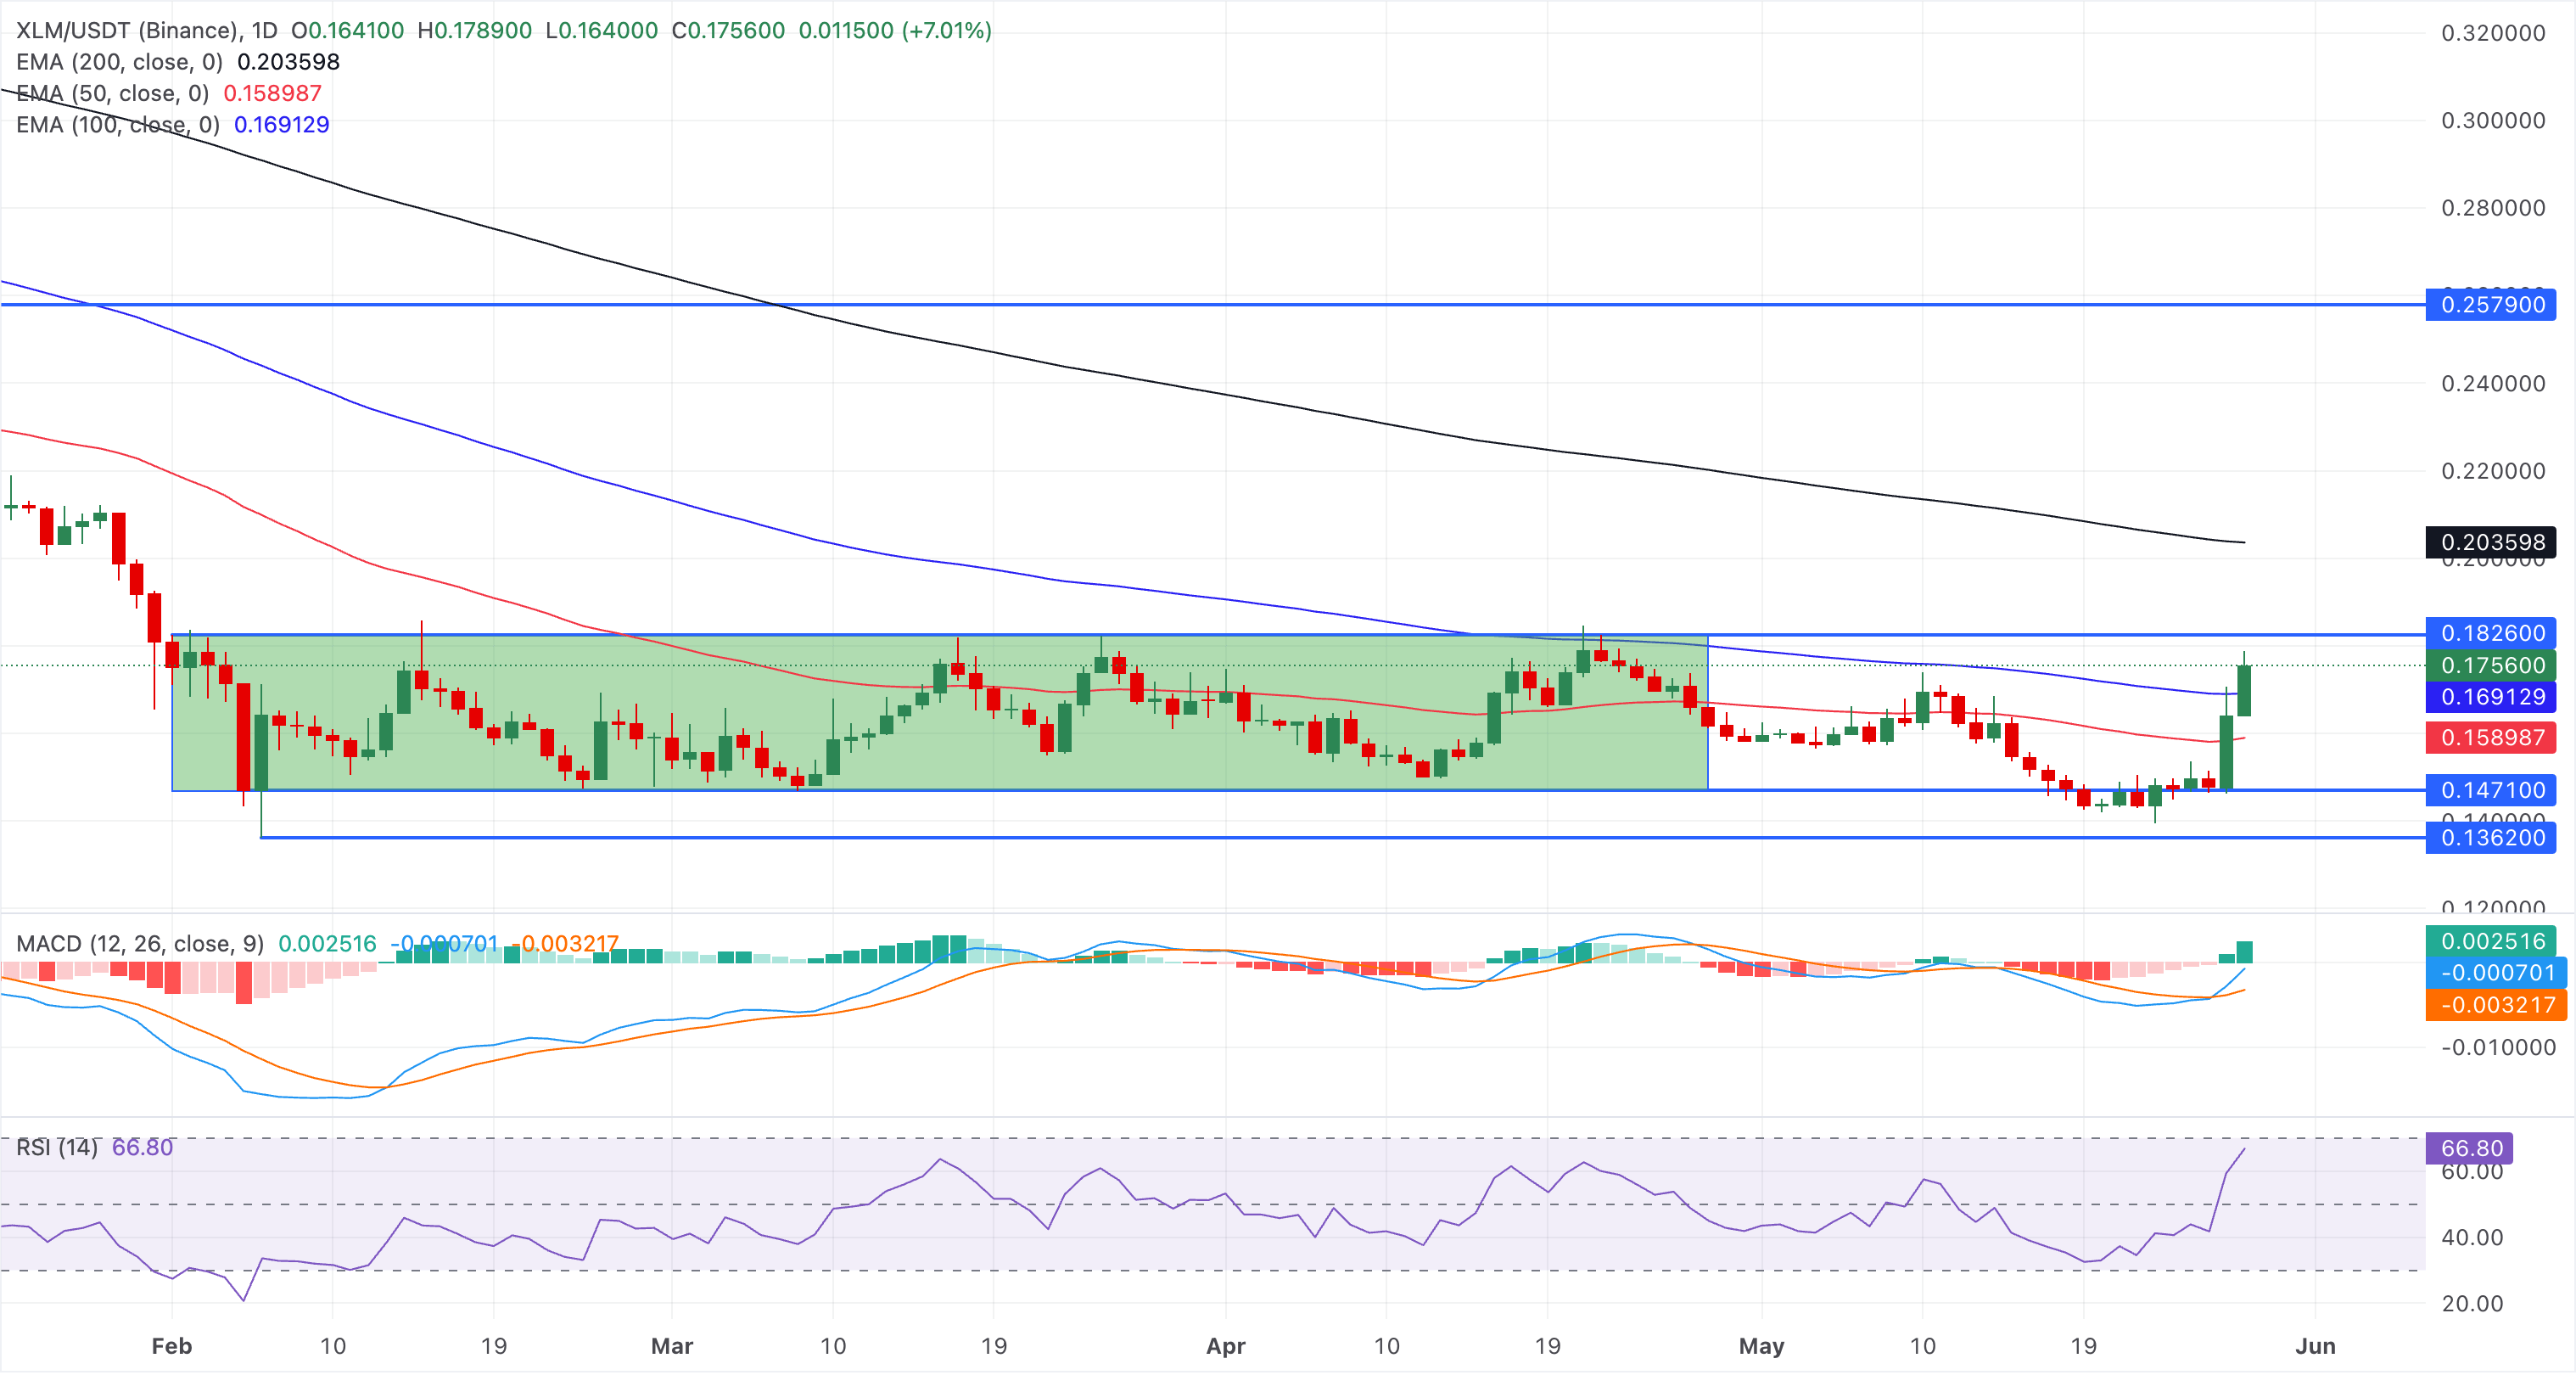
Looking down, immediate support aligns first with the 100-day EMA near $0.1691, followed by the 50-day EMA around $0.1589, where a deeper pullback would be expected to attract dip-buying interest while the broader uptrend remains intact.
(The technical analysis of this story was written with the help of an AI tool.)
Nothing in this material constitutes investment advice, personal recommendation, investment research, an offer, or a solicitation to buy or sell any financial instrument. The content has been prepared without consideration of your individual investment objectives, financial situation, or needs, and should not be treated as such.
Past performance is not a reliable indicator of future performance and/or results. Forward-looking scenarios or forecasts are not a guarantee of future performance. Actual results may differ materially from those anticipated.
Mitrade makes no representation or warranty as to the accuracy or completeness of the information provided and accepts no liability for any loss arising from reliance on such information.
Recommended Articles


