

Bittensor Price Forecast: TAO closes in key support, risking deeper losses
- Bittensor extends losses below $250 on Thursday, posting a fourth straight decline this week.
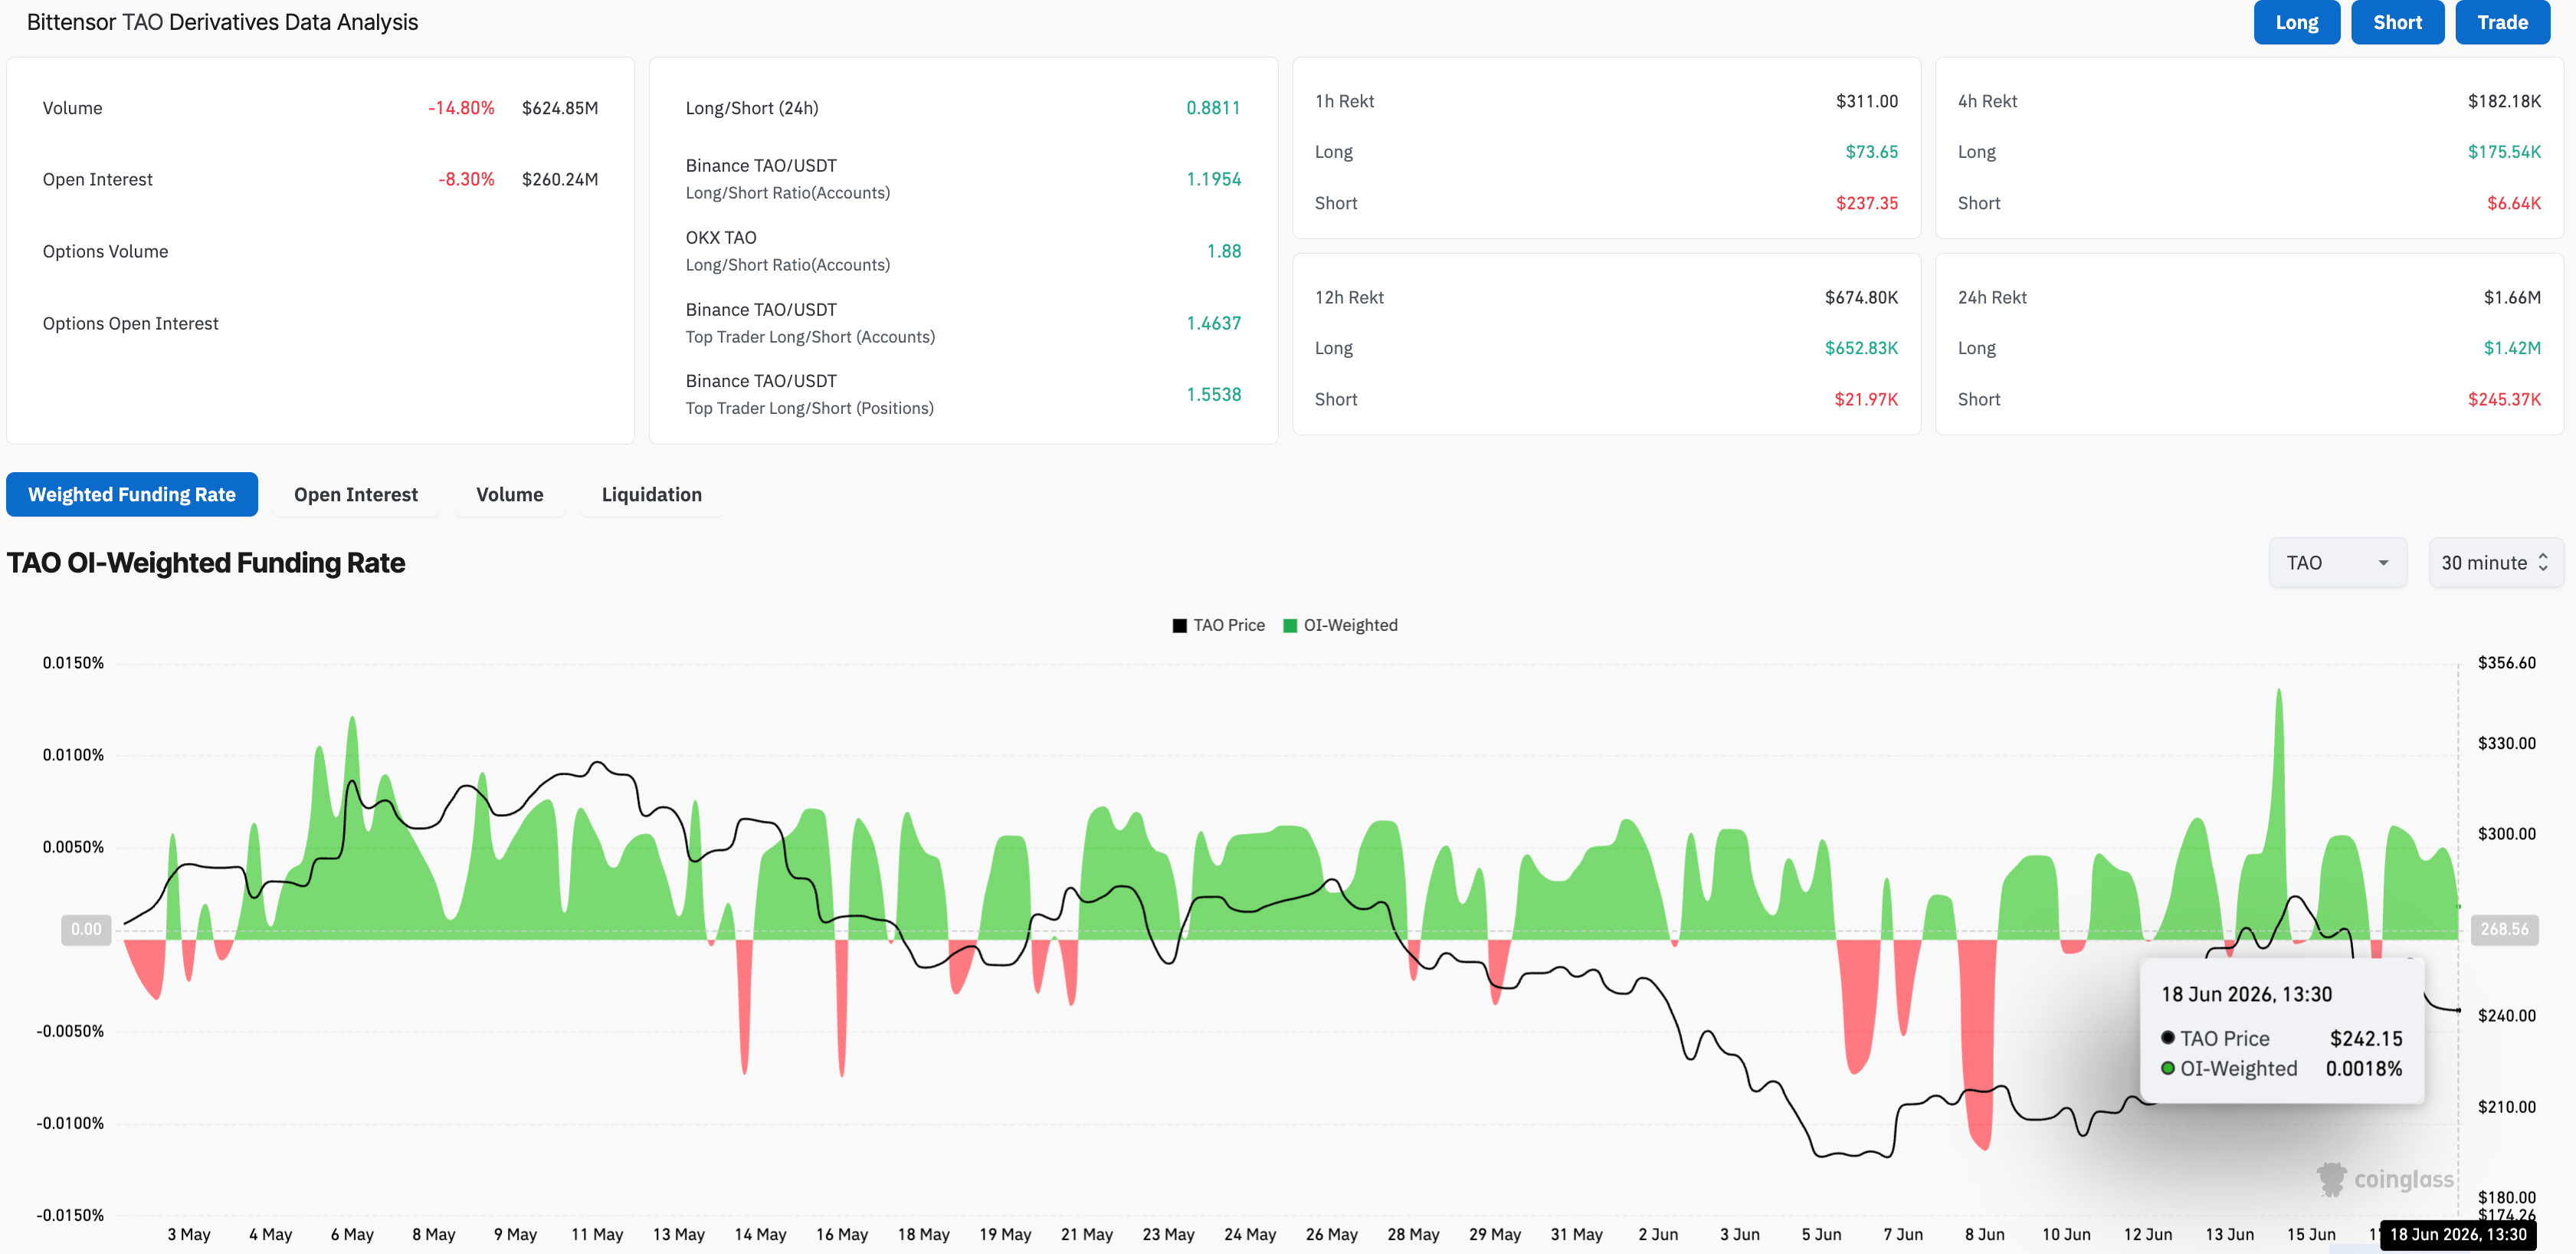
- The AI token is losing strength in the derivatives market as Open Interest and funding rates fall.
- Bittensor should hold the 20-day SMA at $231 to avoid a steeper decline toward $200.
Bittensor (TAO) price edges below $250 at press time on Thursday, marking its fourth straight day of losses. The AI token is losing retail demand as TAO futures Open Interest dips over 8% in the last 24 hours. The technical outlook for TAO highlights the 20-day Simple Moving Average (SMA) at $231 as the immediate support guarding the downside toward $200.
Retail demand wanes in TAO
Bittensor, one of the leading AI tokens in the crypto market, is losing its retail interest as the broader market sentiment falters. CoinGlass data show TAO futures Open Interest (OI) at $260.24 million, down over 8% in the last 24 hours, indicating a sharp decline in the notional value of active contracts.
Strengthening risk-off sentiment, total liquidations over the same period reached $1.66 million, led by a $1.42 million worth of bullish positional wipeout. The 14% drop in volume to $624.85 million and the funding rate down to 0.0018% reaffirms reduced trading activity and willingness to buy long positions.
Bittensor closes in the last line of defense before $200
Bittensor trades below the $250 psychological support on Thursday, extending its losses below the 50-day and 200-day Exponential Moving Averages (EMAs) at roughly $251 and $265. The AI token has been in a declining trend since the upper Bollinger Band capped its recovery last week near $290.
From a technical perspective, TAO remains above the 20-period SMA, around $231, which serves as the Bollinger Band's midline. A decisive close below $231 could expose downside risk to the 23.6% Fibonacci retracement level at $196, measured over the $538 to $143 downswing, and then to the lower Bollinger Band at $181.
That said, the Relative Strength Index (RSI) is hovering near a neutral 50, while the Moving Average Convergence Divergence (MACD) histogram contracts in the positive territory, which implies that last week's recovery was a corrective rebound rather than a sustained trend reversal.
On the topside, the 50% retracement level at $278 serves as crucial resistance, close to the upper Bollinger Band at $281. Beyond this, a clear breakout could open the path toward the 78.6% Fibonacci retracement level at $406.
(The technical analysis of this story was written with the help of an AI tool.)
Nothing in this material constitutes investment advice, personal recommendation, investment research, an offer, or a solicitation to buy or sell any financial instrument. The content has been prepared without consideration of your individual investment objectives, financial situation, or needs, and should not be treated as such.
Past performance is not a reliable indicator of future performance and/or results. Forward-looking scenarios or forecasts are not a guarantee of future performance. Actual results may differ materially from those anticipated.
Mitrade makes no representation or warranty as to the accuracy or completeness of the information provided and accepts no liability for any loss arising from reliance on such information.
Recommended Articles


