

LAB's explosive rally eyes new record highs
- LAB gains over 24% to trade above $18.00 on Wednesday.
- LAB’s recovery builds on a robust technical structure, with momentum indicators uptrending alongside major moving averages.
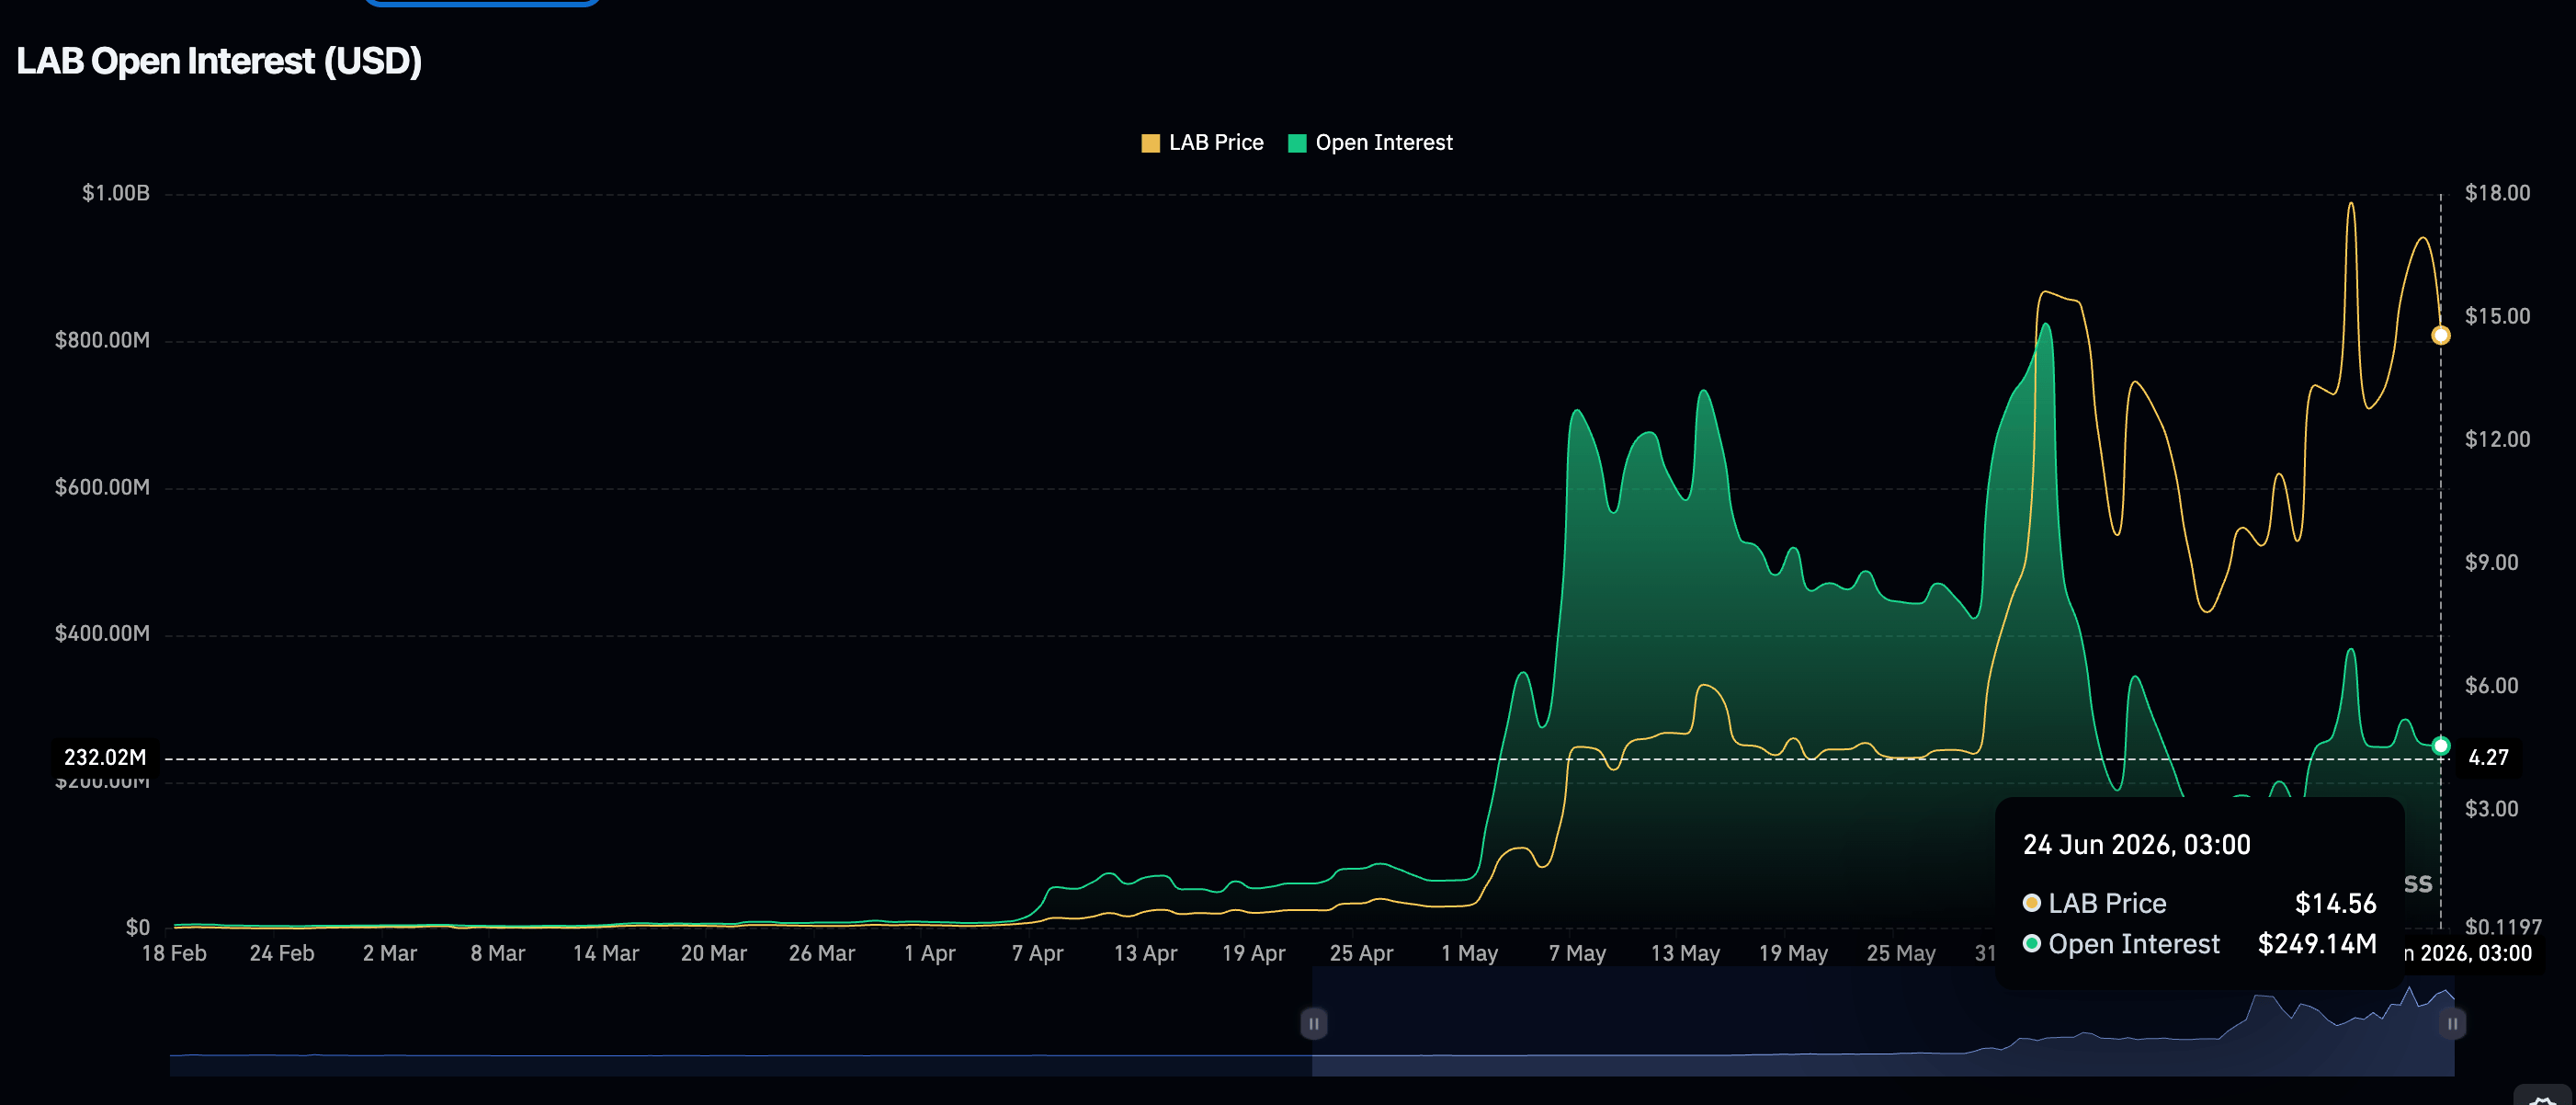
- Low retail participation, with perpetual futures Open Interest at $249 million and a negative OI-Weighted Funding Rate, could limit LAB’s upside.
LAB edges higher above $18.00 at the time of writing on Wednesday, defying broader crypto market headwinds that have constrained Bitcoin (BTC) in the $62,000-$63,000 range and Ethereum (ETH) between $1,600 and $1,700.
LAB extends rally despite cooling retail demand
Retail participation in LAB’s derivatives market remains subdued, evidenced by perpetual futures Open Interest (OI) averaging $249 million on Wednesday, a marginal dip from $251 million previously. CoinGlass data highlights that current OI levels are well below the recent spike to $381 million on June 19 and the all-time high of $824 million set on June 2.
This muted participation suggests persistent investor skepticism about LAB’s rally, resulting in limited appetite to open new long positions.
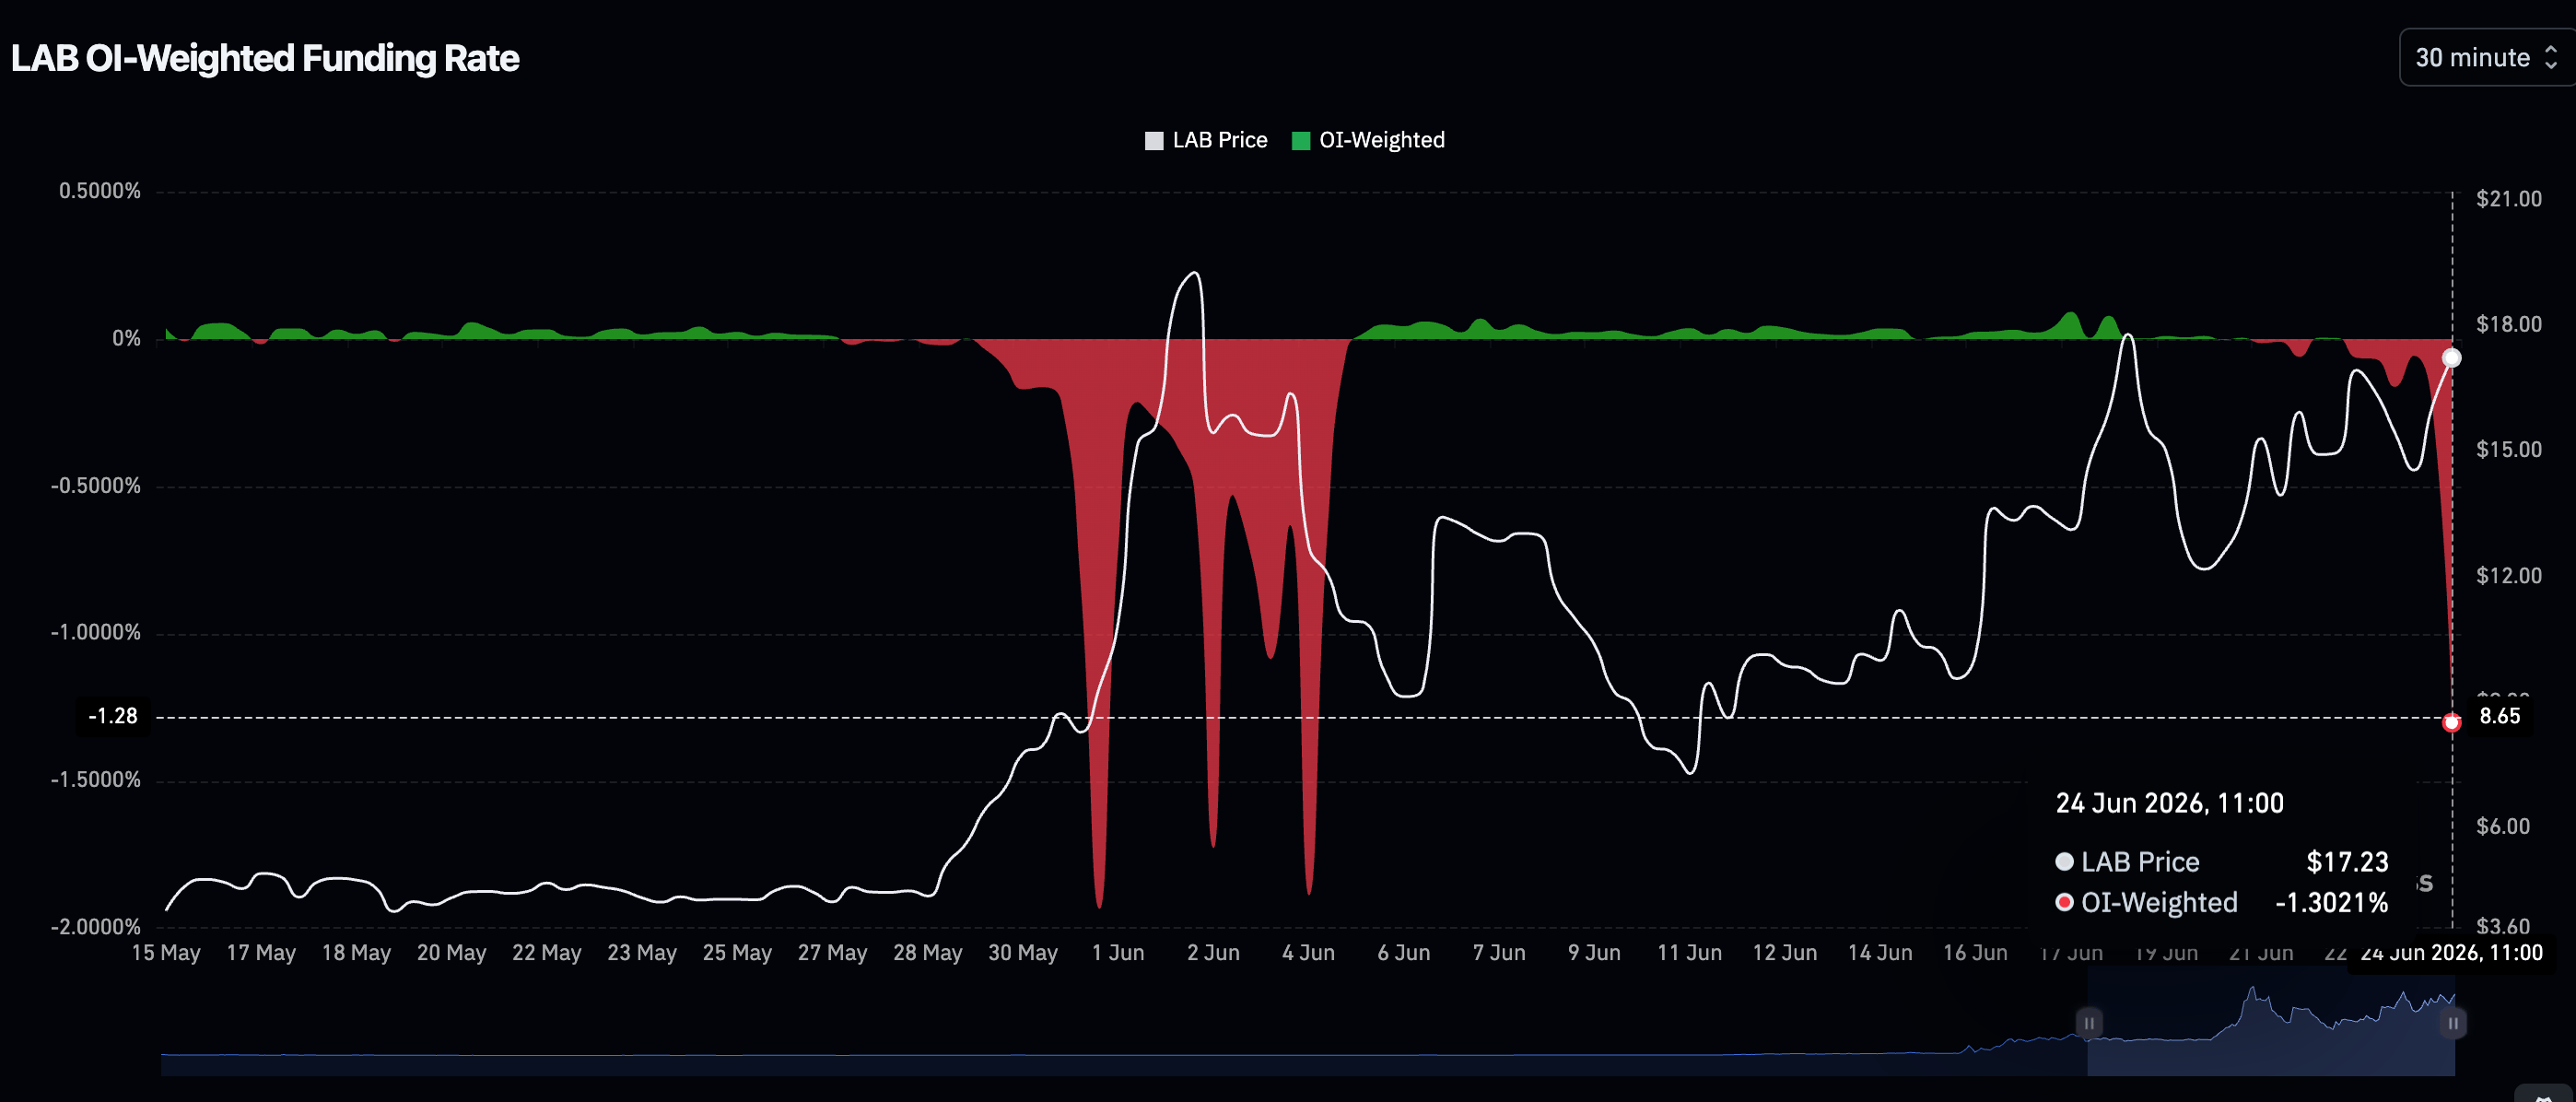
LAB’s OI-Weighted Funding Rate, currently in negative territory, aligns with the suppressed retail participation. A persistent negative reading signals that bears are willing to pay premium fees to keep their short positions open, anticipating a significant reversal despite the rally above $18.00.
Price analysis: LAB gains momentum as bulls tighten grip
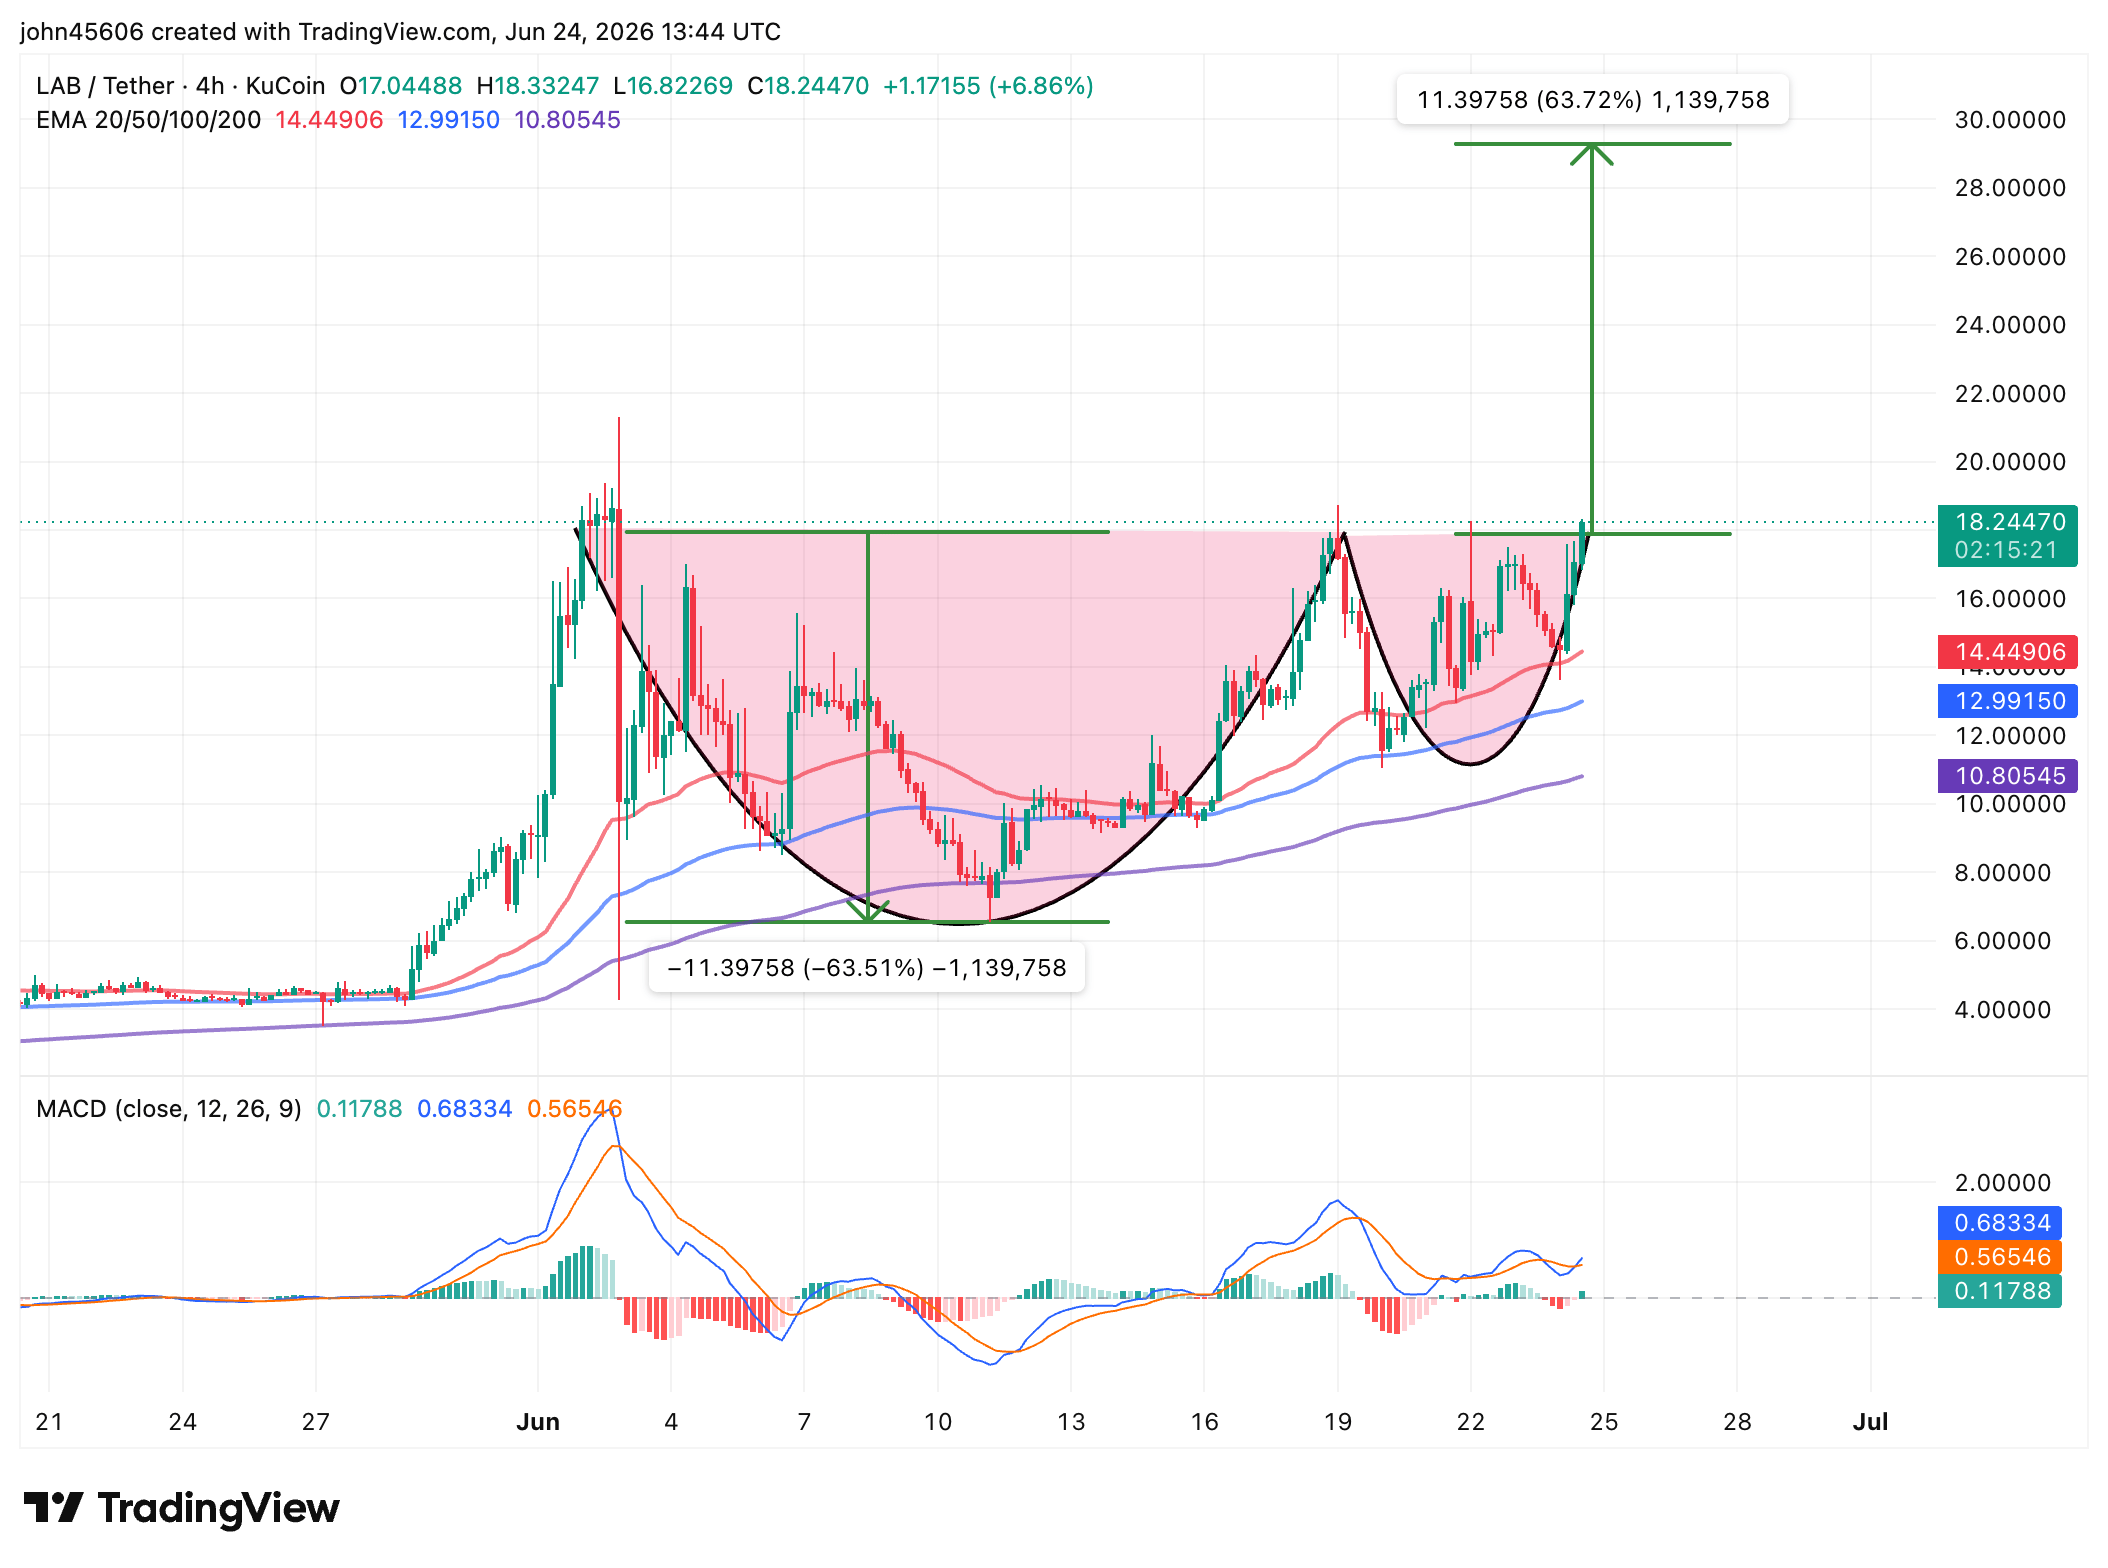
LAB trades above $18.00, increasing by over 24% on the day. The token exhibits a robust bullish outlook, underpinned by uptrending moving averages and momentum indicators.
The Moving Average Convergence Divergence (MACD) histogram has turned positive on the 4-hour chart, suggesting buyers have the upper hand and can keep the uptrend intact.
A daily close above $18.00 would reinforce LAB’s near-term bullish bias and increase the odds of an extended rally beyond the next target at $20.00. A cup-and-handle pattern on the same chart indicates that LAB is poised for a notable 64% upswing to new all-time highs near $30.00. LAB currently sits above the breakout point at $18.00.
Given that retail participation remains low, further price increases could be limited, potentially triggering a reversal. Profit-taking and buyer exhaustion are among the factors that could increase downside risks.
The $16.00 level marks the first psychological support range, where sidelined buyers could engage. However, if headwinds intensify, traders may look to the 50-period Exponential Moving Average (EMA) at $14.53, the 100-period EMA at $13.02, and the 200-period EMA at $10.82 for support and buy-the-dip opportunities.
LAB is a unified layer for on-chain trading, combining analysis, execution, perpetuals and rewards.
Open Interest, funding rate FAQs
Higher Open Interest is associated with higher liquidity and new capital inflow to the market. This is considered the equivalent of increase in efficiency and the ongoing trend continues. When Open Interest decreases, it is considered a sign of liquidation in the market, investors are leaving and the overall demand for an asset is on a decline, fueling a bearish sentiment among investors.
Funding fees bridge the difference between spot prices and prices of futures contracts of an asset by increasing liquidation risks faced by traders. A consistently high and positive funding rate implies there is a bullish sentiment among market participants and there is an expectation of a price hike. A consistently negative funding rate for an asset implies a bearish sentiment, indicating that traders expect the cryptocurrency’s price to fall and a bearish trend reversal is likely to occur.
Nothing in this material constitutes investment advice, personal recommendation, investment research, an offer, or a solicitation to buy or sell any financial instrument. The content has been prepared without consideration of your individual investment objectives, financial situation, or needs, and should not be treated as such.
Past performance is not a reliable indicator of future performance and/or results. Forward-looking scenarios or forecasts are not a guarantee of future performance. Actual results may differ materially from those anticipated.
Mitrade makes no representation or warranty as to the accuracy or completeness of the information provided and accepts no liability for any loss arising from reliance on such information.
Recommended Articles


