



Solana Price Forecast: Retail confidence backs SOL testing 50-day EMA breakout near $75
- Solana edges higher on Wednesday, testing a bullish breakout of the 50-day EMA around $75.
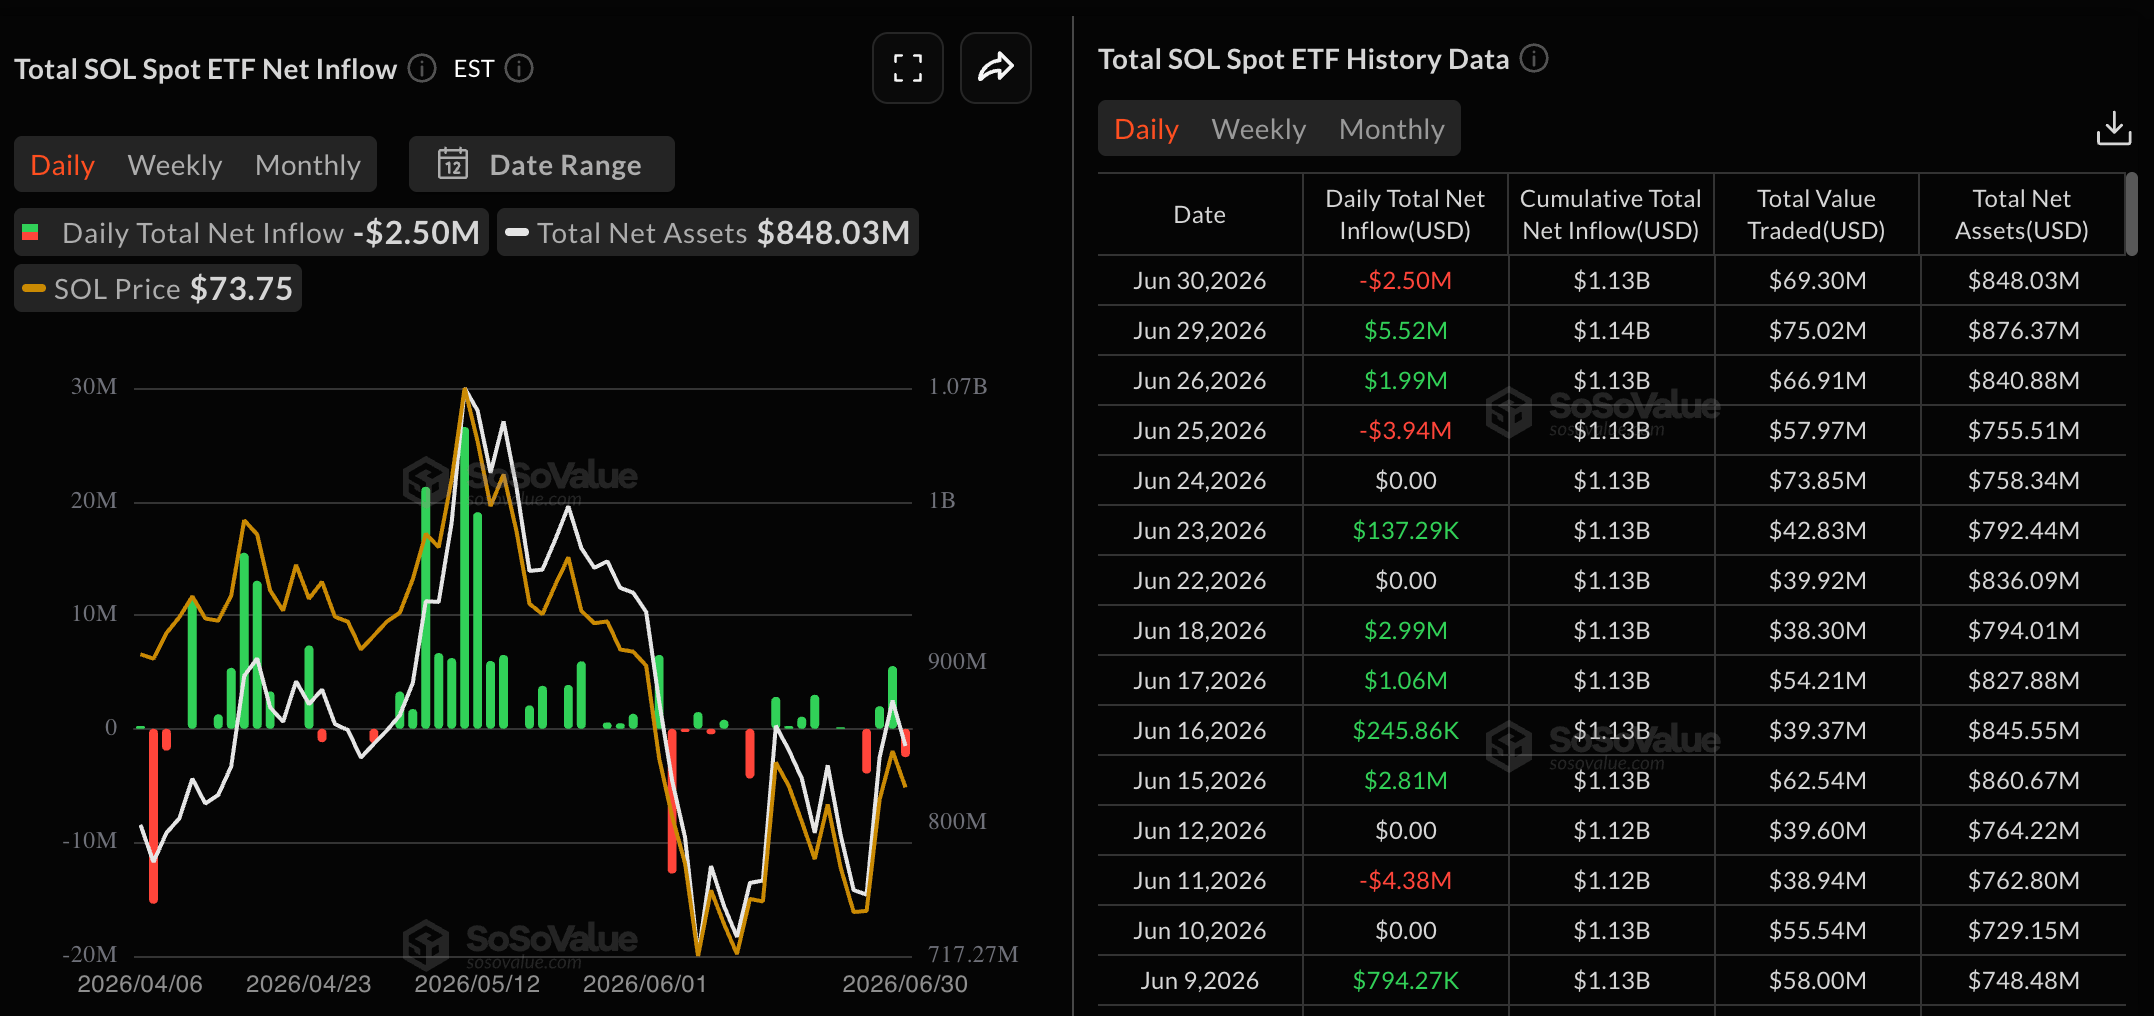
- Institutional demand for Solana remains mixed following a $2.50 million outflow on Tuesday.
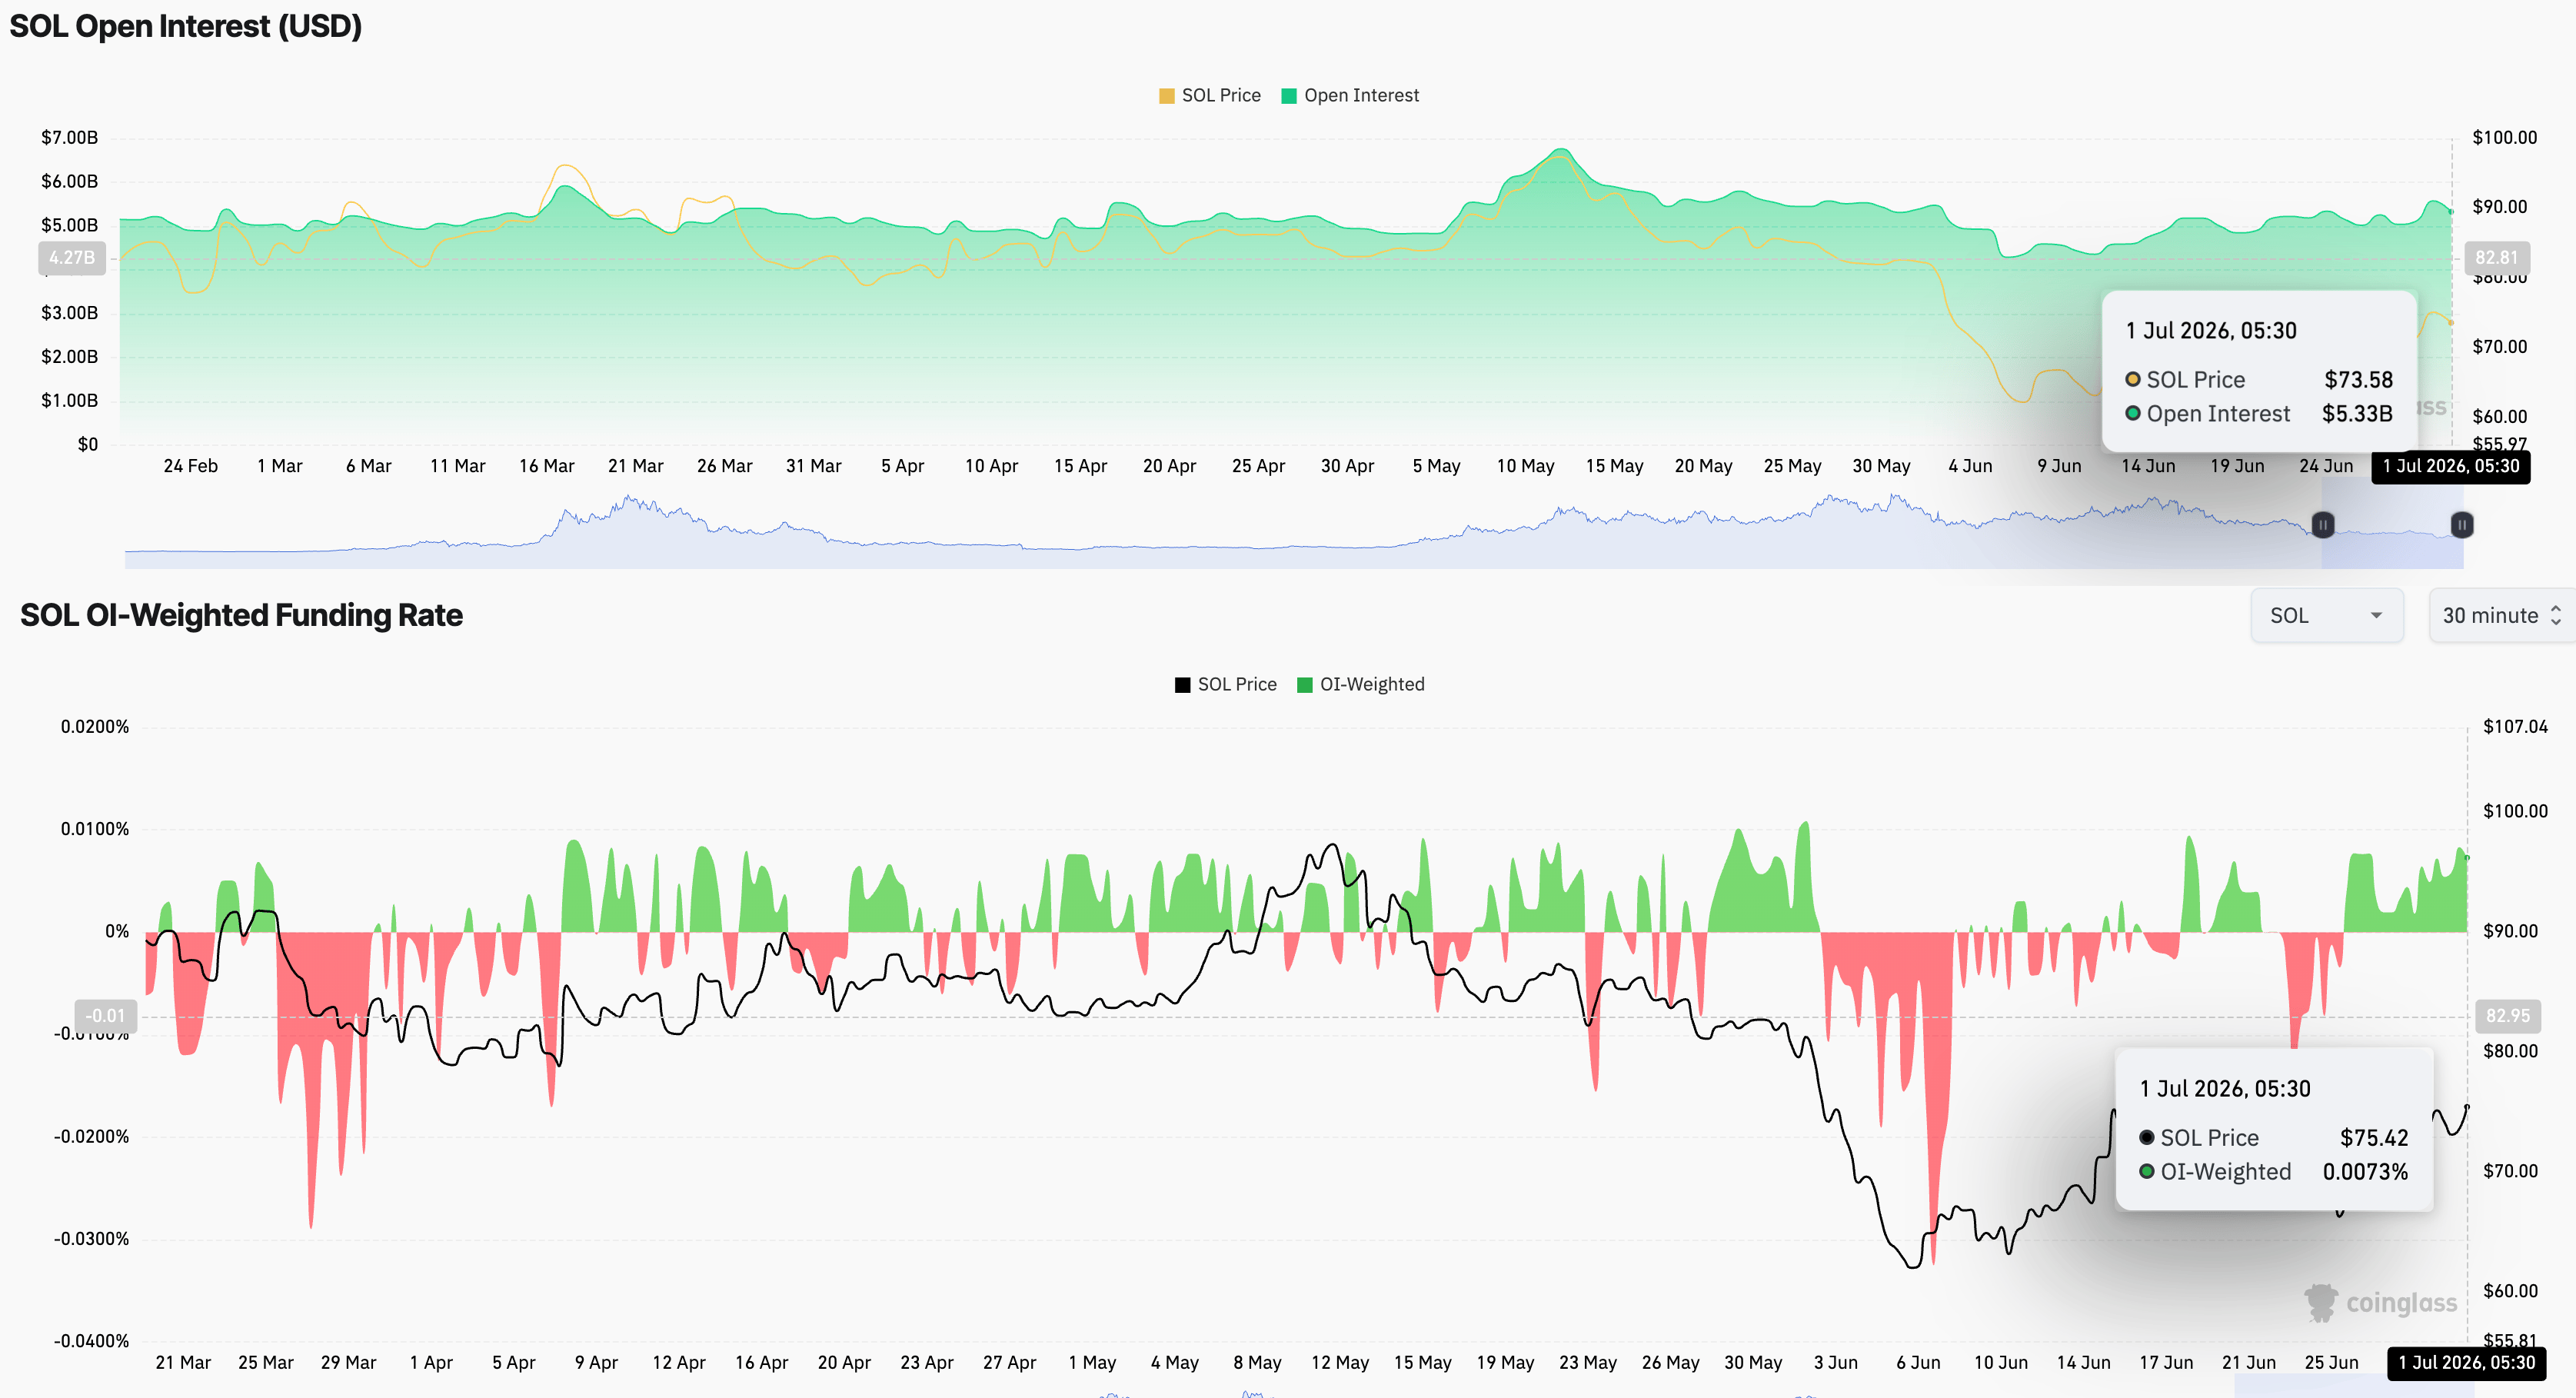
- Retail confidence is building up in Solana as funding rates increase while Open Interest stabilizes above $5 billion.
Solana (SOL) price extends gains on Wednesday, testing the 50-day Exponential Moving Average (EMA) around $75.00. Although institutional demand for Solana remains weak, stabilizing retail confidence, with rising funding rates and steady Open Interest, supports the mild recovery. The technical outlook for SOL shifts mildly bullish, projecting a potential breakout rally toward the $100 mark.
Solana rides on retail demand, with the jury still out on institutional support
Solana is gaining retail strength again, supporting its mild recovery, while Exchange-Traded Funds (ETFs) struggle to maintain steady inflows. CoinGlass data shows SOL Open Interest (OI) at $5.33 billion on Wednesday, stabilizing above $5 billion after a decline last month. This indicates that positional wipeout is easing, correlating with a relief in risk-off sentiment.
Funding rate, a metric that tracks Solana derivatives sentiment, rose to 0.0073% on Wednesday, indicating that traders are willing to buy long positions at a premium.
On the institutional front, SOL-focused ETFs recorded $2.50 million in outflows on Wednesday, following a $5.52 million inflow the previous day, which reflects a mixed outlook.
Technical outlook: Will SOL extend its rally to $100?
Solana hovers above $75.00 at press time on Wednesday, testing its 50-day EMA at $75.21, which serves as the immediate barrier. A decisive close above this moving average could extend Solana's mild recovery toward the 200-day EMA around $98.79. A breakout rally could support a bullish outlook for SOL, helping it reclaim the $100 mark.
Momentum on the daily chart supports breakout potential, with the Relative Strength Index (RSI) at 55, hovering just above the mid‑50s as buying pressure resurfaces. At the same time, the Moving Average Convergence Divergence (MACD) rises toward positive territory alongside its signal line, suggesting that upside momentum is improving.
Looking down, a reversal from the 50-day EMA at $75.21 could trigger a retracement toward the February 6 low of $67.50.
(The technical analysis of this story was written with the help of an AI tool.)
Cryptocurrency prices FAQs
Token launches influence demand and adoption among market participants. Listings on crypto exchanges deepen the liquidity for an asset and add new participants to an asset’s network. This is typically bullish for a digital asset.
A hack is an event in which an attacker captures a large volume of the asset from a DeFi bridge or hot wallet of an exchange or any other crypto platform via exploits, bugs or other methods. The exploiter then transfers these tokens out of the exchange platforms to ultimately sell or swap the assets for other cryptocurrencies or stablecoins. Such events often involve an en masse panic triggering a sell-off in the affected assets.
Macroeconomic events like the US Federal Reserve’s decision on interest rates influence crypto assets mainly through the direct impact they have on the US Dollar. An increase in interest rate typically negatively influences Bitcoin and altcoin prices, and vice versa. If the US Dollar index declines, risk assets and associated leverage for trading gets cheaper, in turn driving crypto prices higher.
Halvings are typically considered bullish events as they slash the block reward in half for miners, constricting the supply of the asset. At consistent demand if the supply reduces, the asset’s price climbs.
Nothing in this material constitutes investment advice, personal recommendation, investment research, an offer, or a solicitation to buy or sell any financial instrument. The content has been prepared without consideration of your individual investment objectives, financial situation, or needs, and should not be treated as such.
Past performance is not a reliable indicator of future performance and/or results. Forward-looking scenarios or forecasts are not a guarantee of future performance. Actual results may differ materially from those anticipated.
Mitrade makes no representation or warranty as to the accuracy or completeness of the information provided and accepts no liability for any loss arising from reliance on such information.
Recommended Articles


