



Crypto Overview: Bitcoin reclaims $80,000 – Venice Token and NEAR Protocol rally
- Bitcoin hovers above $81,000 on Monday, sustaining its roughly 6% gains from Friday.
- The failed CLARITY Act pushes the US SEC and CFTC to use existing statutory powers to shape crypto rules.
- Venice Token and NEAR Protocol have posted double-digit gains over the last 24 hours, scaling to fresh annual highs.
Bitcoin (BTC) is trading above $81,000 on Monday, holding firm after a 6% surge on Friday, linked to US financial watchdogs' efforts to structure crypto assets under existing rules following the CLARITY Act's failure to advance. Venice and NEAR Protocol have posted double-digit gains over the last 24 hours, scaling to fresh annual highs.
CLARITY Act failure pushes US market regulators to innovate structuring
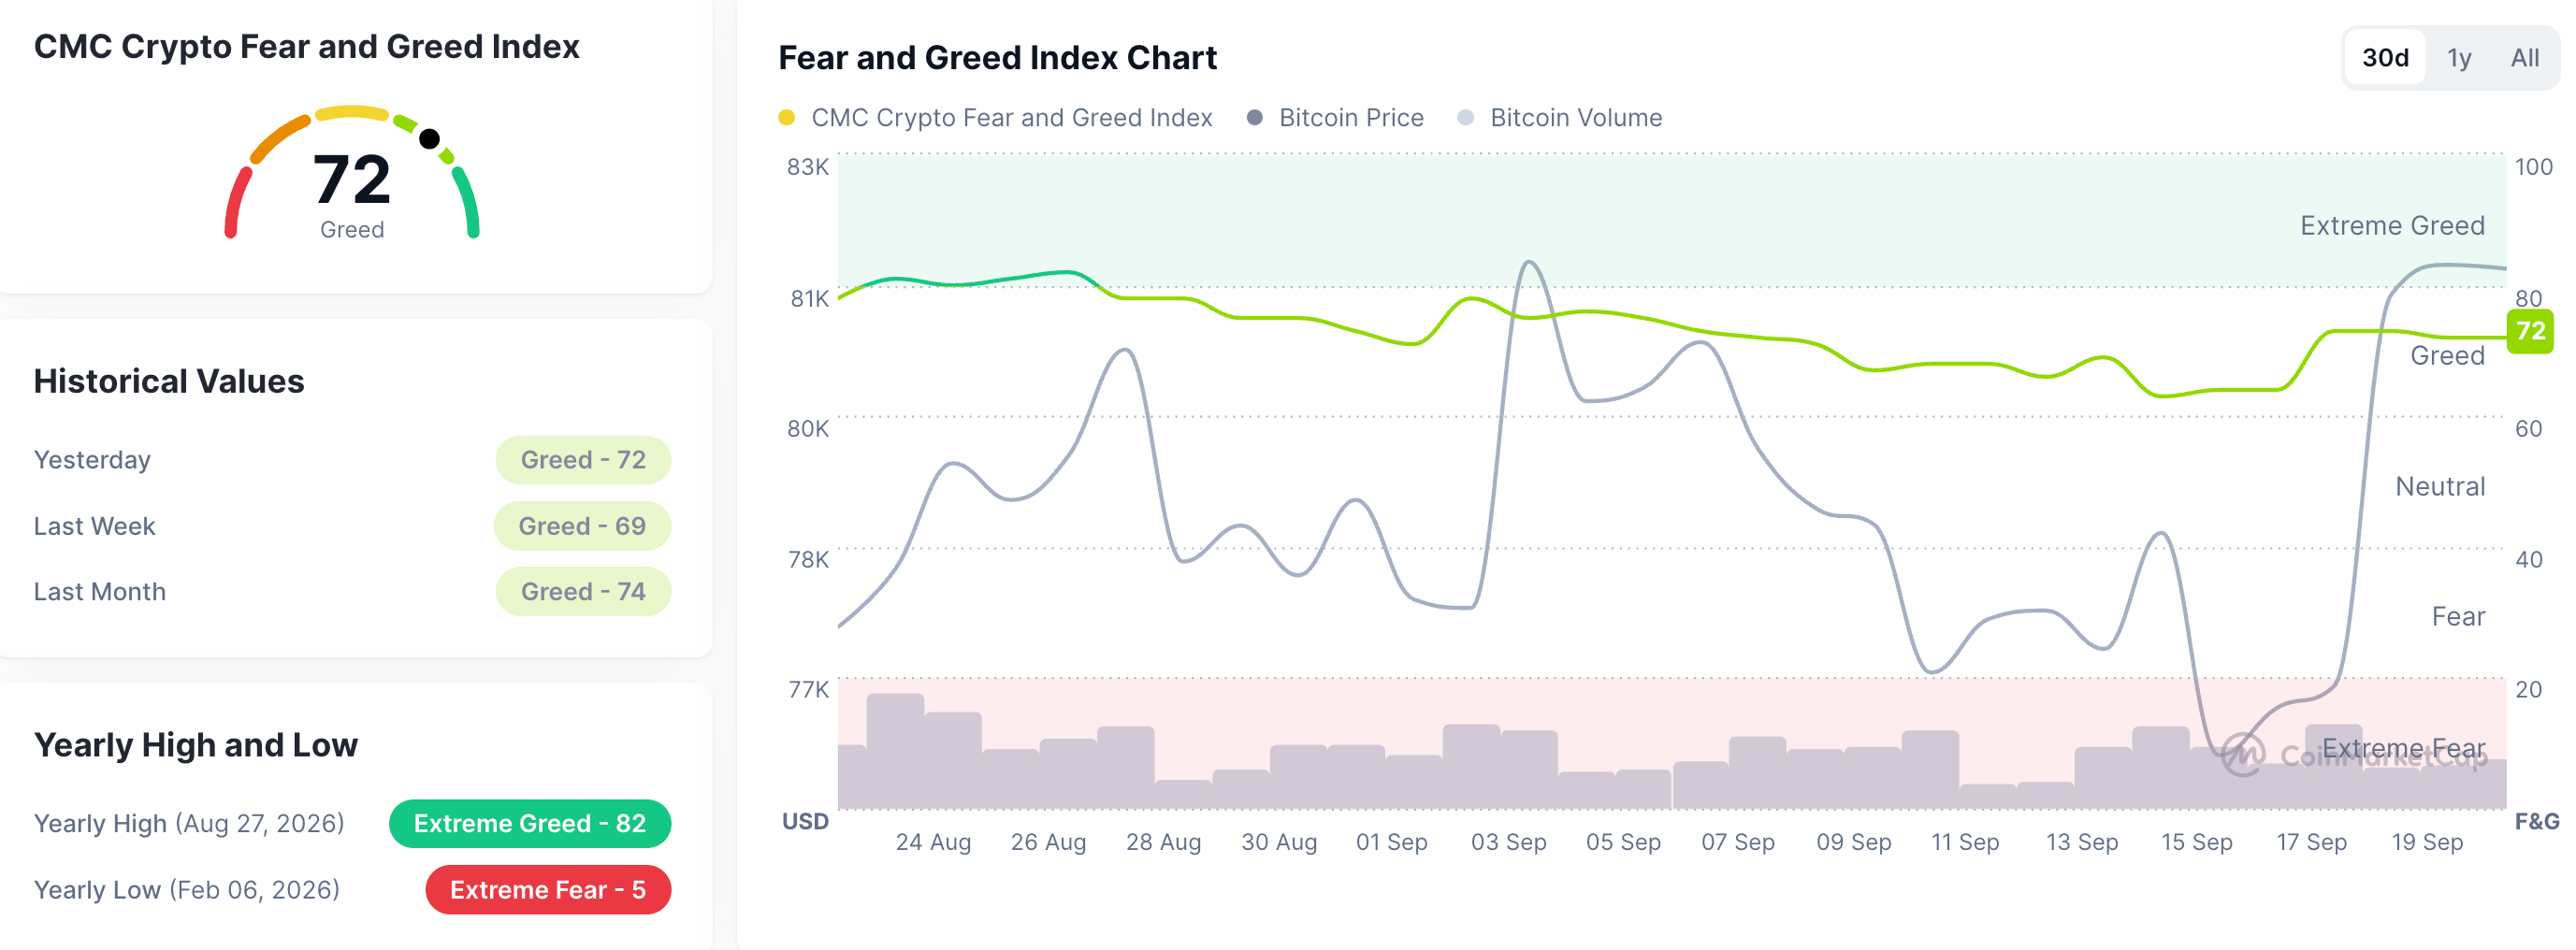
The broader cryptocurrency market sustains its risk-on sentiment, with the Fear and Greed Index around 72 on Monday, up from 69 last week and holding flat in the “Greed” zone. The failure of the CLARITY Act to advance to the US Senate floor led the US Securities and Exchange Commission and the Commodity Futures Trading Commission (CFTC) to pursue different approaches to regulating the US crypto market.
The SEC granted an “Innovation Exemption” for trading tokenized stocks last week, while the CFTC submitted a Regulation Crypto Asset Transactions and Regulation Crypto Asset Markets proposal on Thursday to the Office of Management and Budget. A clear push to establish a regime for the crypto market is boosting investor demand, as previously reported by FXStreet.
Bitcoin makes another breakout attempt near $82,850
Bitcoin hovers around $81,400 at press time on Monday, maintaining a bullish near-term bias as price holds well above the 50-, 100-, and 200-day Exponential Moving Averages (EMAs) at $74,812, $72,242, and $73,498, respectively.
The next hurdle for BTC aligns with the clustered September 3 and May 6 highs at $82,300 and $82,850. A decisive close above this zone could target the 78.6% Fibonacci retracement level at $86,471, measured from $96,495 to $57,800.
Momentum remains constructive, with the Relative Strength Index (RSI) hovering at 64 on the daily chart above the midline and the Moving Average Convergence Divergence (MACD) crossing above its signal line, which together suggest that buying pressure is still dominant.
On the downside, initial support emerges at the 50% retracement at $75,233, ahead of the 50-day EMA near $74,812. Below, the 200-day EMA at $73,498 and the 100-day EMA at $72,242 form a broader demand zone.
Venice Token and NEAR Protocol scale higher
Venice Token trades at a record high of $31.40 at press time on Monday, extending a strong bullish phase well above its major 50-day EMA at $19.34, 100-day EMA near $16.49, and the 200-day EMA around $13.34, suggesting a firmly supported uptrend.
However, momentum is starting to stretch thin on the daily chart, with the RSI hovering in overbought territory near 71, while the MACD remains positive and continues to extend an upward trend above its signal line, hinting that bullish momentum is still in play.
The Fibonacci retracement over the previous downswing from $21.43 to $9.79 marks the 161.8% extension level at $34.79 as the next bullish target.
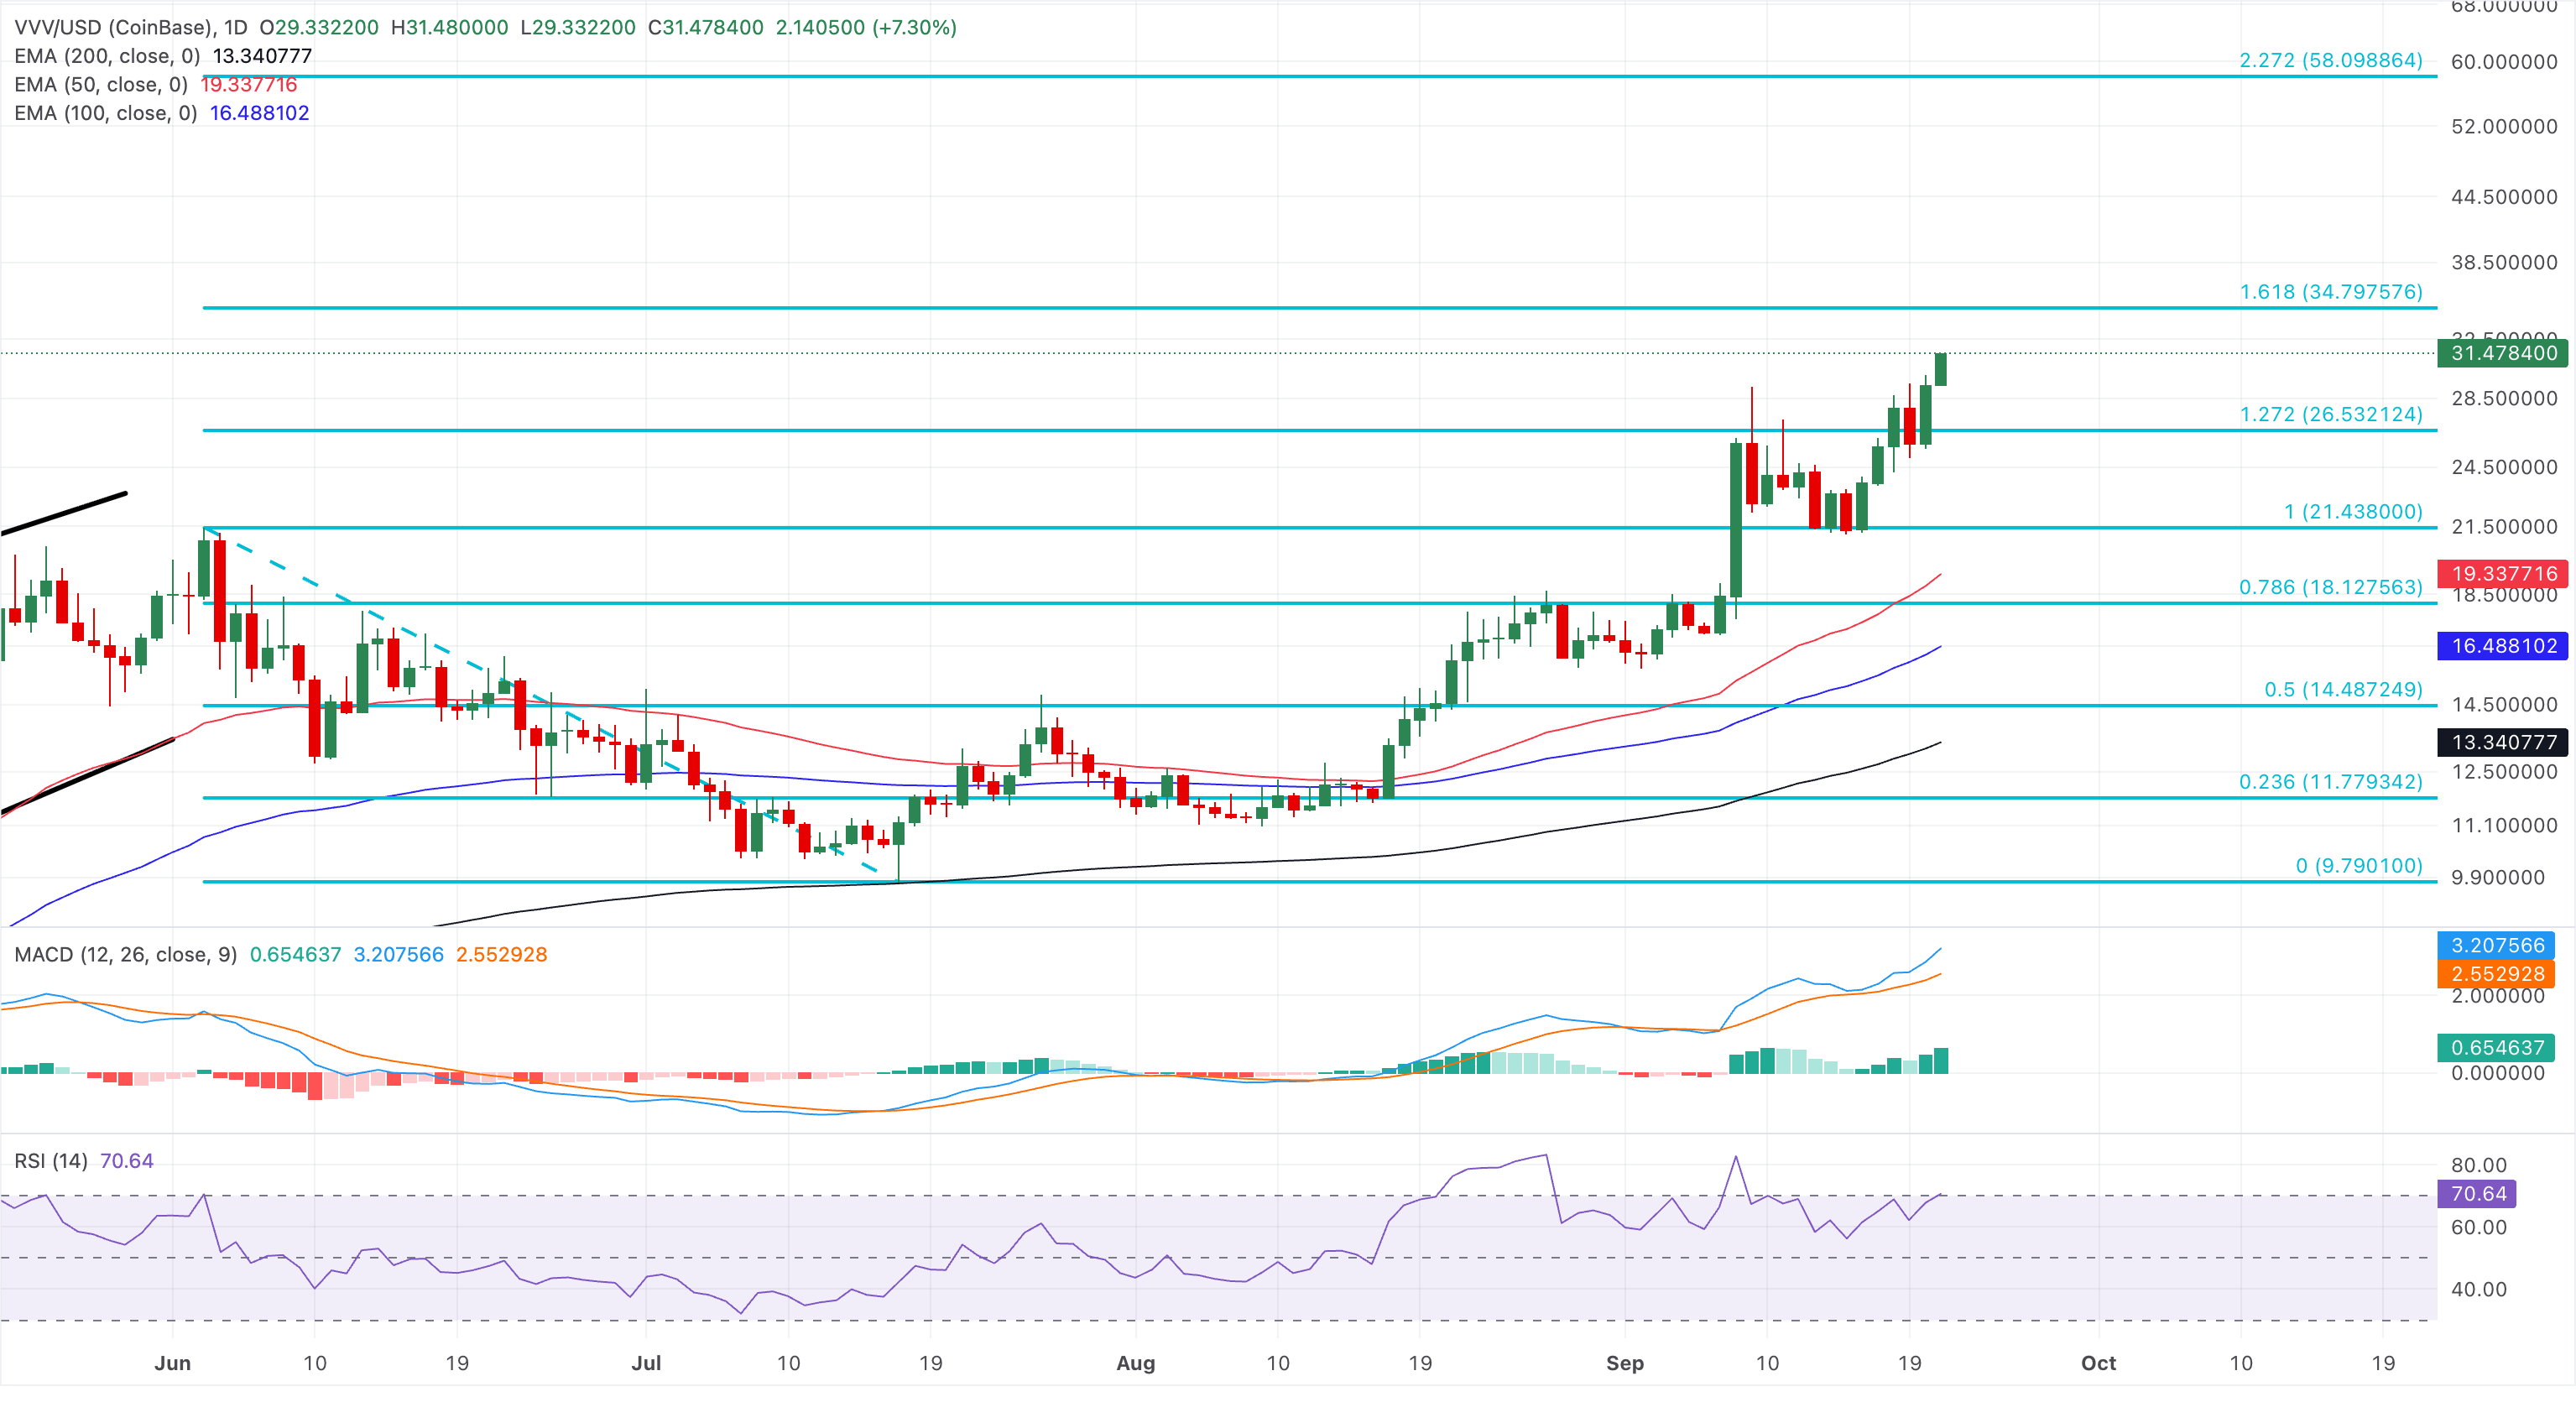
Looking down, the initial support is seen around the recent breakout area near the 127.2% Fibonacci extension level at $26.53, ahead of the prior swing high and 100% Fibonacci retracement level at $21.43.
NEAR Protocol hovers above $4.00 at press time on Monday, scaling to a fresh annual high after an 81% rally last week. This double-digit rally was triggered by the launch of "confidential perpetuals" with Hyperliquid, as previously reported by FXStreet.
NEAR extends a strong bullish sequence well above its 50-day EMA at $2.36, 100-day EMA at $2.12, and 200-day EMA at $1.96, suggesting a firmly supported uptrend. Momentum remains overheated, with the RSI hovering near 82 in overbought territory, while the MACD advances higher, hinting that upside pressure persists.
Looking up, the 127.2% and 161.8% Fibonacci extension levels at $4.57 and $7.25, respectively, measured from $3.18 to $0.84, serve as overhead barriers.
On the downside, the first notable support aligns with the prior swing high and 100% Fibonacci retracement at $3.18, ahead of a broader demand cluster between the 78.6% retracement at $2.39 and the 50-day EMA at $2.36.
(The technical analysis of this story was written with the help of an AI tool. Know more.)
Nothing in this material constitutes investment advice, personal recommendation, investment research, an offer, or a solicitation to buy or sell any financial instrument. The content has been prepared without consideration of your individual investment objectives, financial situation, or needs, and should not be treated as such.
Past performance is not a reliable indicator of future performance and/or results. Forward-looking scenarios or forecasts are not a guarantee of future performance. Actual results may differ materially from those anticipated.
Mitrade makes no representation or warranty as to the accuracy or completeness of the information provided and accepts no liability for any loss arising from reliance on such information.
Recommended Articles


