



Solana Price Forecast: Bullish bets, ETF inflows drive SOL recovery
- Solana trades above $78 on Thursday, gaining nearly 10% so far this week.
- Derivatives data backs the bullish bias, with long positions climbing to a monthly high and funding rates turning positive.
- Mild ETF inflows on Wednesday, alongside bullish momentum indicators, support further gains in SOL.
Solana (SOL) extends its recovery, trading above $78 on Thursday, having gained nearly 10% so far this week. The rebound is supported by strengthening derivatives metrics, modest institutional demand and improving technical momentum, all suggesting SOL could extend its gains in the near term.
Strengthening derivatives metrics
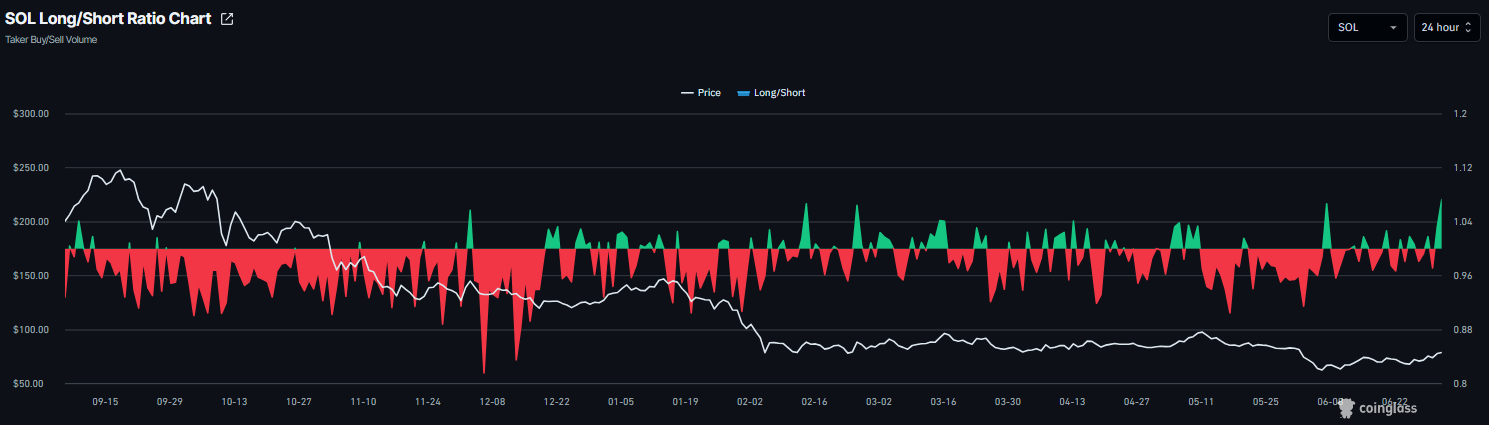
Derivatives data for Solana shows bullish bias. CoinGlass long-to-short ratio reads 1.11 on Thursday, the highest level over a month. A ratio above 1 indicates bullish sentiment, as traders bet that asset prices will rally.
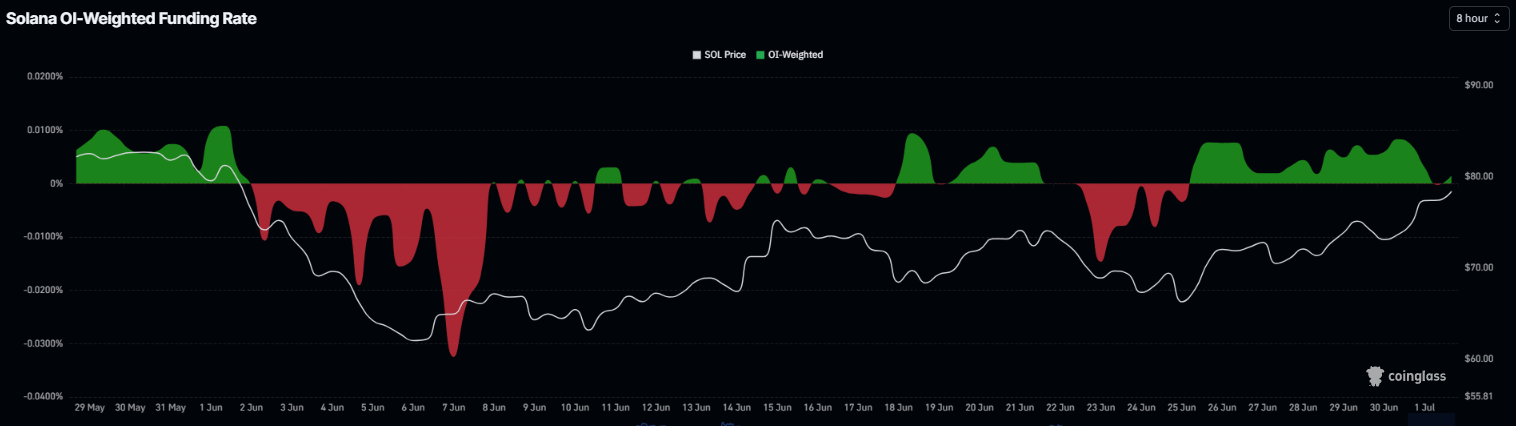
In addition, CoinGlass funding rate for SOL turned positive on Thursday, reading 0.0017%, indicating that longs are paying shorts and suggesting bullish sentiment.
Return of institutional demand
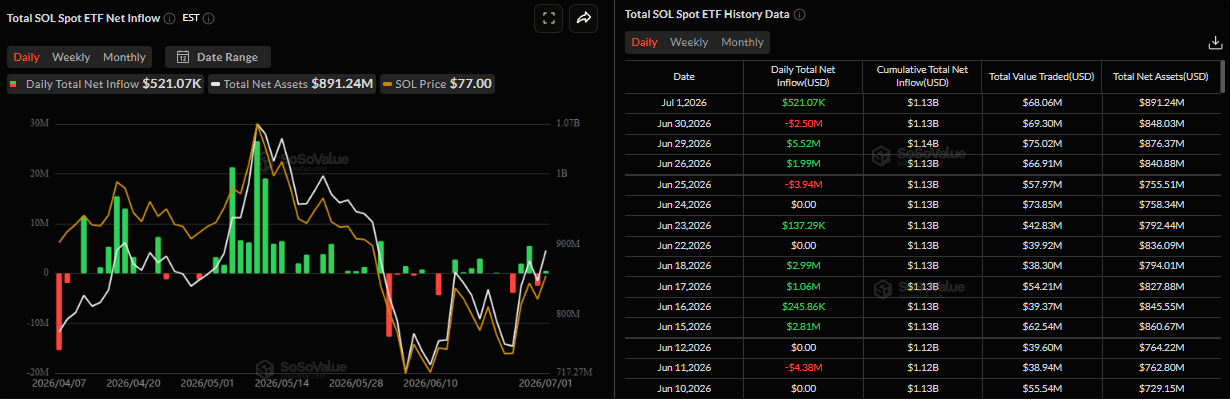
Institutional demand shows early signs of optimism. SoSoValue data shows that SOL’s spot ETFs recorded an inflow of $521,070 on Wednesday. So far through Wednesday, SOL recorded a net inflow of $3.55 million; if this inflow trend continues and intensifies this week, SOL price could see further upside.
Solana Price Forecast: Bullish strength gaining traction
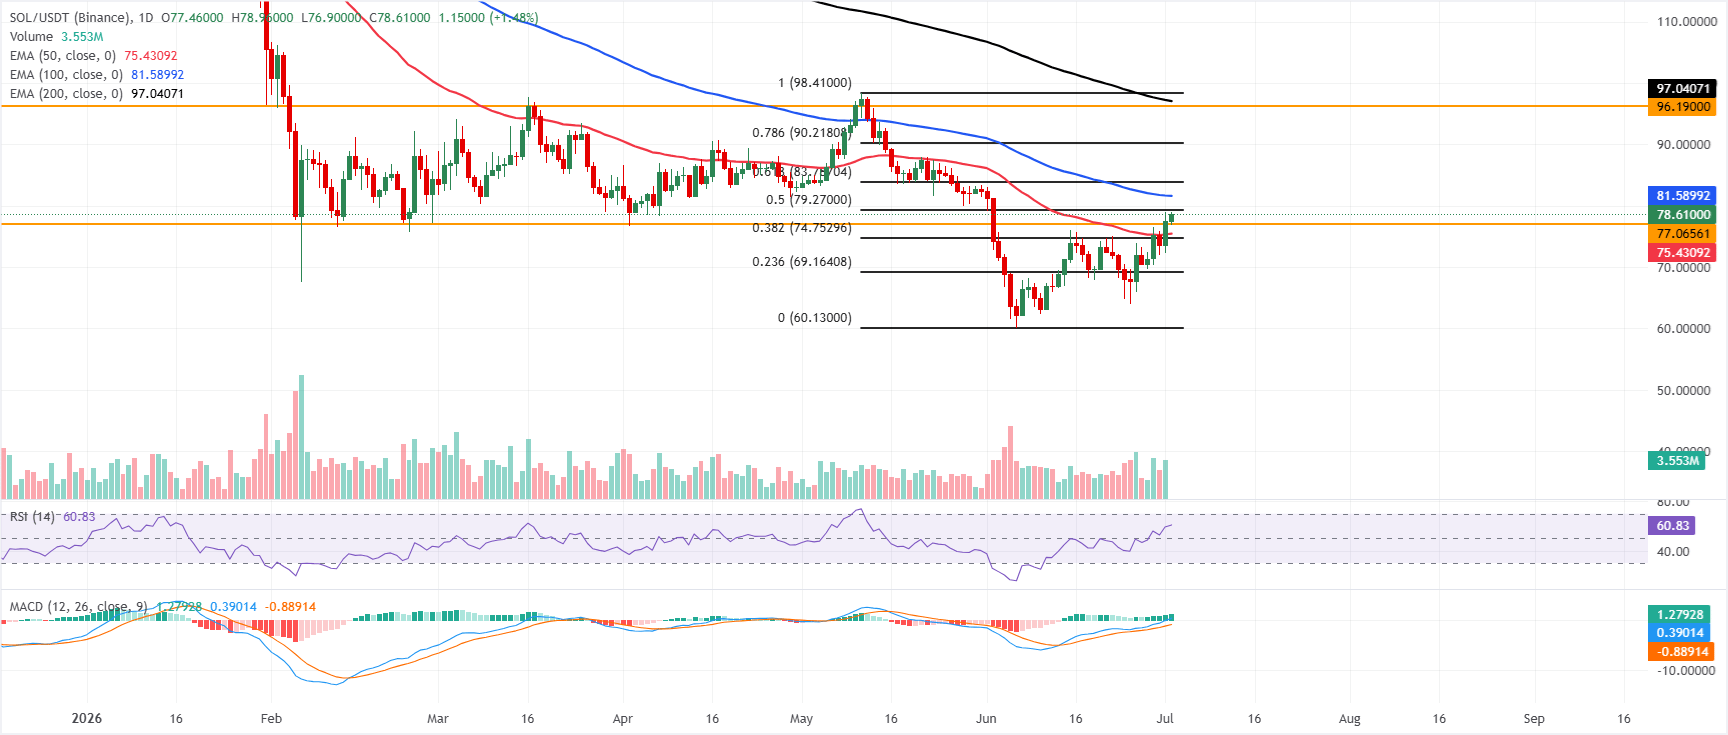
Solana price extends its gains, trading above $78 on Thursday after surging nearly 10% so far this week. However, SOL maintains a cautious tone, trading below the 100-day and 200-day Exponential Moving Averages (EMAs) at $81.58 and $97.04. Meanwhile, SOL holds above the 50-day EMA at $75.43, suggesting some underlying demand, but the 50% retracement of the latest downswing at $79.27 already acts as immediate overhead supply.
Momentum remains constructive, with the Relative Strength Index (RSI) at 60 and the Moving Average Convergence Divergence (MACD) in positive territory, hinting that while higher EMAs cap the broader trend, buyers retain short-term traction.
On the topside, initial resistance stands at the 50% retracement at $79.27, followed by the 100-day EMA at $81.58 and the 61.8% Fibonacci retracement at $83.79. Above these, a stronger barrier emerges at the 78.6% Fibonacci retracement near $90.22, ahead of the horizontal resistance at $96.19 and the 200-day EMA at $97.04.
On the downside, immediate support is seen at the horizontal level around $77.07, with the 50-day EMA at $75.43 and the 38.2% Fibonacci retracement at $74.75 forming a secondary demand zone; a deeper pullback would expose the 23.6% Fibonacci retracement at $69.16.
(The technical analysis of this story was written with the help of an AI tool.)
Nothing in this material constitutes investment advice, personal recommendation, investment research, an offer, or a solicitation to buy or sell any financial instrument. The content has been prepared without consideration of your individual investment objectives, financial situation, or needs, and should not be treated as such.
Past performance is not a reliable indicator of future performance and/or results. Forward-looking scenarios or forecasts are not a guarantee of future performance. Actual results may differ materially from those anticipated.
Mitrade makes no representation or warranty as to the accuracy or completeness of the information provided and accepts no liability for any loss arising from reliance on such information.
Recommended Articles


