



Crypto Today: Bitcoin, Ethereum, XRP extend sideways trading amid ETF outflows, US-Iran war escalation
- Bitcoin trades around $62,500 on Tuesday as ETF outflows surge to $425 million and US-Iran tensions further escalate.
- Ethereum struggles to extend its rebound as the immediate 50-day EMA resistance holds, amid capital outflows.
- XRP remains above the short-term $1.05 support, as momentum indicators signal extended range-bound trading.
The cryptocurrency market continues to trade under pressure despite a mild and broad rebound on Tuesday. Bitcoin (BTC) hovers around $62,500 amid prevalent sideways trading. Meanwhile, major altcoins such as Ethereum (ETH) and Ripple (XRP) are holding above crucial support levels at $1,700 and $1.05, respectively, reflecting ongoing consolidation across the crypto sector.
US-Iran war escalates, weighing on the crypto market
The United States (US) military carried out airstrikes for a third consecutive day on Monday, while Iranian media reported explosions on the islands of Kish, Qeshm, and Abu Musa, as well as in the port city of Bandar Abbas. In retaliation, Iran targeted US military installations in Kuwait, Bahrain, and Jordan, and reportedly attacked two oil supertankers in the Strait of Hormuz.
The US Central Command announced the reinstatement of the blockade of Iranian ports, and President Donald Trump stated that the US would assume the role of “guardian” of the Strait of Hormuz, imposing a 20% toll for secure passage.
In energy markets, West Texas Intermediate (WTI) crude surged nearly 9% on Monday, reaching around $80 per barrel.
Sentiment disintegrates as ETF outflows return
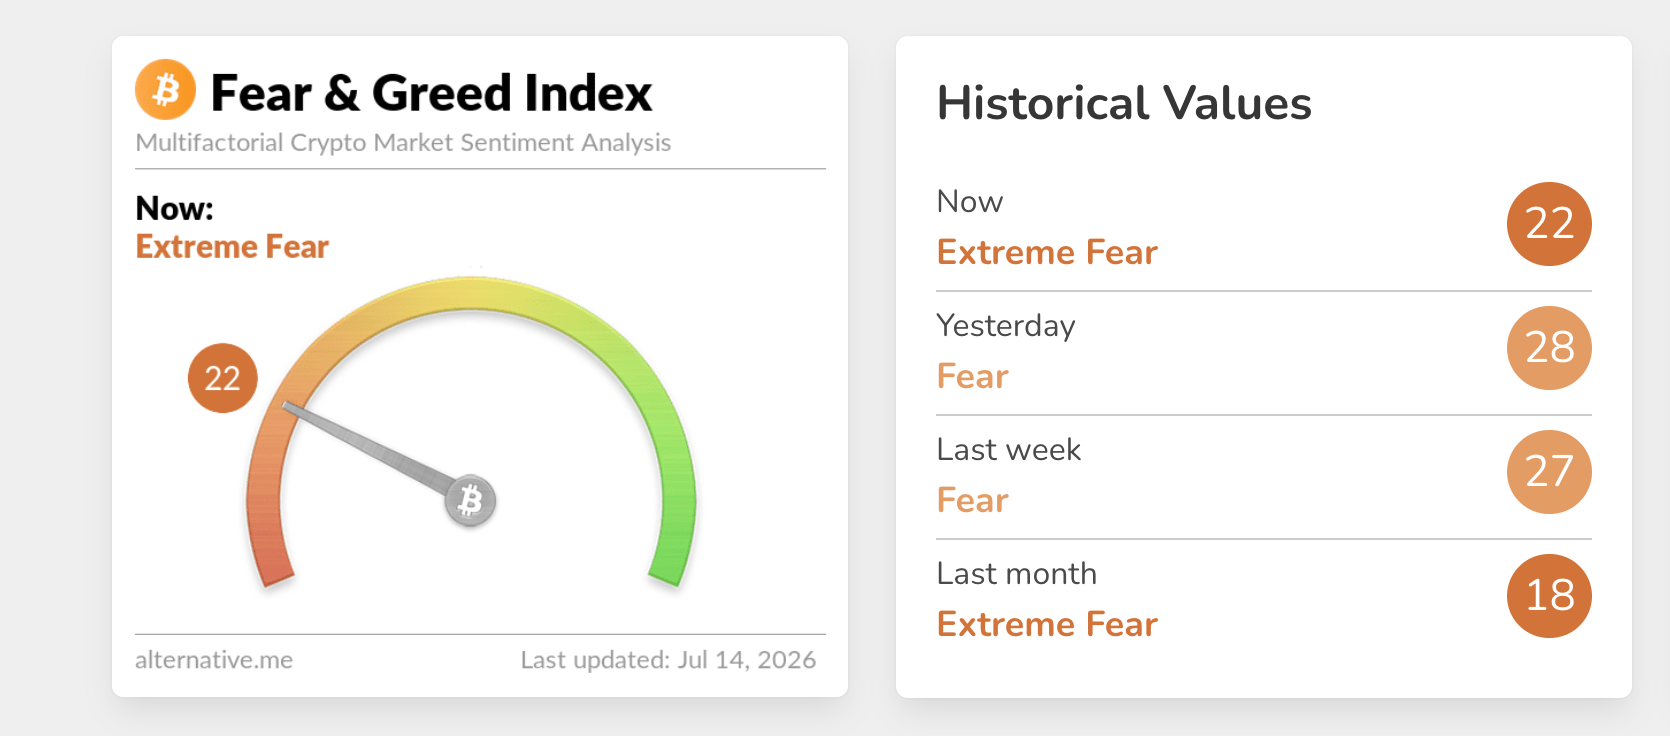
Appetite for risk assets has further deteriorated, as reflected in the crypto Fear & Greed Index, currently embedded in the Extreme Fear territory at 22 on Tuesday, down from 28 the day before.
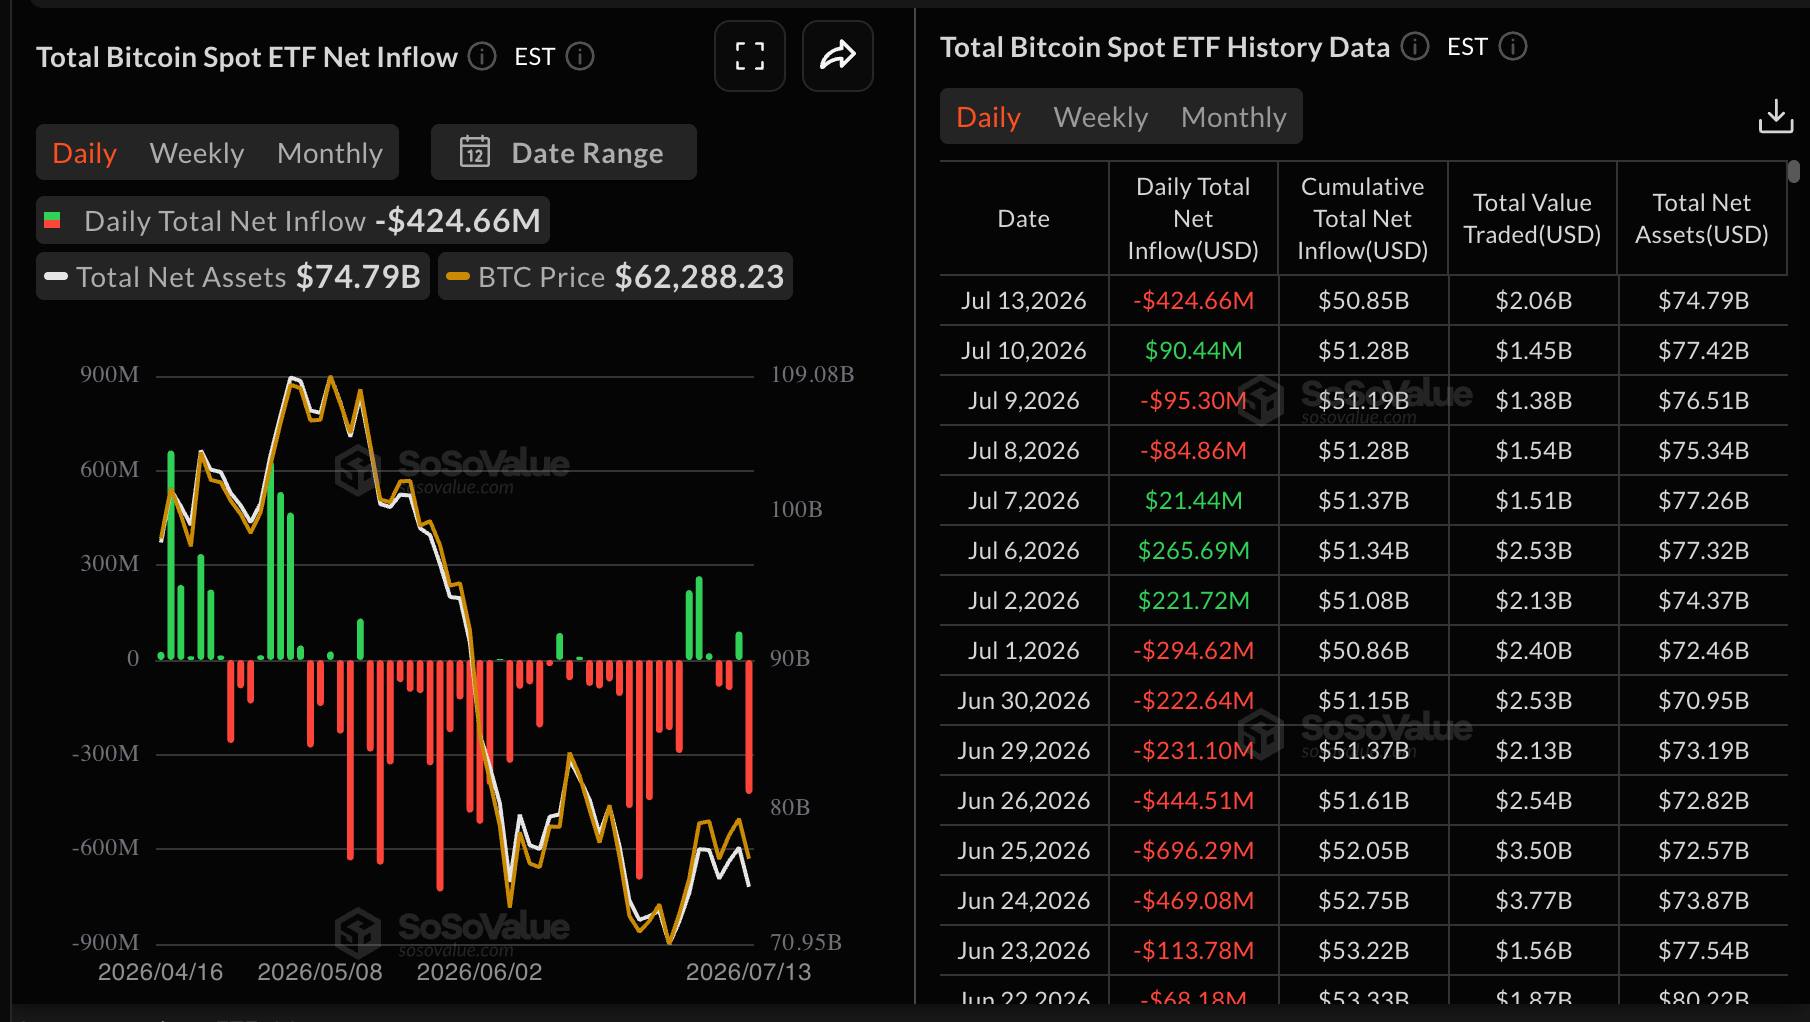
Bitcoin spot Exchange-Traded Funds (ETFs) experienced outflows of roughly $425 million on Monday, the largest since June 26. The massive withdrawal aligns with the weakening sentiment, suggesting that the impact of the US-Iran war remains apparent. If outflows persist, a steady Bitcoin recovery could be a pipe dream, while the odds of an extended drawdown would rise.
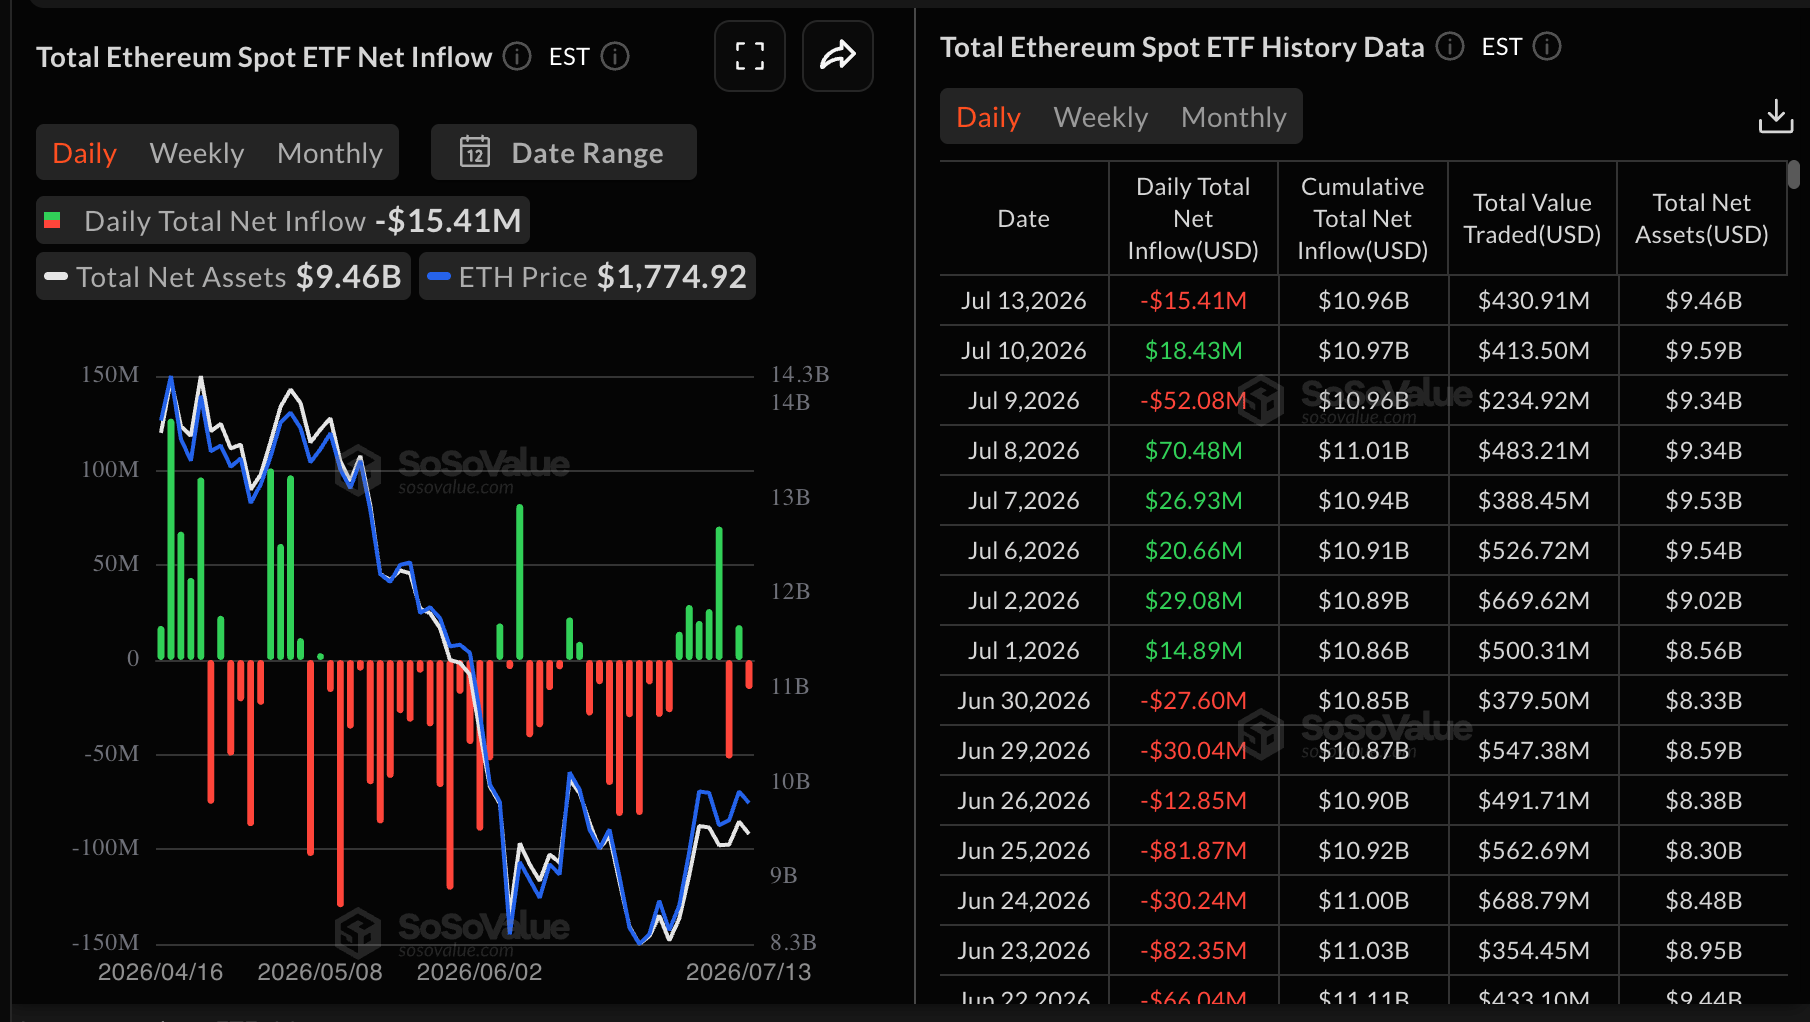
Ethereum spot ETFs mirrored the risk-off sentiment, with outflows totaling $15 million on Monday after $18 million in inflows on Friday.
Despite the latest withdrawal, cumulative outflows stand at $10.96 billion, suggesting that investors still believe Ethereum retains a long-term positive outlook.
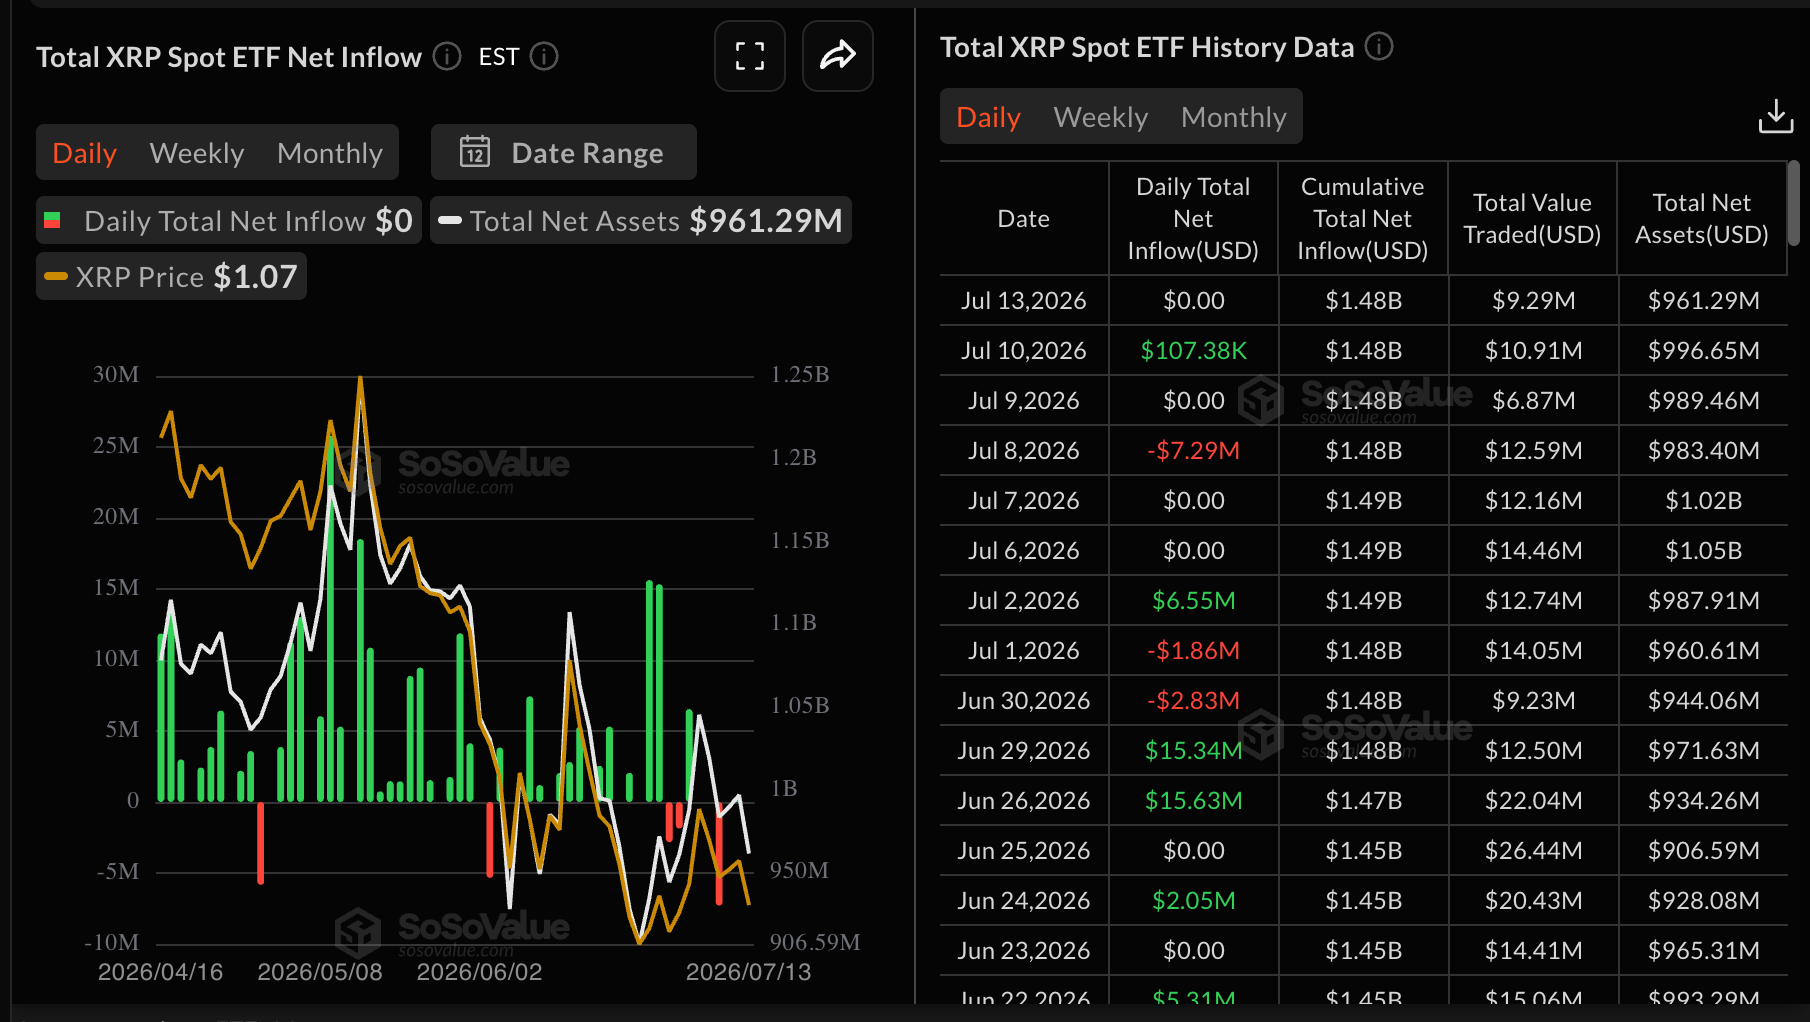
Meanwhile, XRP spot ETFs saw institutional interest deteriorate further on Monday amid muted activity. This comes on the heels of modest $107,000 inflows last Friday, with cumulative deposits holding at $1.48 billion and total net assets at $961 million, highlighting subdued institutional demand in the current climate.
Price analysis: Bitcoin range-bound action persists
Bitcoin trades at $62,598 and remains under clear downside pressure, as price holds decisively below the 50-day, 100-day and 200-day Exponential Moving Averages (EMAs), keeping the broader trend capped. The break above the former downward resistance trendline, now offering support near $61,874, hints at some stabilization, while the Relative Strength Index (RSI) at 47 stays slightly below neutral and the Moving Average Convergence Divergence (MACD) indicator maintains positive territory, together suggesting a mild but not decisive improvement in short-term momentum against a still bearish structural backdrop.
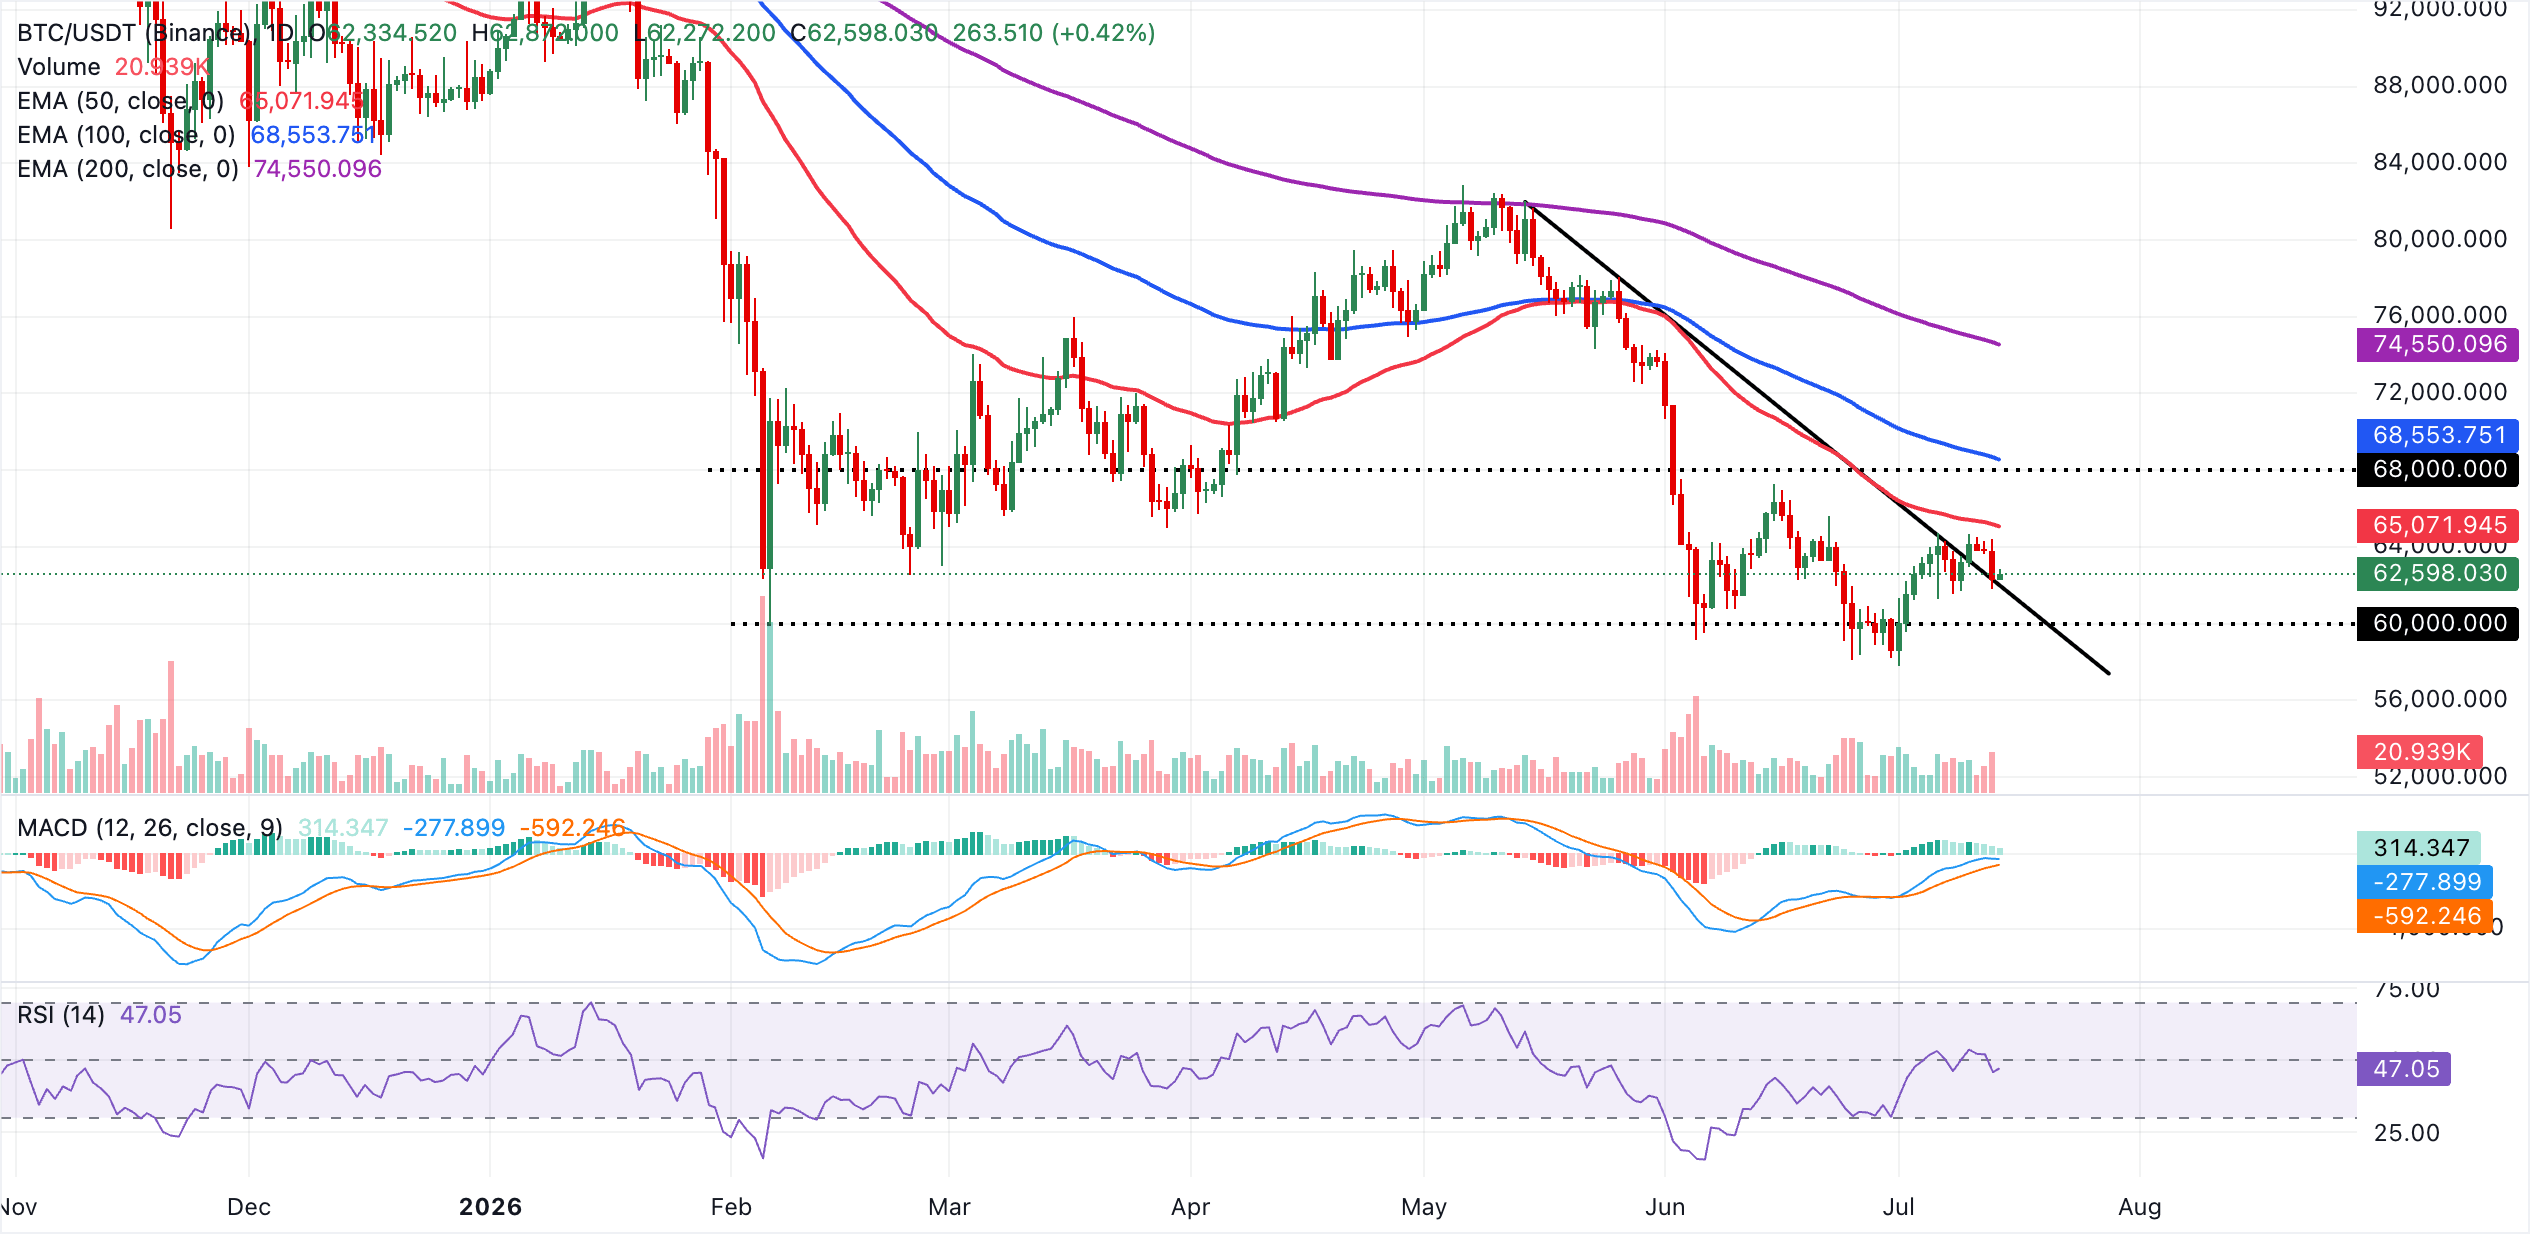
Initial resistance lies at the 50-day EMA around $65,072, followed by the 100-day EMA at $68,554, with the 200-day EMA at $74,550 acting as a more distant barrier and key level that bulls would need to reclaim to revive a sustained uptrend. On the downside, immediate support aligns with the trendline break zone at $61,874, and a daily close back below this area would likely expose the pair to renewed selling pressure and a deeper pullback within the prevailing bearish framework.
Altcoins outlook: Ethereum and XRP hold key support levels
Ethereum trades around $1,780, holding below its moving averages, which keep the near-term bias bearish. The RSI at 55 sits slightly above neutral, hinting at modest recovery attempts, while the MACD shows a fading but positive histogram, suggesting that bullish momentum is losing traction beneath these stacked resistances.
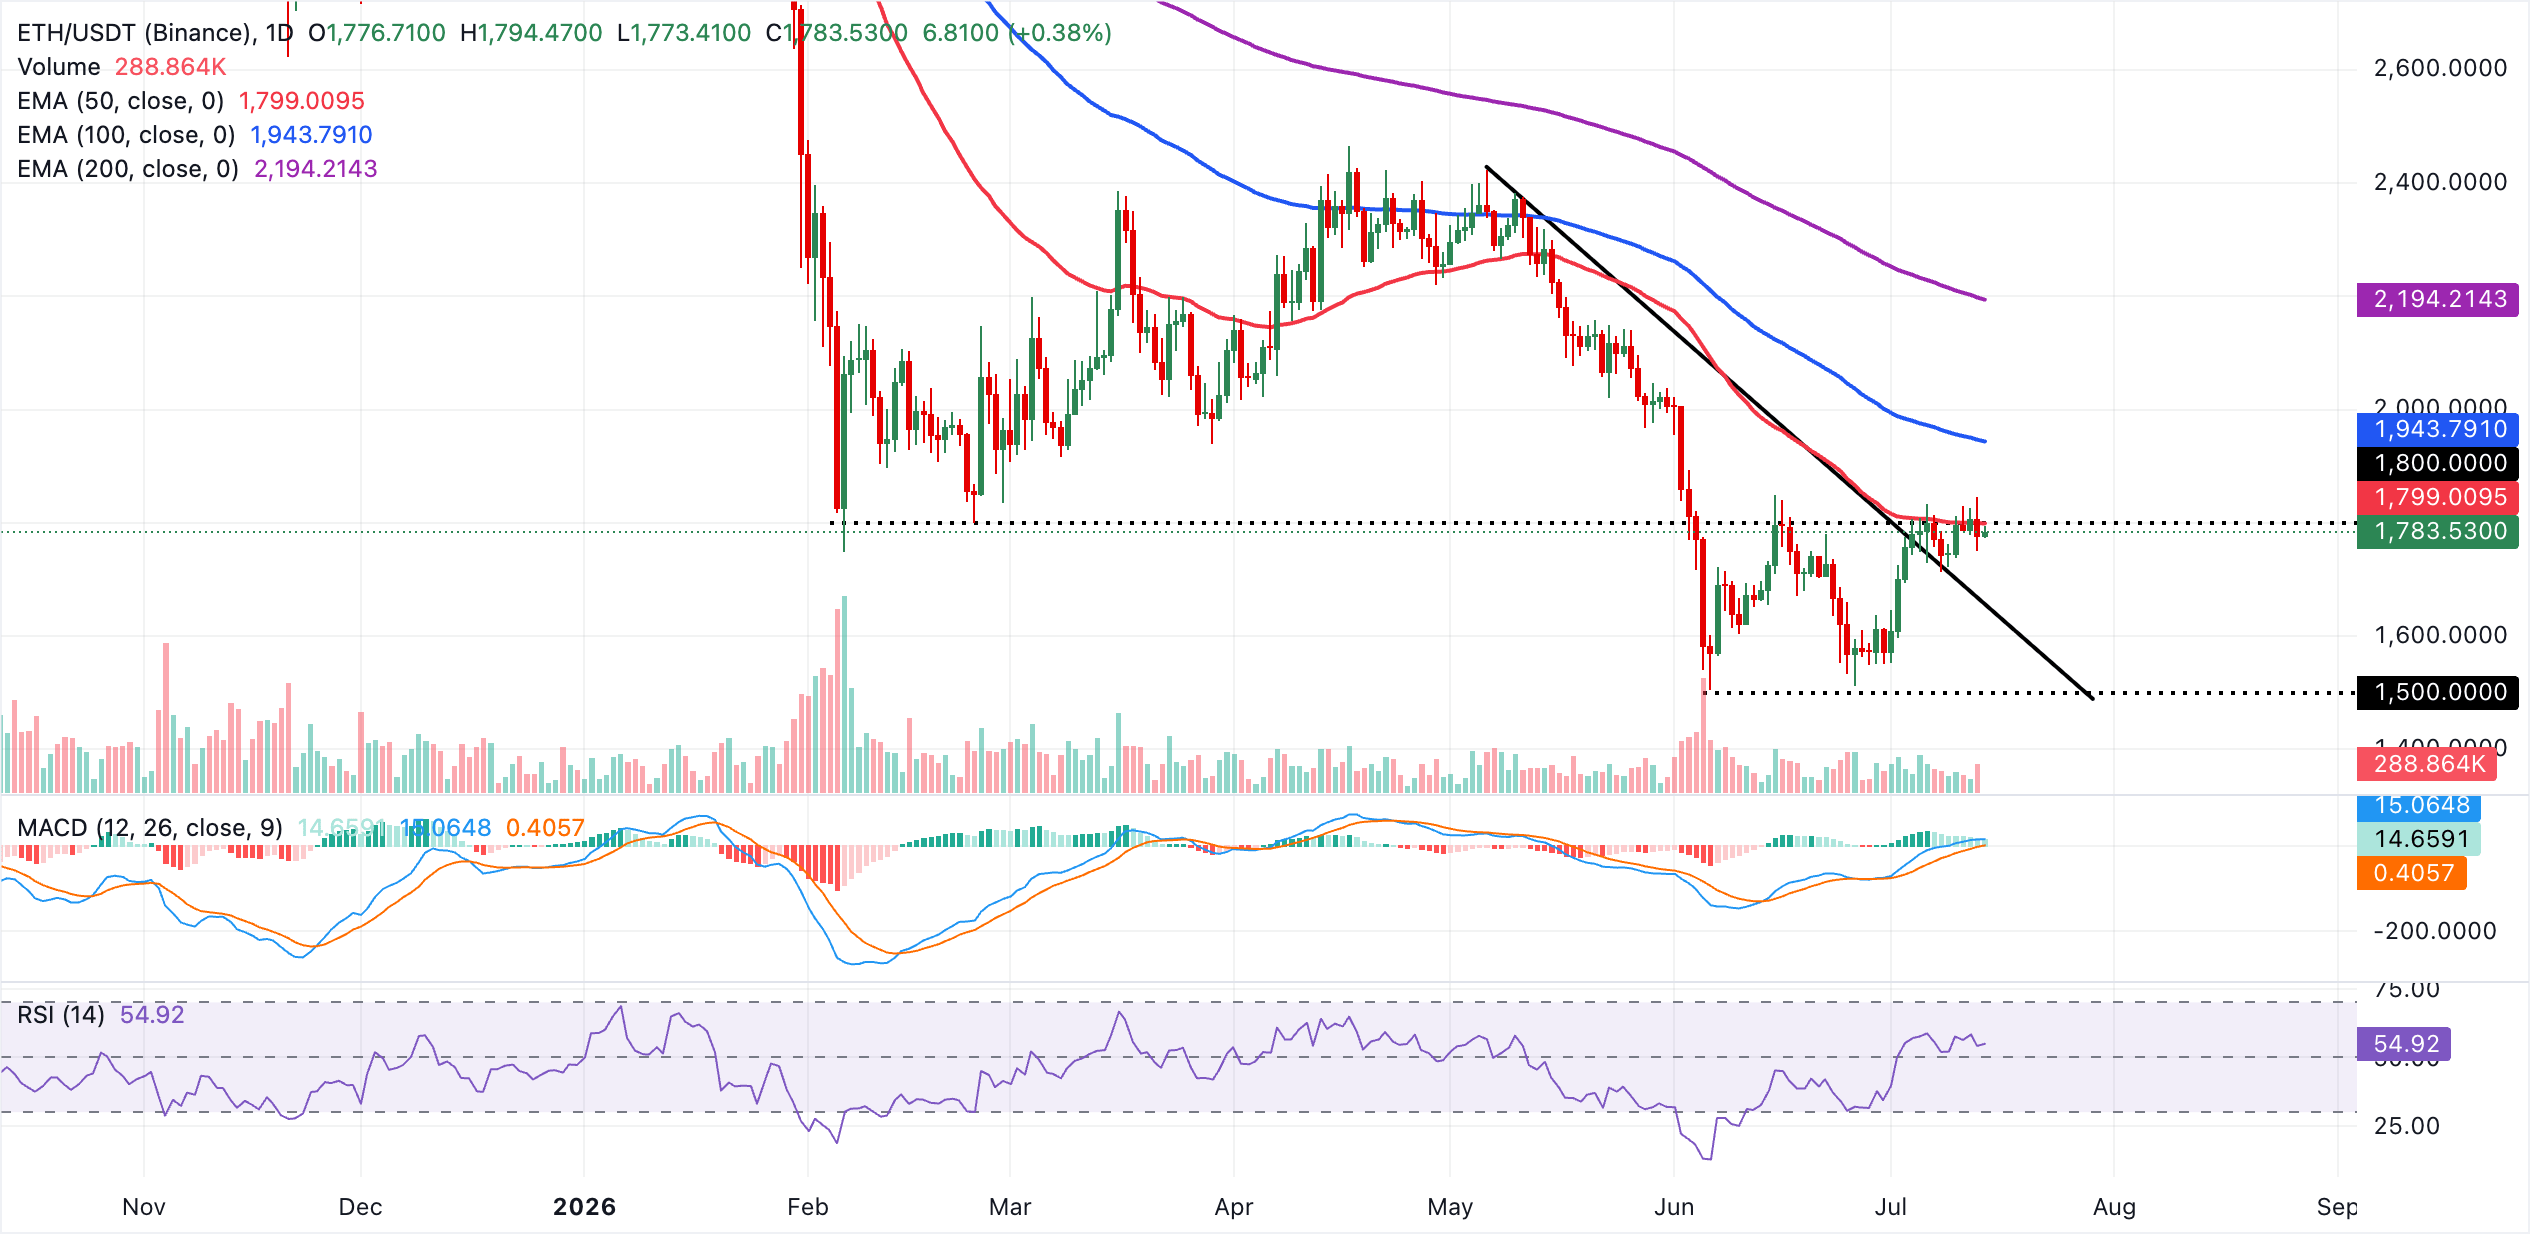
Immediate resistance is aligned at the 50-day EMA near $1,799, followed by the 100-day EMA at about $1,944 and then the 200-day EMA around $2,194, forming a dense ceiling that ETH would need to reclaim to materially shift the trend. On the downside, the descending trendline’s break area around $1,653 now acts as the next notable support, where a retreat could pause. A daily close below this zone would likely open the door to a deeper pullback despite the current, only mildly constructive momentum backdrop.
XRP, on the other hand, trades at $1.07, extending a bearish near-term bias as price holds beneath the 50-day, 100-day and 200-day EMAs at $1.16, $1.26 and $1.47 respectively. The pair has recently slipped back below the broken downtrend resistance reference around $1.11, keeping the recovery capped.
Momentum is mixed, with the RSI indicator hovering near 40 in a subdued stance and the MACD flattening just above zero with a modestly positive line but fading histogram, which together suggest waning upside pressure rather than a decisive reversal.
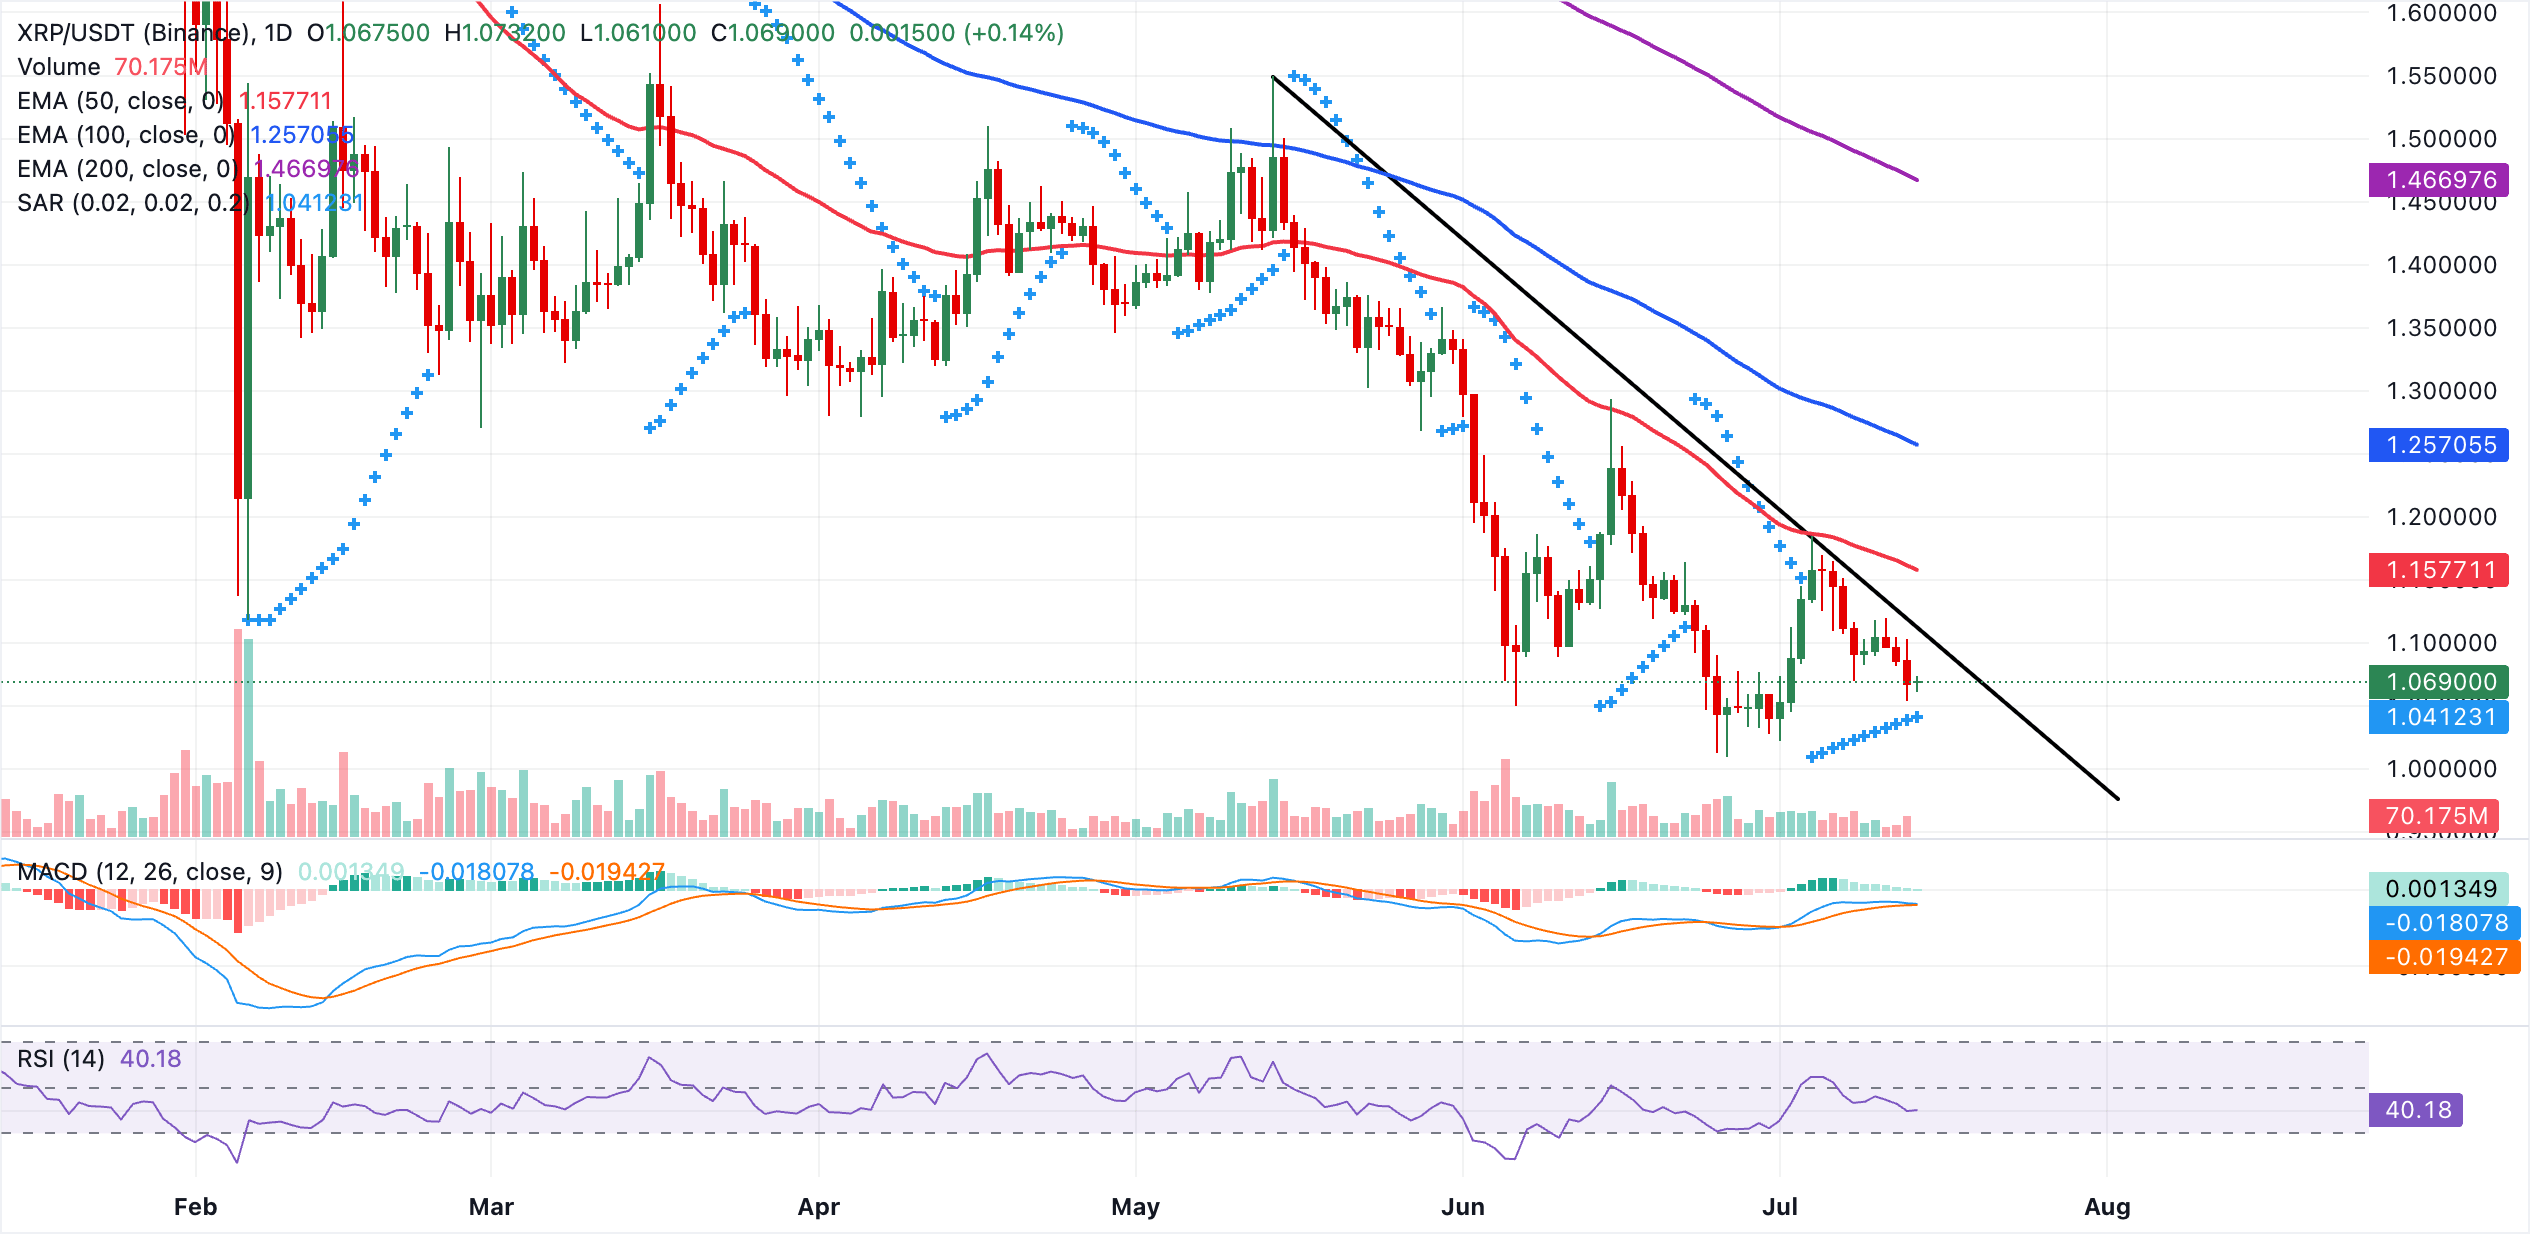
On the topside, initial resistance emerges at the trendline break area around $1.11, ahead of the 50-day EMA at $1.16, where a daily close above would be needed to ease immediate bearish pressure. Further up, the 100-day EMA at $1.26 acts as a secondary barrier before the broader downtrend context defined by the 200-day EMA at $1.47. On the downside, the Parabolic SAR at $1.04 forms the nearest support zone. A clear break below this level would open the door for a deeper pullback, while holding above it keeps scope for a corrective bounce toward the mentioned resistance levels.
(The technical analysis of this story was written with the help of an AI tool. Know more.)
Crypto ETF FAQs
An Exchange-Traded Fund (ETF) is an investment vehicle or an index that tracks the price of an underlying asset. ETFs can not only track a single asset, but a group of assets and sectors. For example, a Bitcoin ETF tracks Bitcoin’s price. ETF is a tool used by investors to gain exposure to a certain asset.
Yes. The first Bitcoin futures ETF in the US was approved by the US Securities & Exchange Commission in October 2021. A total of seven Bitcoin futures ETFs have been approved, with more than 20 still waiting for the regulator’s permission. The SEC says that the cryptocurrency industry is new and subject to manipulation, which is why it has been delaying crypto-related futures ETFs for the last few years.
Yes. The SEC approved in January 2024 the listing and trading of several Bitcoin spot Exchange-Traded Funds, opening the door to institutional capital and mainstream investors to trade the main crypto currency. The decision was hailed by the industry as a game changer.
The main advantage of crypto ETFs is the possibility of gaining exposure to a cryptocurrency without ownership, reducing the risk and cost of holding the asset. Other pros are a lower learning curve and higher security for investors since ETFs take charge of securing the underlying asset holdings. As for the main drawbacks, the main one is that as an investor you can’t have direct ownership of the asset, or, as they say in crypto, “not your keys, not your coins.” Other disadvantages are higher costs associated with holding crypto since ETFs charge fees for active management. Finally, even though investing in ETFs reduces the risk of holding an asset, price swings in the underlying cryptocurrency are likely to be reflected in the investment vehicle too.
Nothing in this material constitutes investment advice, personal recommendation, investment research, an offer, or a solicitation to buy or sell any financial instrument. The content has been prepared without consideration of your individual investment objectives, financial situation, or needs, and should not be treated as such.
Past performance is not a reliable indicator of future performance and/or results. Forward-looking scenarios or forecasts are not a guarantee of future performance. Actual results may differ materially from those anticipated.
Mitrade makes no representation or warranty as to the accuracy or completeness of the information provided and accepts no liability for any loss arising from reliance on such information.
Recommended Articles


