



Bitcoin Price Forecast: BTC advances amid ETF inflows, but oil-driven inflation fears limit upside
- Bitcoin reclaims the $64,000 mark on Tuesday after a mild correction the previous day.
- US-listed BTC spot ETFs attracted $170.09 million on Monday after recording net outflows the previous week.
- Uncertainty surrounding US-Iran peace talks is driving a recovery in crude oil prices, keeping inflation concerns elevated and limiting BTC’s upside potential.
Bitcoin (BTC) reclaims the $64,000 mark on Tuesday after a mild correction in the previous session. Improving institutional demand offers some support to BTC, but uncertainty surrounding US-Iran peace talks and recovering crude oil prices keep inflation concerns elevated, limiting the Crypto King’s upside.
Uncertainty over US-Iran peace talks lifts inflation concerns
The growing uncertainty over US-Iran peace talks continues to weigh on investors’ risk sentiment. On Monday, Tehran denied that any negotiations were taking place with Washington, sparking an angry backlash from US President Donald Trump, who had cited the resumption of bilateral talks as justification for calling off attacks over the weekend. Moreover, Iran’s Islamic Revolutionary Guard Corps (IRGC) has reportedly attacked a US military base in Kuwait with at least three drones.
In addition, a senior adviser to Iran’s Supreme Leader, Mohsen Rezaee, dismissed Trump’s claims that the Strait of Hormuz is on course to reopen. Rezaee further warned that Iran will not permit any unauthorized shipping route through the critical waterway other than the one designated by the Islamic Republic and that Tehran would target American warships for that purpose.
On the other hand, Iran-backed Houthi rebels’ naval blockade against Saudi Arabia added to a wider regional conflict, keeping the geopolitical risk premium in play and supporting crude oil prices.
These geopolitical tensions have heightened concerns that rising energy prices could reignite inflationary pressures and push the Federal Reserve (Fed) toward a more hawkish stance.
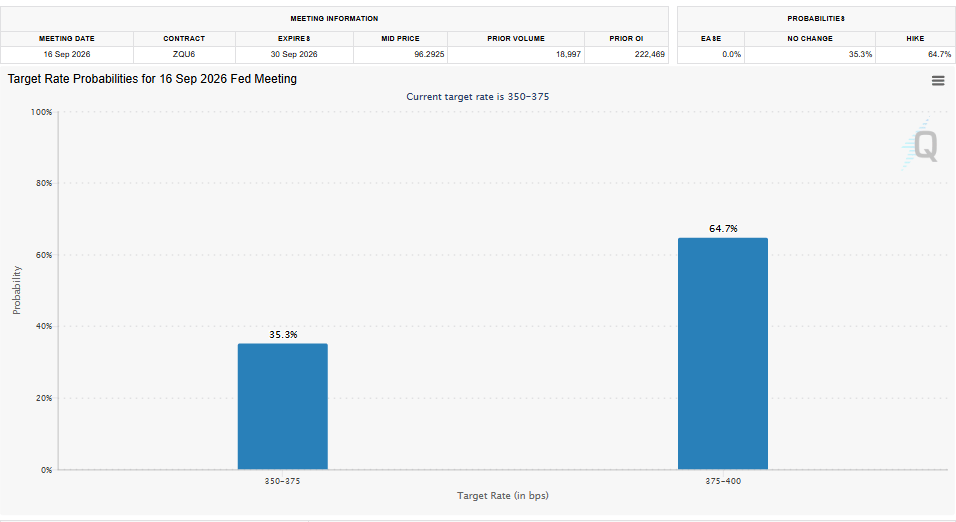
According to the CME FedWatch Tool, market participants are currently pricing in a 64.7% probability of a Fed rate hike in September. The expectations were reinforced by Monday’s US ISM Manufacturing PMI data release, which showed that manufacturing activity rose to its highest level in more than four years in July. The stronger figure supports the US Dollar (USD) and weighs on risk appetite, limiting BTC upside.
Institutional demand shows early signs of comeback
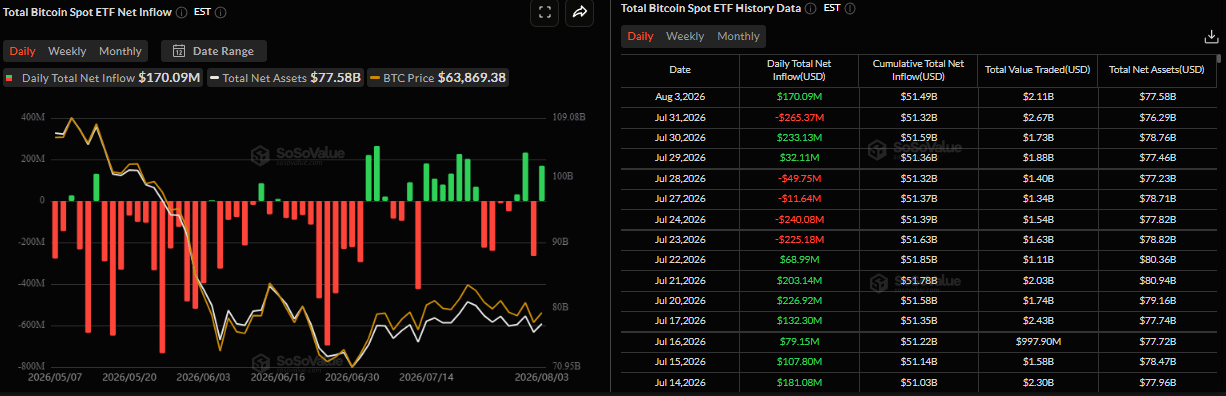
Institutional demand began the week on a positive note. SoSoValue data show that spot BTC ETFs recorded an inflow of $170.09 million on Monday after net outflows of $61.53 million last week. If these inflows continue and intensify, BTC could see a recovery.
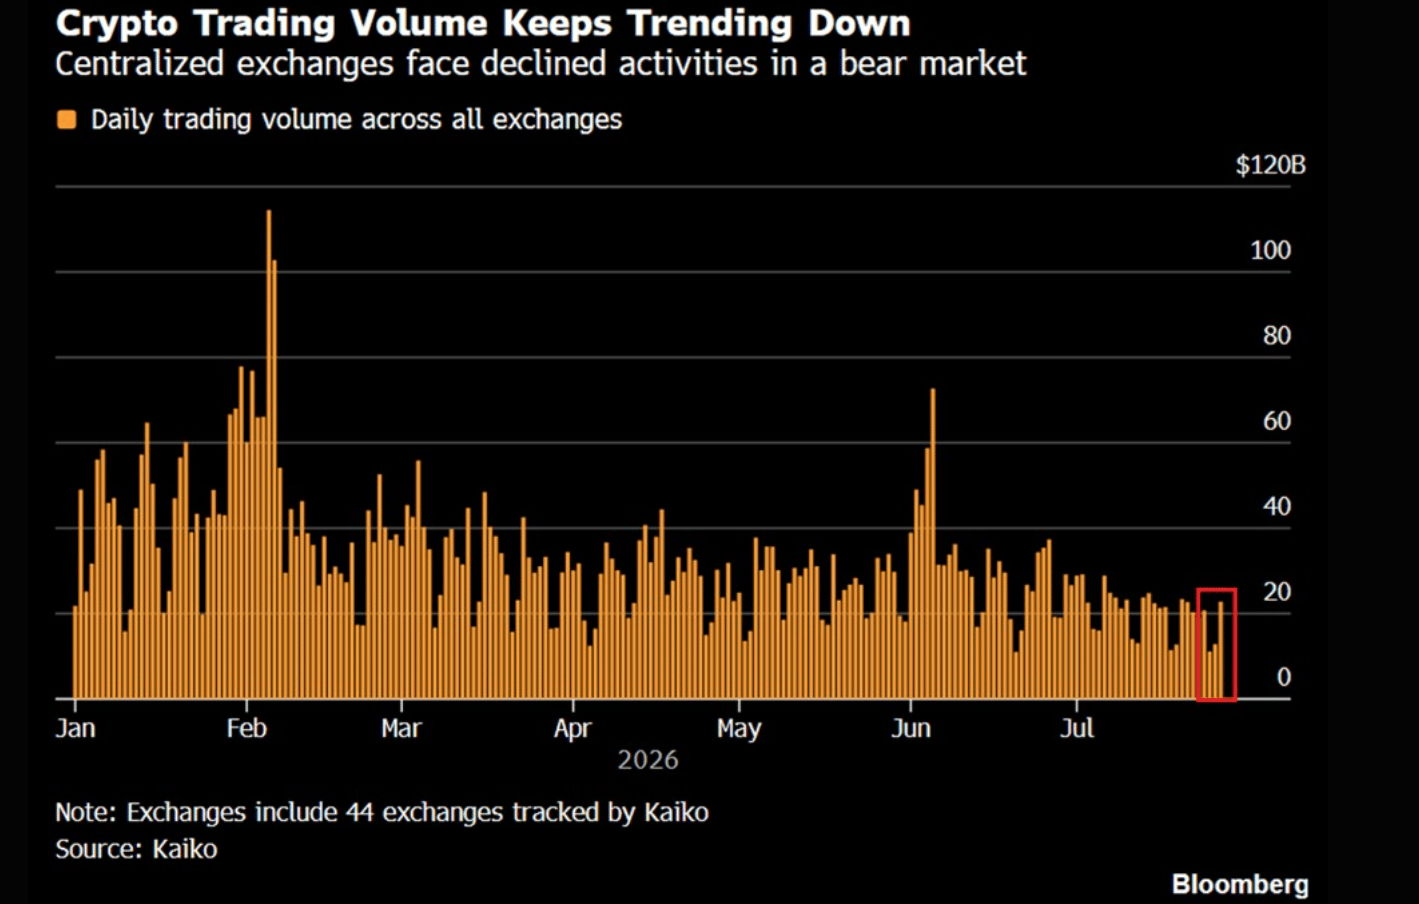
The chart below shows a sharp decline in crypto trading activity, pointing to weakening market liquidity. Daily trading volume across the 44 spot crypto exchanges tracked by Kaiko fell to $15 billion last week, the lowest level of the year and 70% below January’s peak. Moreover, the average daily volume has also declined 50% since December 2025 to $20 billion, marking its lowest level this year and indicating drying liquidity across the crypto market.
Bitcoin technical outlook: Mixed sentiment emerges among traders
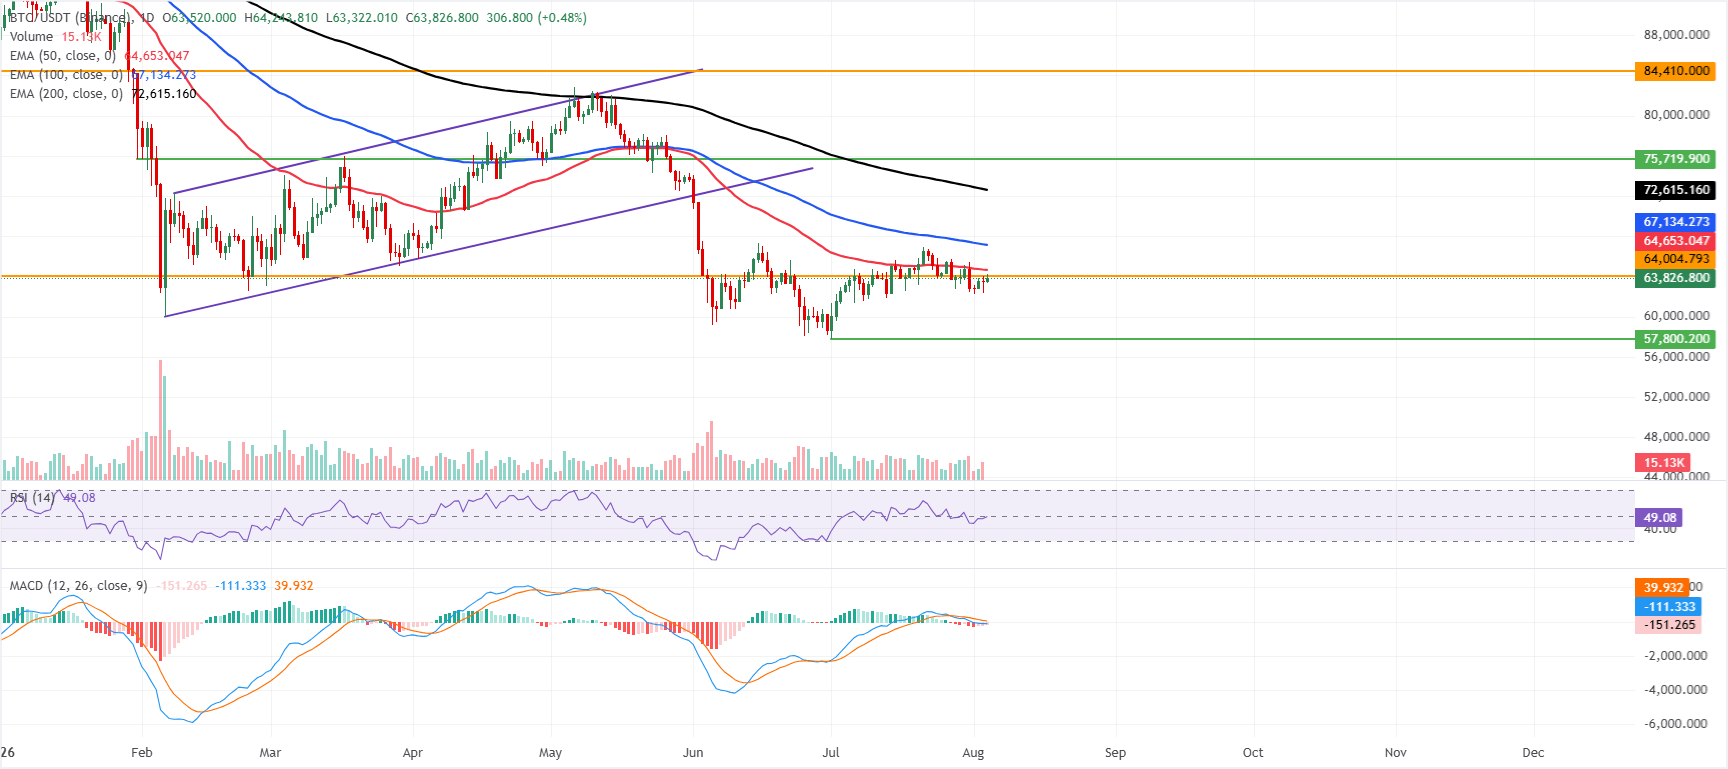
Bitcoin trades at $63,800 on Tuesday, retaining a bearish near‑term bias as price sits below the key Exponential Moving Averages (EMAs). The 50‑day EMA at $64,653, the 100‑day EMA at $67,134 and the 200‑day EMA at $72,615 all hover overhead, suggesting that recent bounces remain corrective within a broader capped structure.
Momentum is mixed, with the Relative Strength Index (RSI) indicator hovering near a neutral 49 on the daily chart. At the same time, the Moving Average Convergence Divergence (MACD) stays below zero with negative readings, hinting that downside pressure still outweighs bullish attempts.
On the topside, immediate resistance is seen at the horizontal level drawn around $64,004, closely followed by the 50‑day EMA at $64,653 as the first technical barrier to any recovery. Above that, the 100‑day EMA at $67,134 and the 200‑day EMA at $72,615 form a wider supply band before the longer‑term horizontal cap near $84,410 comes into play.
On the downside, immediate support emerges at the psychological level around $60,000, with rejection below this band keeping BTC vulnerable to further weakness.
(The technical analysis of this story was written with the help of an AI tool. Know more.)
Cryptocurrency prices FAQs
Token launches influence demand and adoption among market participants. Listings on crypto exchanges deepen the liquidity for an asset and add new participants to an asset’s network. This is typically bullish for a digital asset.
A hack is an event in which an attacker captures a large volume of the asset from a DeFi bridge or hot wallet of an exchange or any other crypto platform via exploits, bugs or other methods. The exploiter then transfers these tokens out of the exchange platforms to ultimately sell or swap the assets for other cryptocurrencies or stablecoins. Such events often involve an en masse panic triggering a sell-off in the affected assets.
Macroeconomic events like the US Federal Reserve’s decision on interest rates influence crypto assets mainly through the direct impact they have on the US Dollar. An increase in interest rate typically negatively influences Bitcoin and altcoin prices, and vice versa. If the US Dollar index declines, risk assets and associated leverage for trading gets cheaper, in turn driving crypto prices higher.
Halvings are typically considered bullish events as they slash the block reward in half for miners, constricting the supply of the asset. At consistent demand if the supply reduces, the asset’s price climbs.
Nothing in this material constitutes investment advice, personal recommendation, investment research, an offer, or a solicitation to buy or sell any financial instrument. The content has been prepared without consideration of your individual investment objectives, financial situation, or needs, and should not be treated as such.
Past performance is not a reliable indicator of future performance and/or results. Forward-looking scenarios or forecasts are not a guarantee of future performance. Actual results may differ materially from those anticipated.
Mitrade makes no representation or warranty as to the accuracy or completeness of the information provided and accepts no liability for any loss arising from reliance on such information.
Recommended Articles


