



Bitcoin vs Gold Overview: XAU tests breakout, BTC slides as Trump claims Iran negotiations
- US President Trump says he is “semi-negotiating” with Iran as economic pressure continues to build.
- Bitcoin falls below $65,000 as it slips under the 50-day EMA, capping immediate upside.
- Gold appears poised to extend its breakout above key moving averages, supported by a bullish MACD signal.
The cryptocurrency market shows signs of trimming gains accrued last week as Bitcoin (BTC) slides below $65,000 at the time of writing on Monday. Meanwhile, Gold (XAU/USD) maintains a bullish outlook, hovering above $4,350.
Trump claims negotiations with Iran as Oil prices climb
United States (US) President Donald Trump has said that he is “semi-negotiating” with Iran and that he was going to let economic pressure pile on the country, according to a CBS News report. However, Tehran maintains that it is not actively engaging the US in talks.
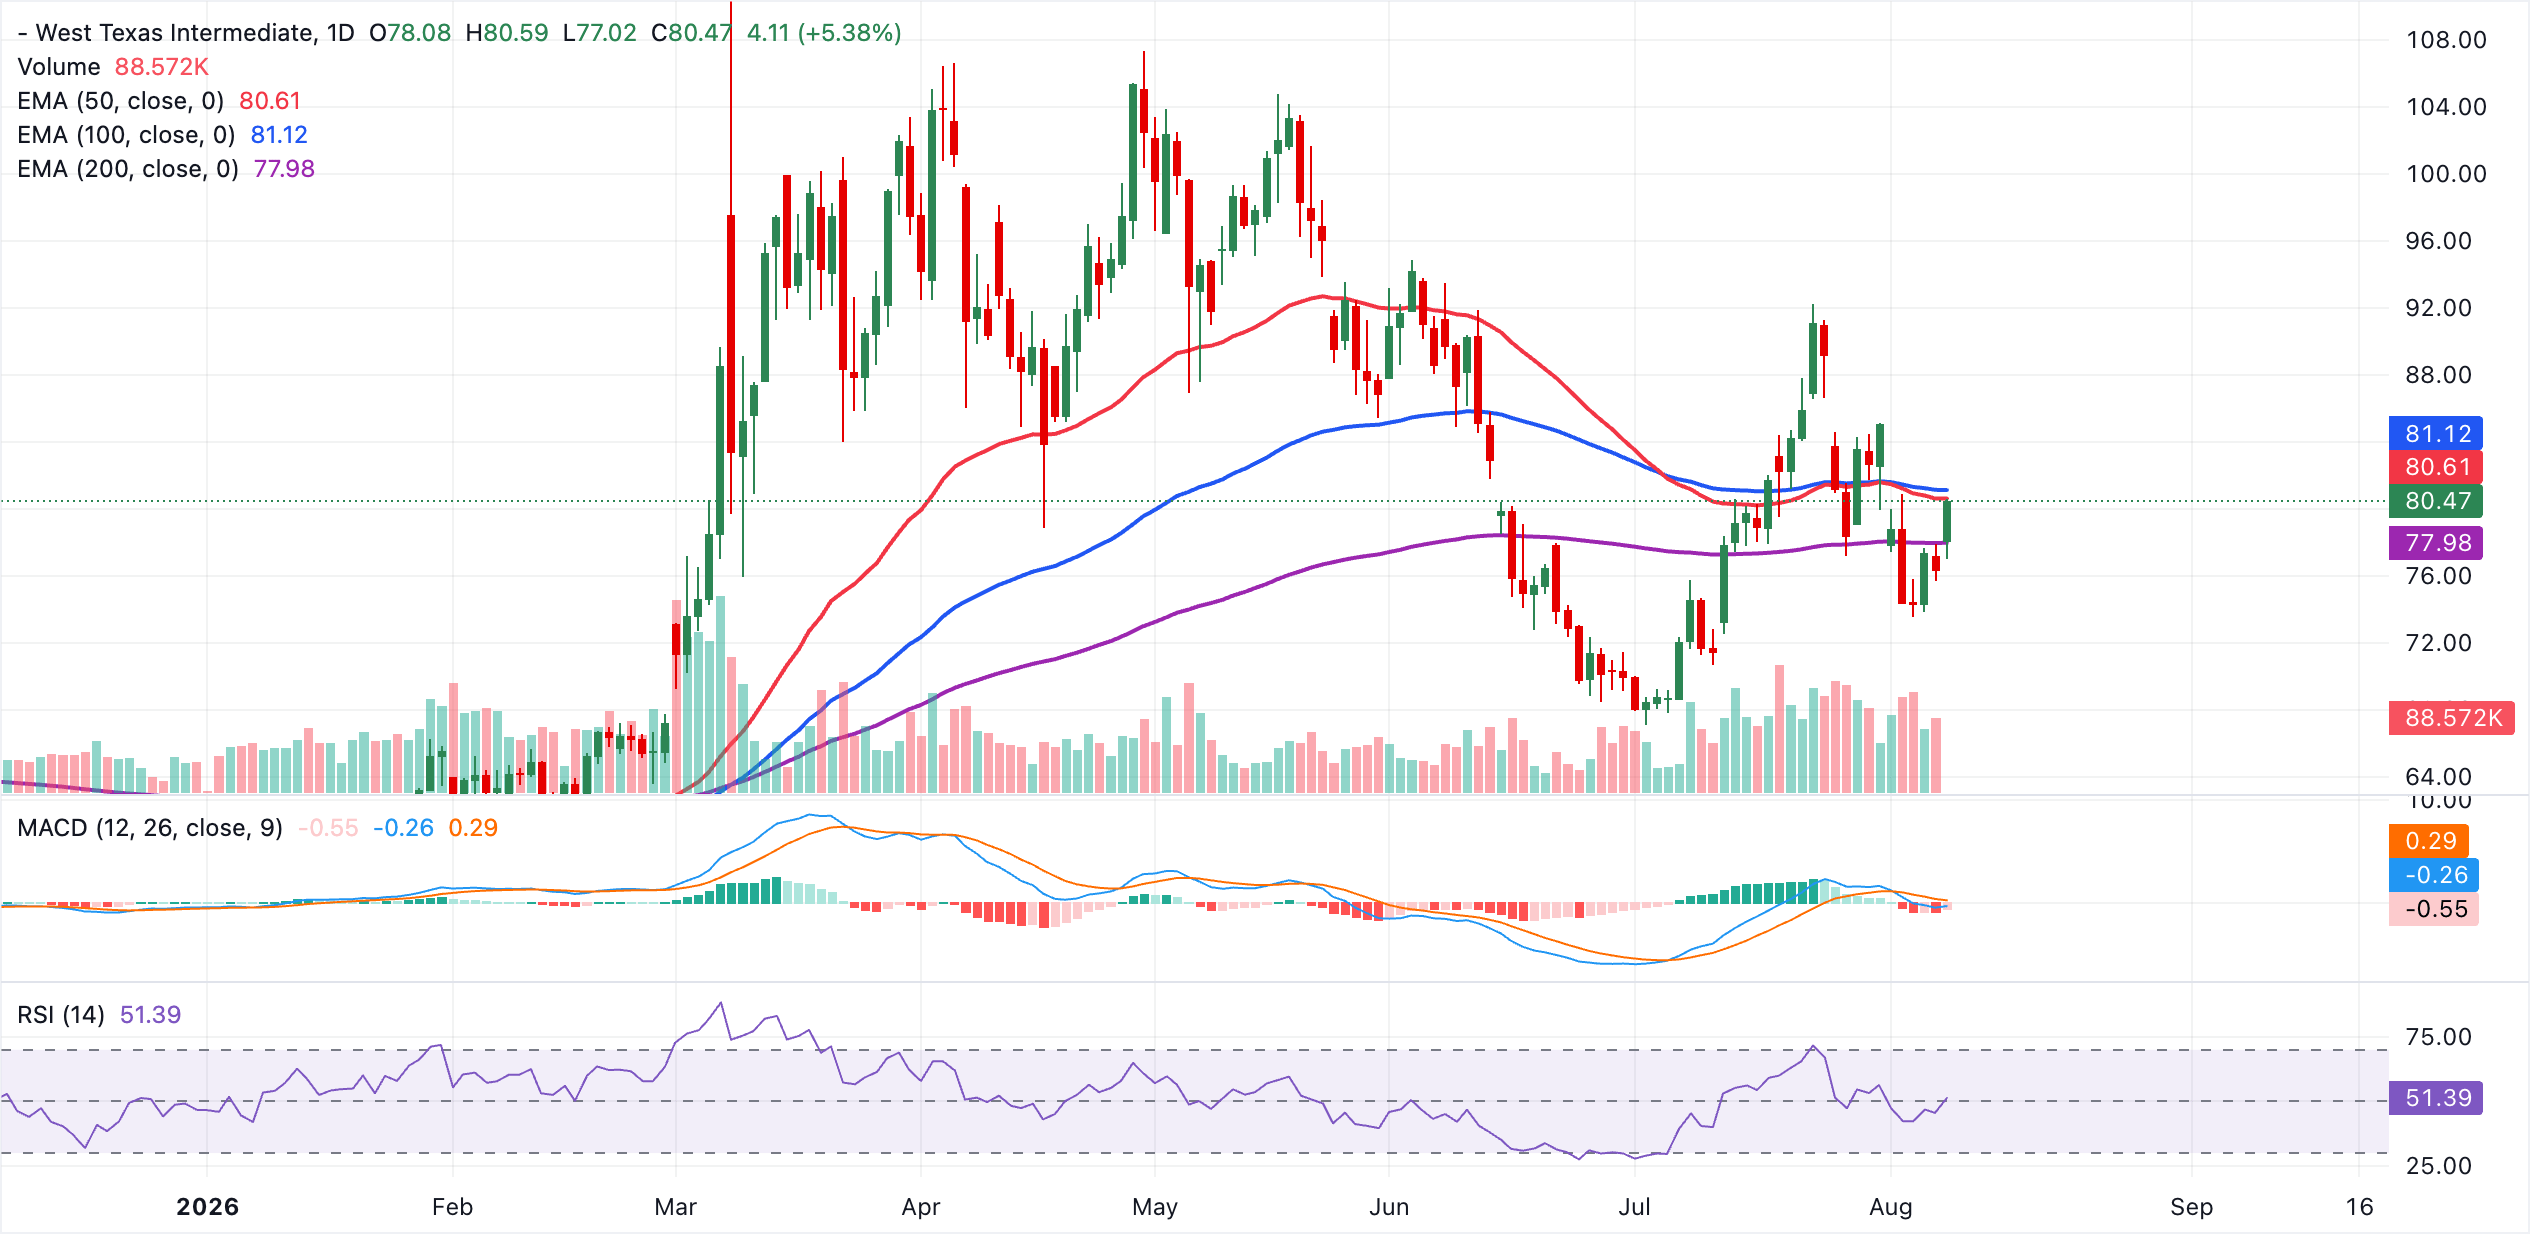
Oil prices have continued to surge, breaking above $80 per barrel of Crude as per West Texas Intermediate (WTI) pricing. Iran has emphasized that the strategic talks with Oman to reopen the Strait of Hormuz will not suffice unless the US meets a set of conditions, including compensation for war damages.
Technical analysis: Bitcoin falters as headwinds intensify
Bitcoin trades at $64,482, maintaining a mildly bearish bias as it remains capped beneath the 50-day Exponential Moving Average (EMA) at $64,674, the 100-day EMA at $66,869 and the 200-day EMA at $72,359. The pair is still holding above the upward-sloping trendline support from $57,828, suggesting the broader structure is consolidative rather than outright deteriorating, while the Relative Strength Index (RSI) around 51 and a slightly positive Moving Average Convergence Divergence (MACD) reading hint at stabilizing, but not yet impulsive, upside momentum.
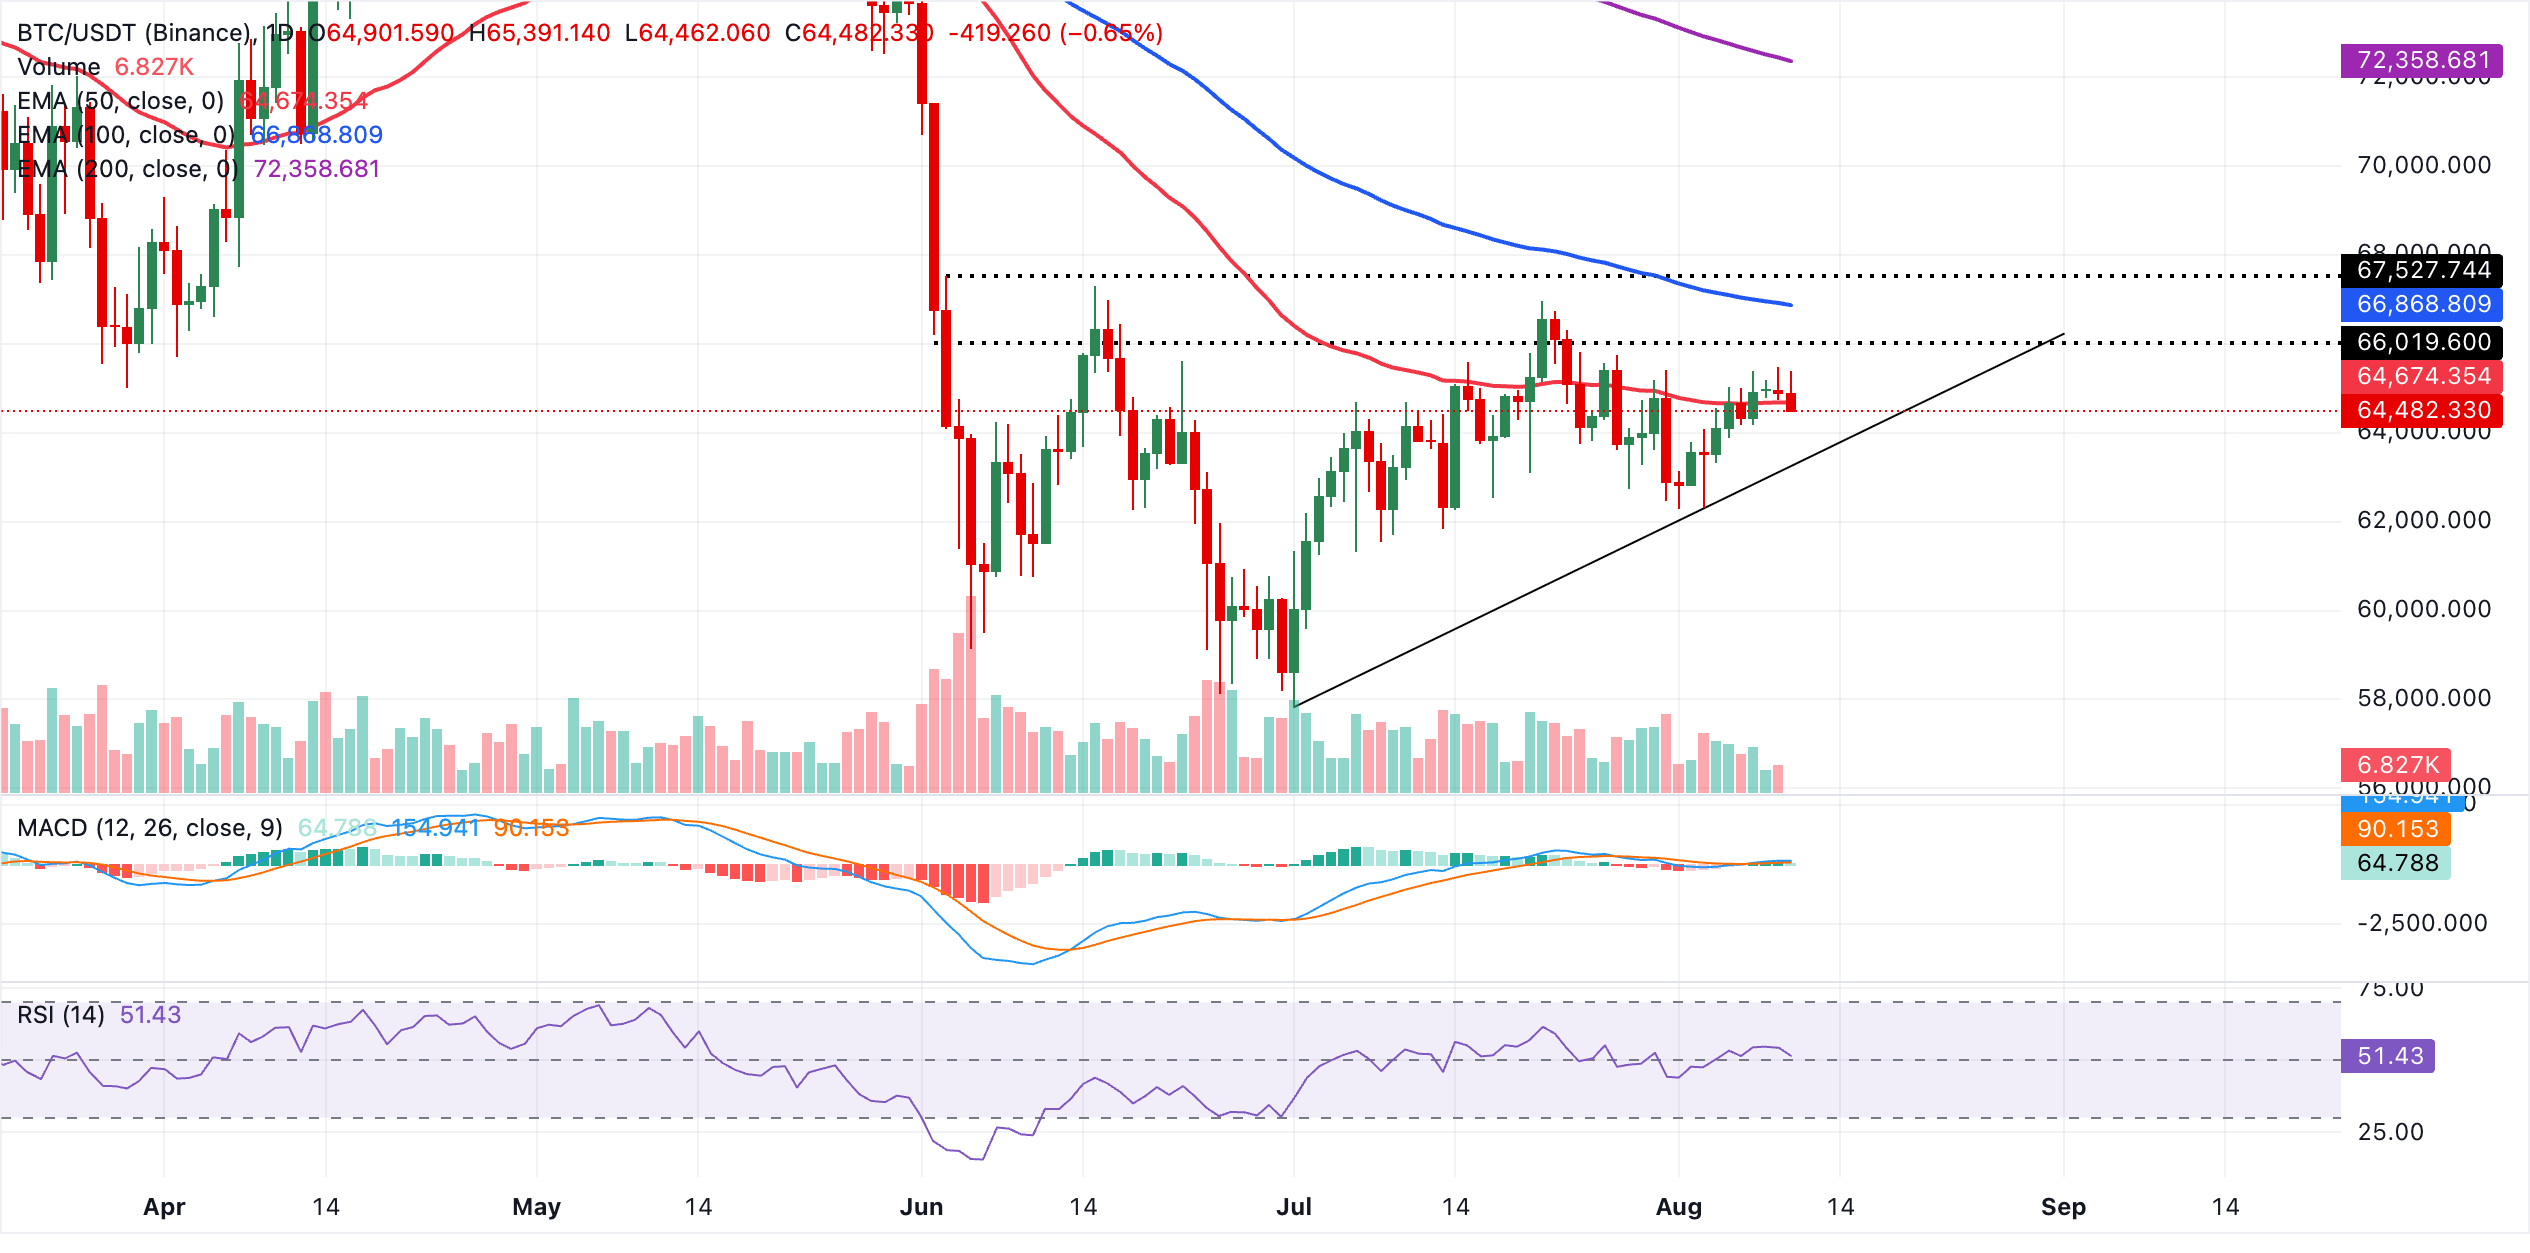
Immediate resistance lies at the 50-day EMA, followed by the 100-day EMA and then the more distant 200-day EMA, which together form a dense overhead supply zone that bulls would need to reclaim to re-establish an uptrend. On the downside, the first meaningful support emerges at the rising trendline around $63,332.
A daily close below this floor would expose lower levels and reinforce the current bearish tone despite the still-neutral readings in momentum indicators.
"Bitcoin pressing $65,000, toward the top of a range it has barely left in a month, is not the boring non-event it appears. Over the past 30 days the entire high-to-low spread has been just 9.3%, the tightest such window since August 2023 and one of only a handful this decade. Markets do not stay this compressed. The relevant question is not whether the range breaks, but which way," Yusuf Fakhro, Partner at ARP Digital, said.
Gold buyers tighten grip as higher support holds
Gold trades around $3,350, holding above the 50-day, 100-day and 200-day EMAs. This outlook reinforces a constructive near-term bias after reclaiming these trend metrics. The downward resistance trendline drawn from the $5,602 peak still looms overhead, with its break price at roughly $4,453 acting as the next cap.
Momentum is constructive as the RSI hovers in the mid-60s and the MACD remains firmly positive, suggesting buyers retain control while acknowledging proximity to overbought territory.
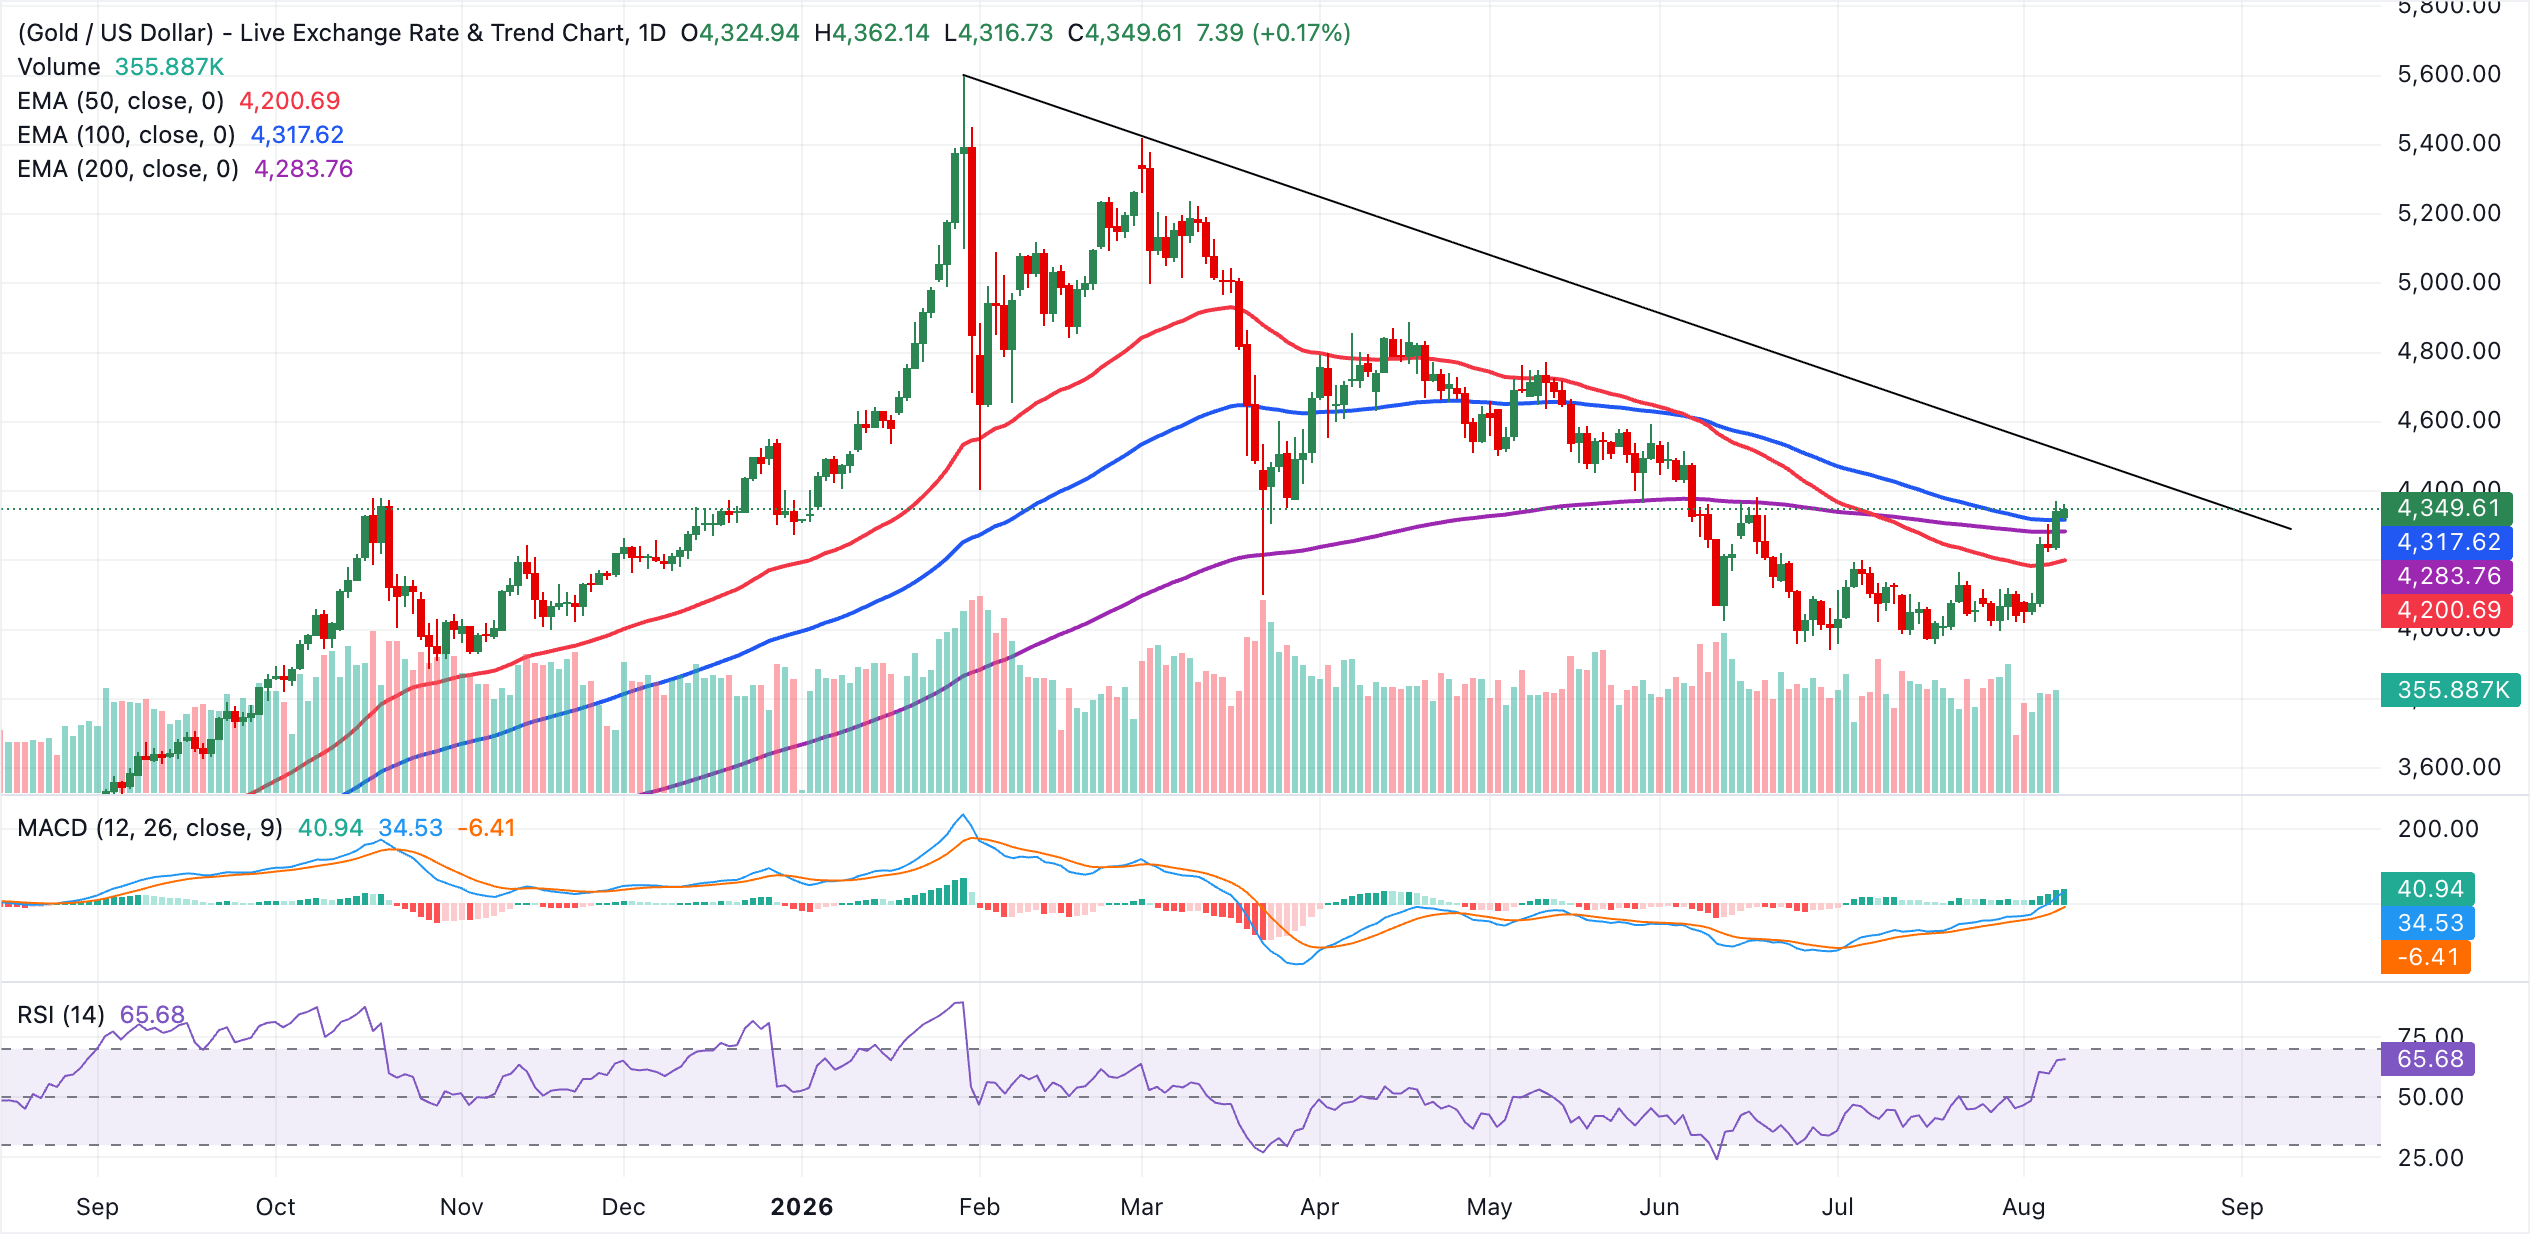
On the topside, immediate resistance is seen at the descending trendline break zone around $4,453, and a clear daily close above this barrier would open the way for further gains toward untested highs. On the downside, initial support is defined by the recent pivot at $4,350, with additional demand emerging at the 100-day EMA near $4,318 and the 200-day EMA around $4,284. A deeper pullback toward the 50-day EMA close to $4,201 would still keep the broader advance intact while offering a lower entry zone for dip buyers.
"The main risk is a renewed inflation shock that pushes rate expectations higher again and sends the dollar and real yields up. Short of that, I think this move has further to run, and miners are where I would expect the strongest percentage gains if gold continues higher," Shawn Young, MEXC Research Chief Analyst, said.
(The technical analysis of this story was written with the help of an AI tool. Know more.)
Bitcoin, altcoins, stablecoins FAQs
Bitcoin is the largest cryptocurrency by market capitalization, a virtual currency designed to serve as money. This form of payment cannot be controlled by any one person, group, or entity, which eliminates the need for third-party participation during financial transactions.
Altcoins are any cryptocurrency apart from Bitcoin, but some also regard Ethereum as a non-altcoin because it is from these two cryptocurrencies that forking happens. If this is true, then Litecoin is the first altcoin, forked from the Bitcoin protocol and, therefore, an “improved” version of it.
Stablecoins are cryptocurrencies designed to have a stable price, with their value backed by a reserve of the asset it represents. To achieve this, the value of any one stablecoin is pegged to a commodity or financial instrument, such as the US Dollar (USD), with its supply regulated by an algorithm or demand. The main goal of stablecoins is to provide an on/off-ramp for investors willing to trade and invest in cryptocurrencies. Stablecoins also allow investors to store value since cryptocurrencies, in general, are subject to volatility.
Bitcoin dominance is the ratio of Bitcoin's market capitalization to the total market capitalization of all cryptocurrencies combined. It provides a clear picture of Bitcoin’s interest among investors. A high BTC dominance typically happens before and during a bull run, in which investors resort to investing in relatively stable and high market capitalization cryptocurrency like Bitcoin. A drop in BTC dominance usually means that investors are moving their capital and/or profits to altcoins in a quest for higher returns, which usually triggers an explosion of altcoin rallies.
Nothing in this material constitutes investment advice, personal recommendation, investment research, an offer, or a solicitation to buy or sell any financial instrument. The content has been prepared without consideration of your individual investment objectives, financial situation, or needs, and should not be treated as such.
Past performance is not a reliable indicator of future performance and/or results. Forward-looking scenarios or forecasts are not a guarantee of future performance. Actual results may differ materially from those anticipated.
Mitrade makes no representation or warranty as to the accuracy or completeness of the information provided and accepts no liability for any loss arising from reliance on such information.
Recommended Articles


