



Pi Network Price Forecast: PI holds at key support as broader market declines
- Pi Network holds steady around $0.08745 on Tuesday after two consecutive days of losses.
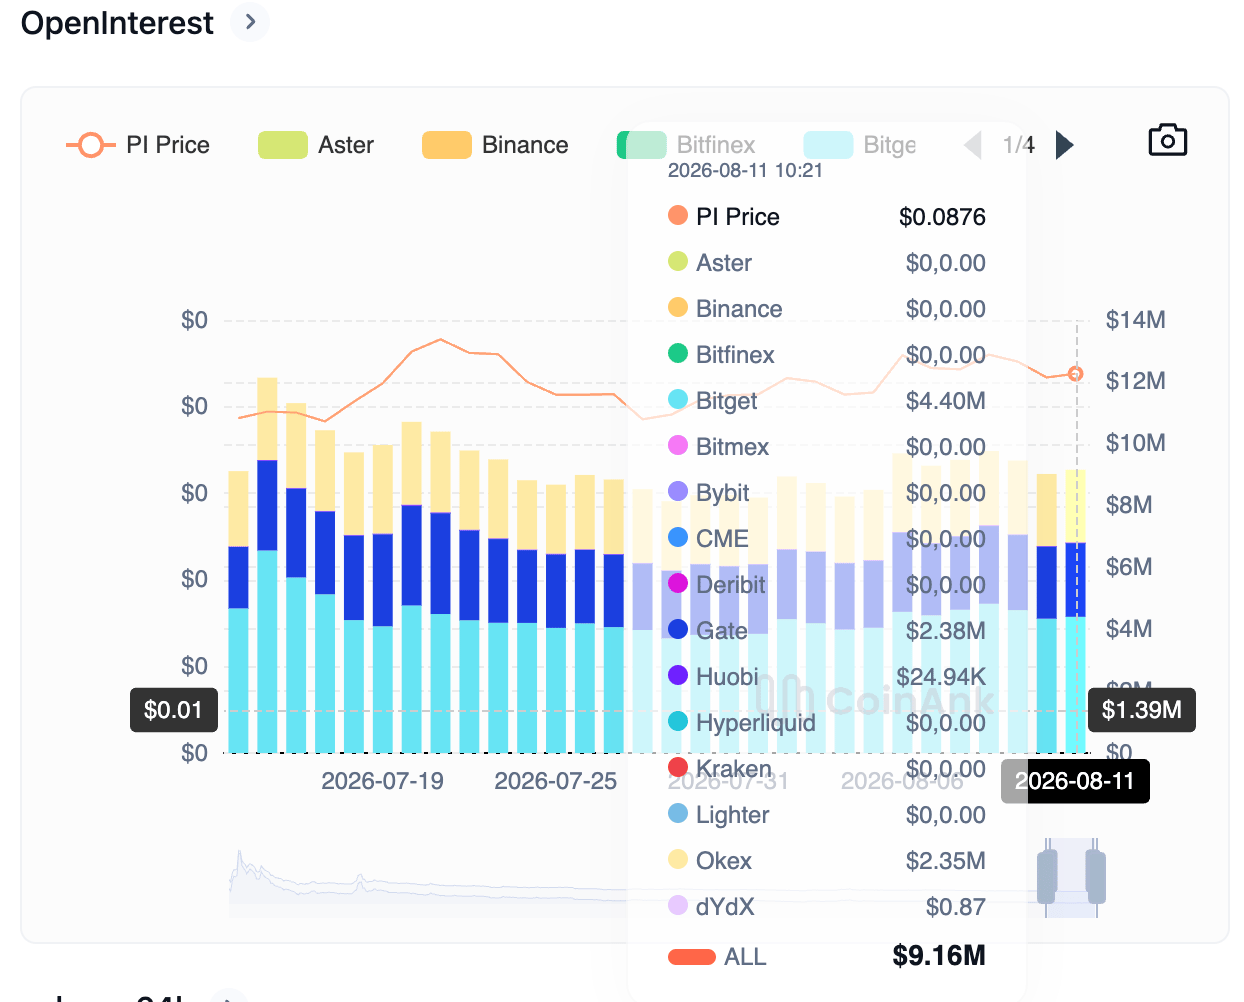
- PI futures Open Interest remains at $9.16 million as the broader crypto market sentiment deteriorates.
- The technical outlook for PI suggests a mild downside bias as momentum remains neutral to bearish.
Pi Network (PI) steadies around $0.08745 on Tuesday after two consecutive days of losses, capped below the $0.1000 psychological threshold. Retail demand in PI derivatives remains firm, with Open Interest above $9 million, even as broader crypto market sentiment wanes. Technically, PI faces a steeper correction, as it lacks upside momentum to support a near-term recovery.
Demand in PI futures holds firm amid declining market sentiment
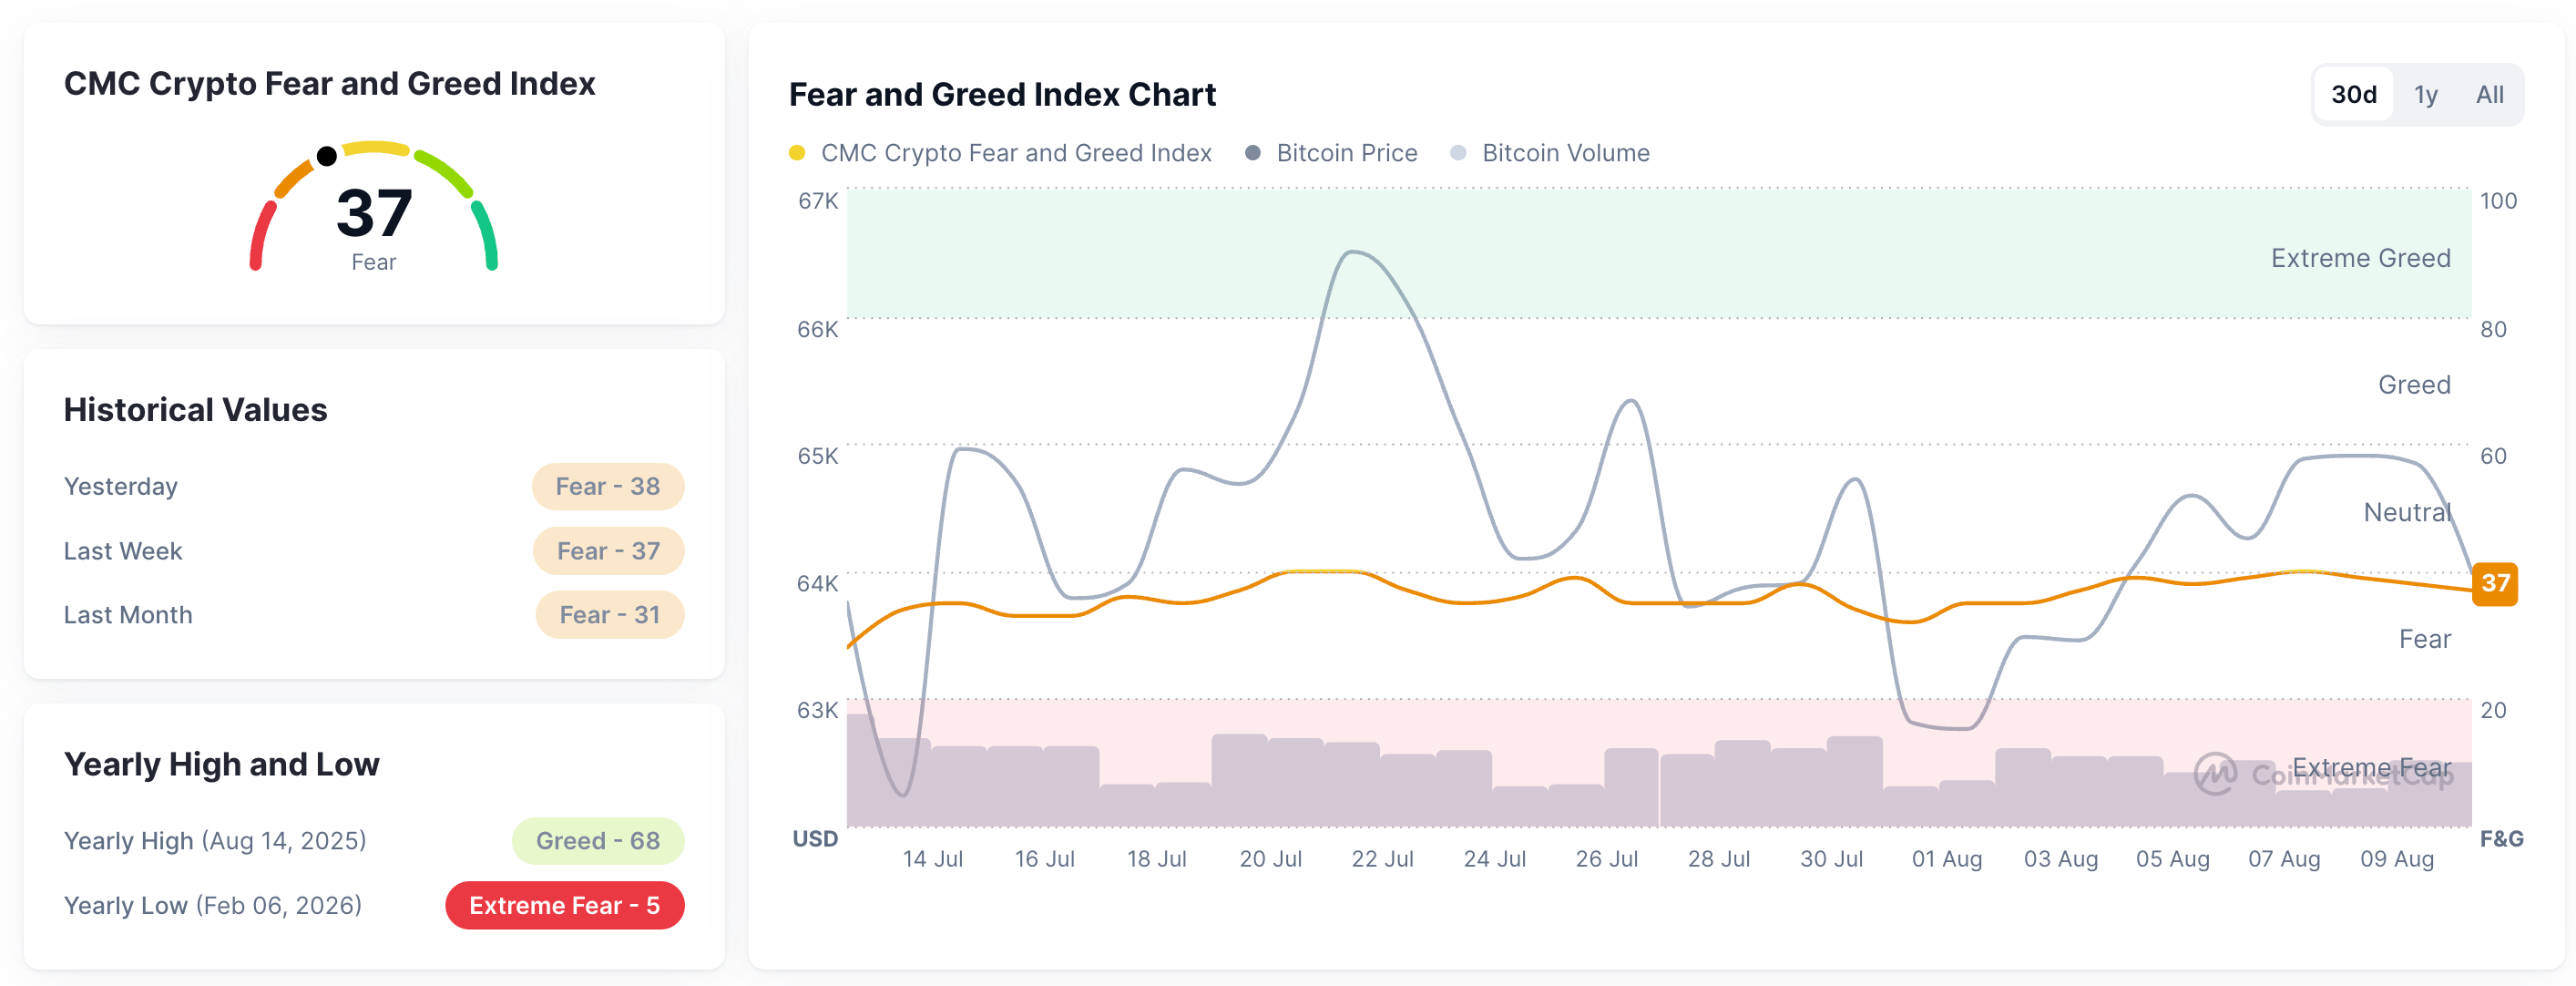
The broader crypto market is subject to recurring bearish catalysts, maintaining a downside bias. The recent pullback in Bitcoin (BTC) price, with MARA holdings and Strategy reducing their exposure, as previously reported by FXStreet, weighs on altcoins.
Despite broader market pressure, CoinAnk data shows PI futures Open Interest at $9.16 million, up from $9.02 million the previous day, indicating a mild buildup in positions.
Technical outlook: Will PI perform a post-retest rebound to $0.10?
Pi Network extends its decline well below the $0.1000 threshold, which serves as the primary overhead barrier and keeps the broader tone bearish. At the time of writing, PI tests the broken downward trendline near the 78.6% Fibonacci retracement level (measured from $0.13410 to $0.07032) at $0.08397.
Momentum is mixed on the daily chart, as the Relative Strength Index (RSI) at 26 sits in oversold territory, hinting at stretched downside conditions, while the Moving Average Convergence Divergence (MACD) indicator holds marginally above its signal line, suggesting that selling pressure may be losing intensity.
Looking up, a rebound from the $0.08397 support zone could test the 50% retracement at $0.10221, followed by the 23.6% Fibonacci retracement level at $0.11905.
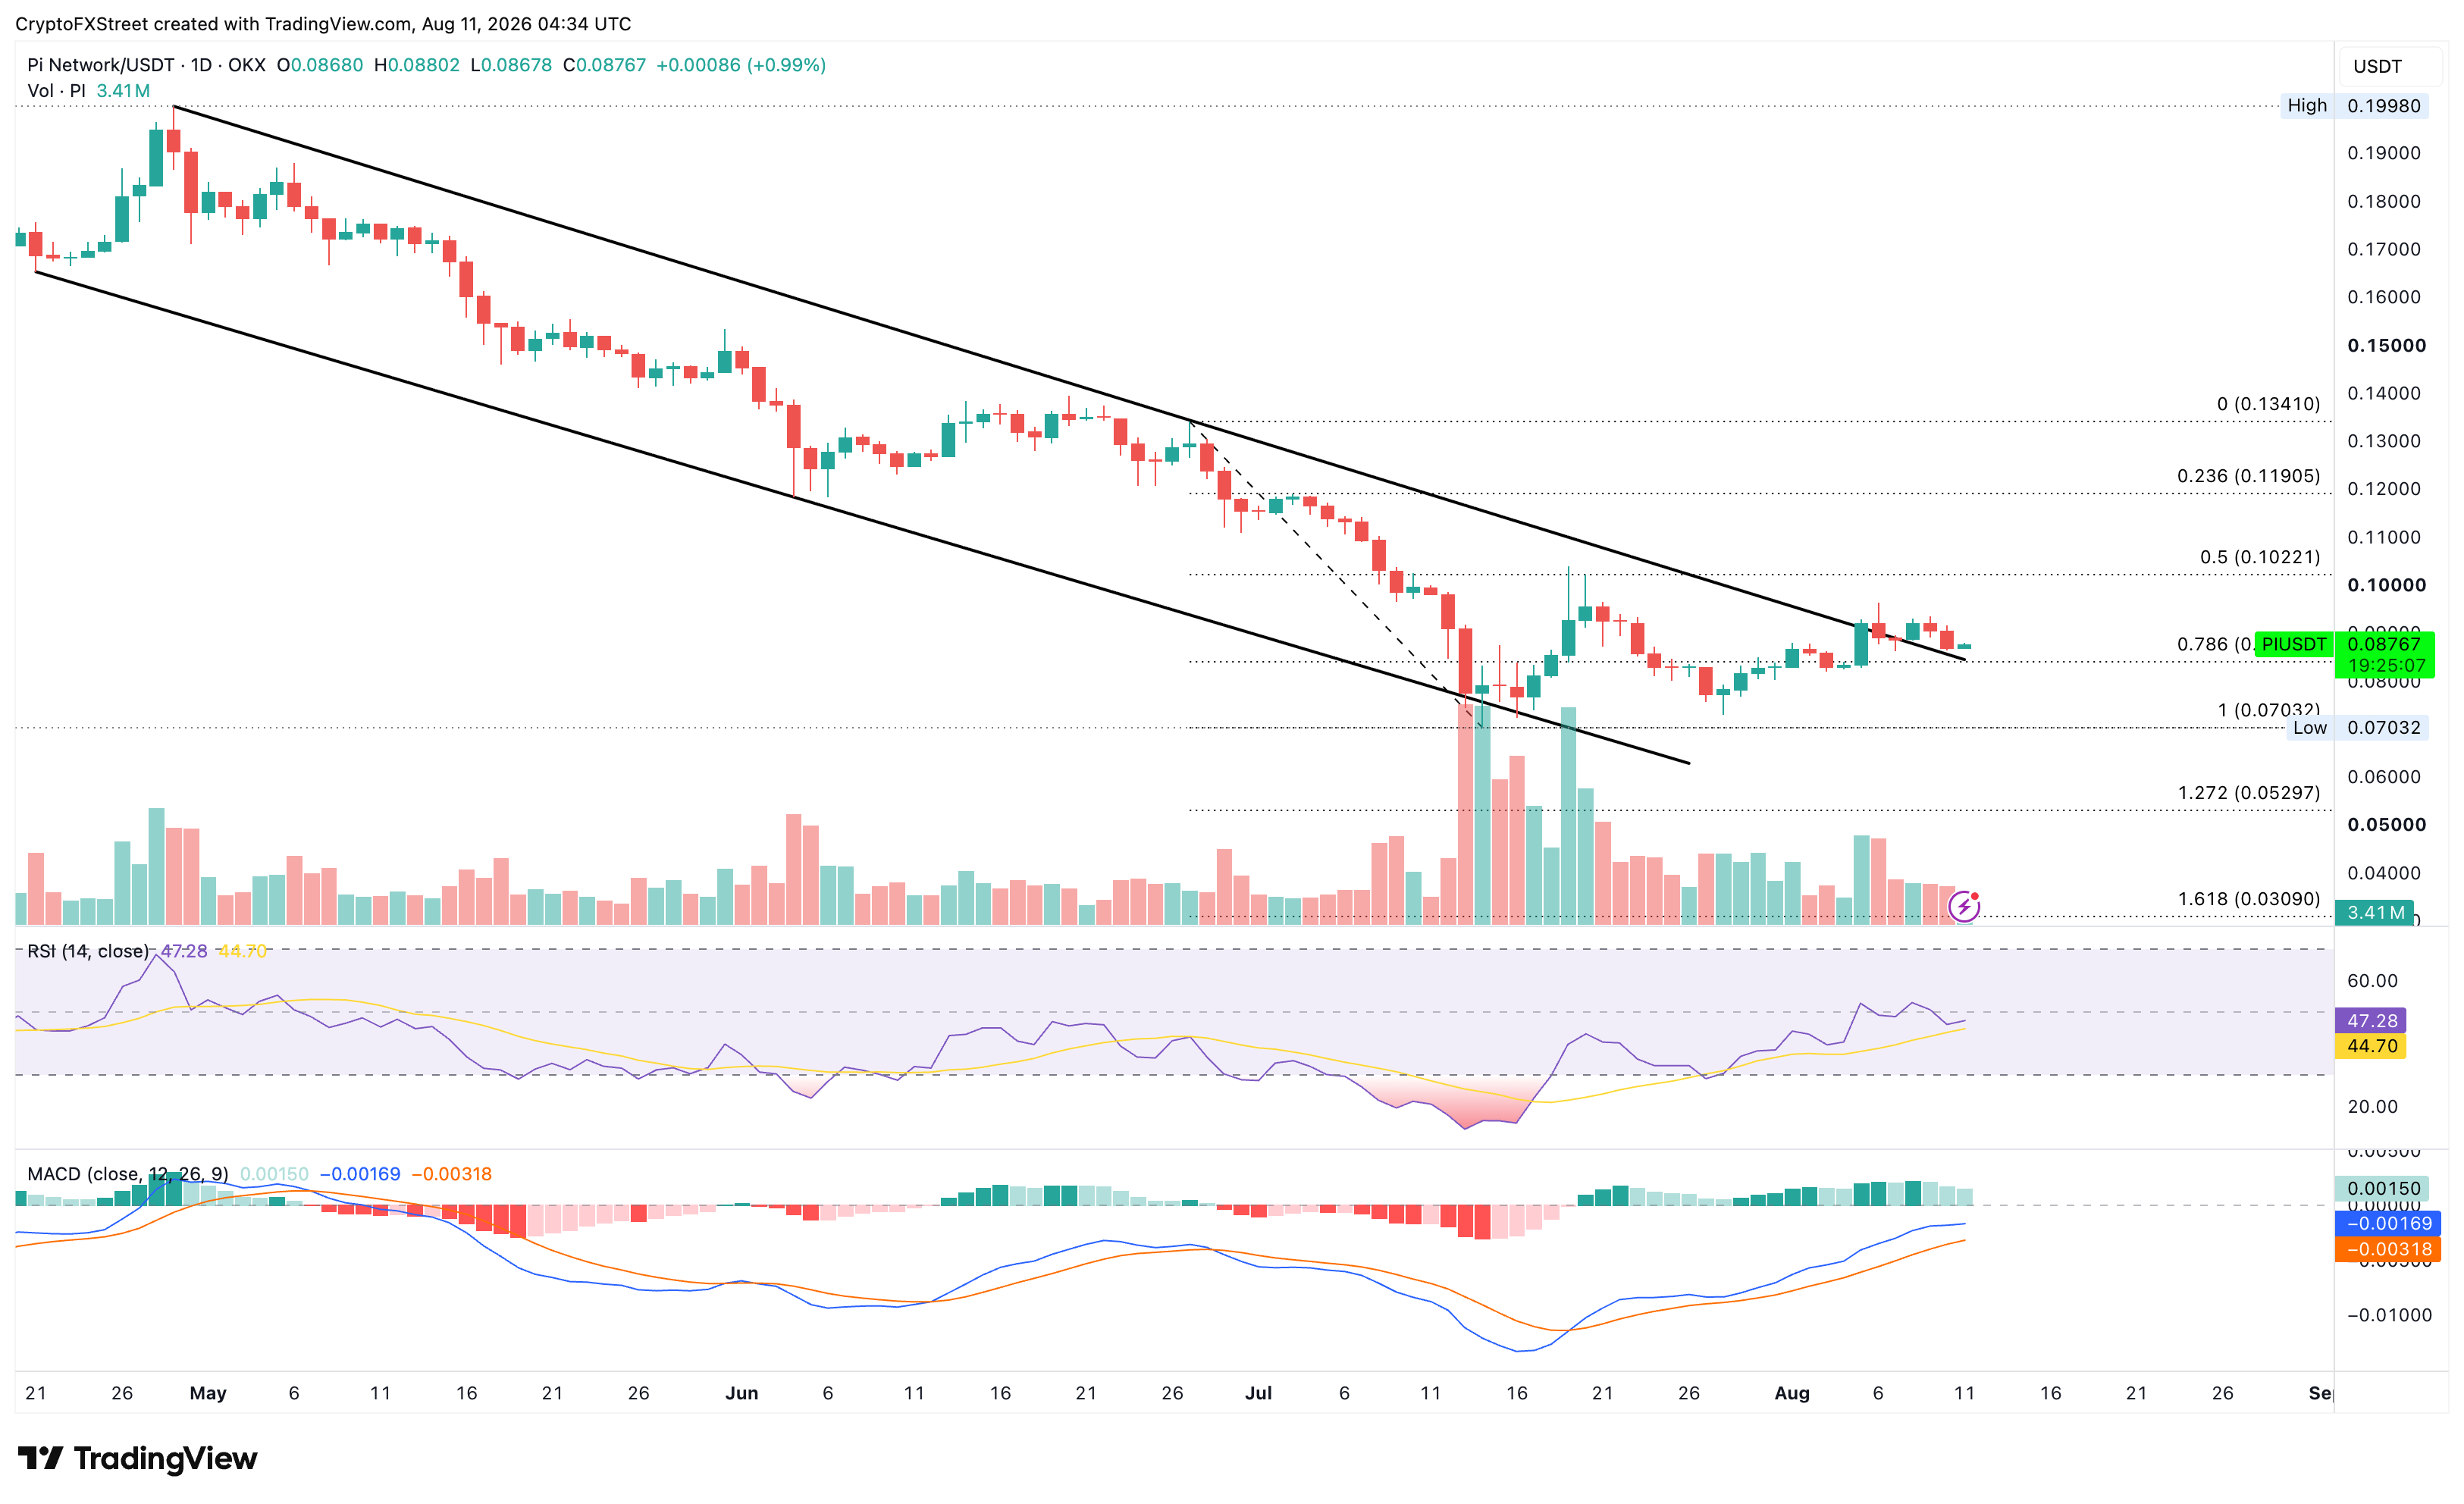
On the downside, a slip below $0.08397 could nullify rebound chances, extending a potential decline toward the $0.07000 round figure.
(The technical analysis of this story was written with the help of an AI tool. Know more.)
Nothing in this material constitutes investment advice, personal recommendation, investment research, an offer, or a solicitation to buy or sell any financial instrument. The content has been prepared without consideration of your individual investment objectives, financial situation, or needs, and should not be treated as such.
Past performance is not a reliable indicator of future performance and/or results. Forward-looking scenarios or forecasts are not a guarantee of future performance. Actual results may differ materially from those anticipated.
Mitrade makes no representation or warranty as to the accuracy or completeness of the information provided and accepts no liability for any loss arising from reliance on such information.
Recommended Articles


