



Gold vs Bitcoin Prediction: XAU eyes $4,500 breakout, BTC dips post US CPI data
- US CPI report shows that inflation increased by 0.1% in July, bringing the annual rate to 3.4%.
- Bitcoin retains a bearish outlook for the fourth consecutive day, weighed down by persistent risk-off sentiment.
- Gold keeps bullish, holding above key moving averages and the dynamic SuperTrend indicator.
Bitcoin (BTC) is extending its decline below $64,000 at the time of writing on Wednesday, as Gold (XAU/USD) maintains its breakout momentum, trading near $4,420. The varied price action follows the release of the United States (US) Consumer Price Index (CPI) report, which broadly met market expectations.
US CPI report triggers volatility in Bitcoin and Gold
The Bureau of Labor Statistics (BLS) released the latest US CPI data on Wednesday, showing a seasonally adjusted increase of 0.1% in July. This brings annual inflation down to 3.4%, easing slightly from June’s 3.5%. The print aligned with broader market expectations.
Core CPI, excluding the volatile prices of food and energy, climbed 0.2% on a monthly basis and 2.5% annually, also matching market expectations.
While inflation holds well above the Federal Reserve’s (Fed) 2% target, consecutive subdued monthly prints, mirroring June’s moderation, suggest the energy-driven surge in the second quarter is losing steam. However, price volatility could persist while markets closely track ongoing uncertainty in the Middle East.
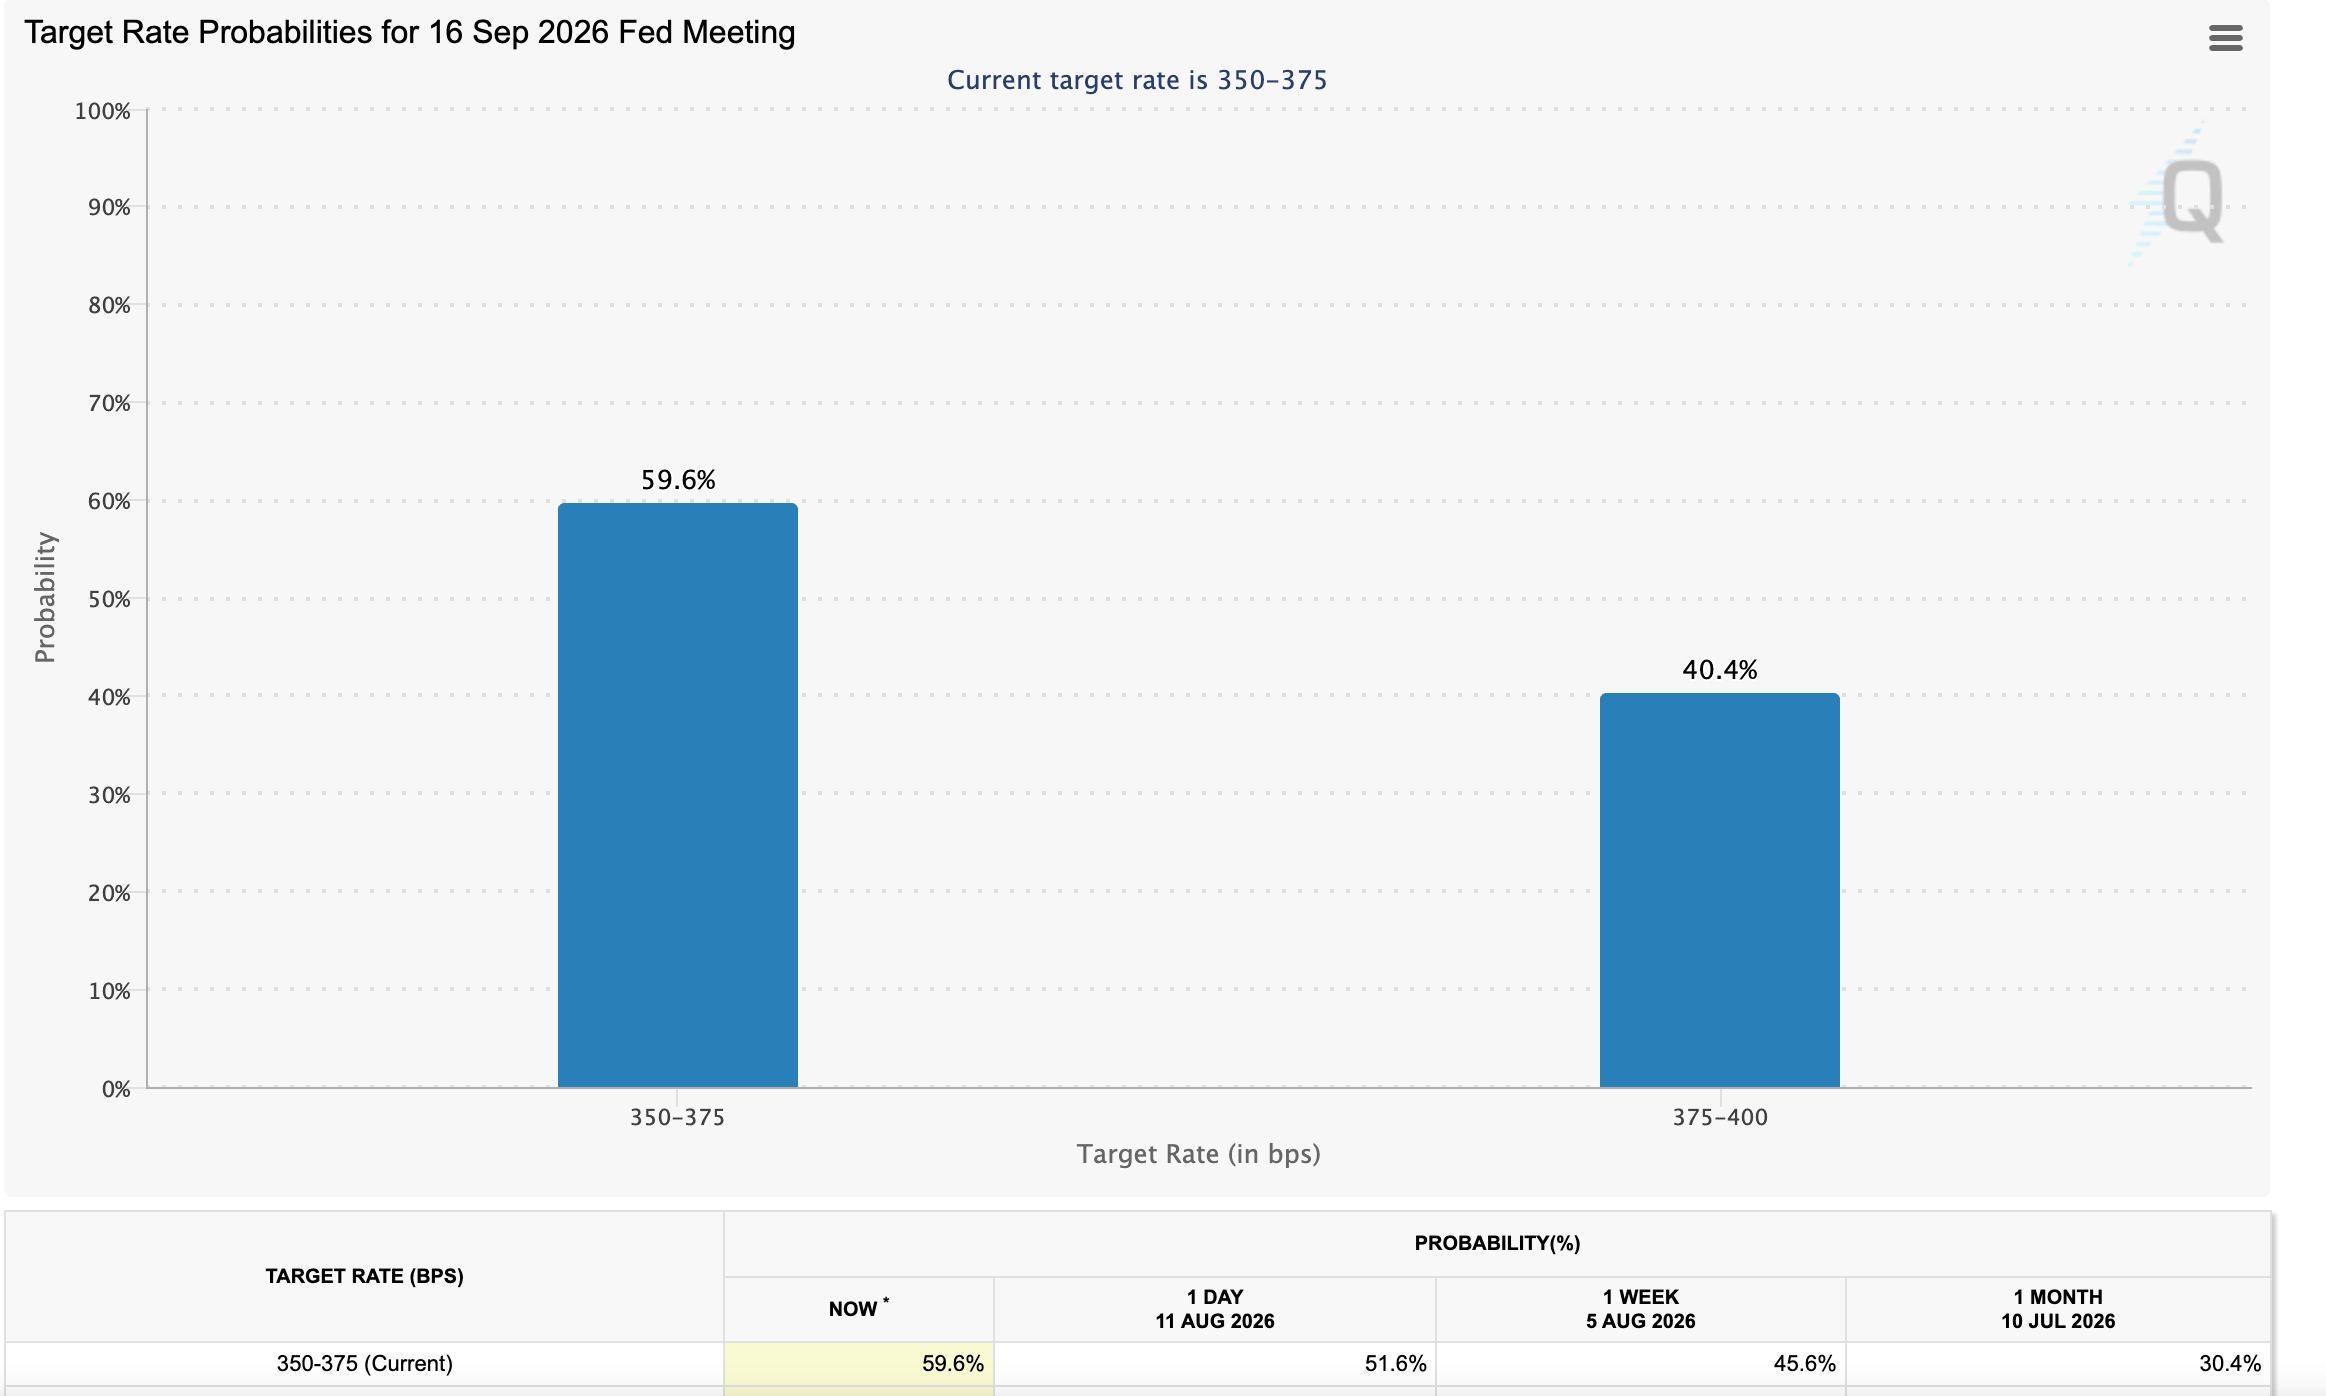
Meanwhile, market participants are currently pricing in nearly a 60% chance that the Fed will leave interest rates unchanged in the 3.50%-3.75% range in September. On the other hand, the probability of a rate hike has recently eased to 40%.
Technical analysis: Bitcoin trims gains as headwinds intensify
Bitcoin trades at $63,585, keeping a bearish near-term tone as the price holds beneath the 50-day, 100-day and 200-day Exponential Moving Averages (EMAs). The ongoing slide below the upward support trendline, with the break level at $63,600, reinforces the idea of a capped market, while the Parabolic SAR at $62,753 offers the nearest dynamic support.
Momentum remains soft, with the Relative Strength Index (RSI) hovering around 46 on the daily chart and the Moving Average Convergence Divergence (MACD) below zero and its signal line, with a negative histogram that hints at persistent downside pressure.
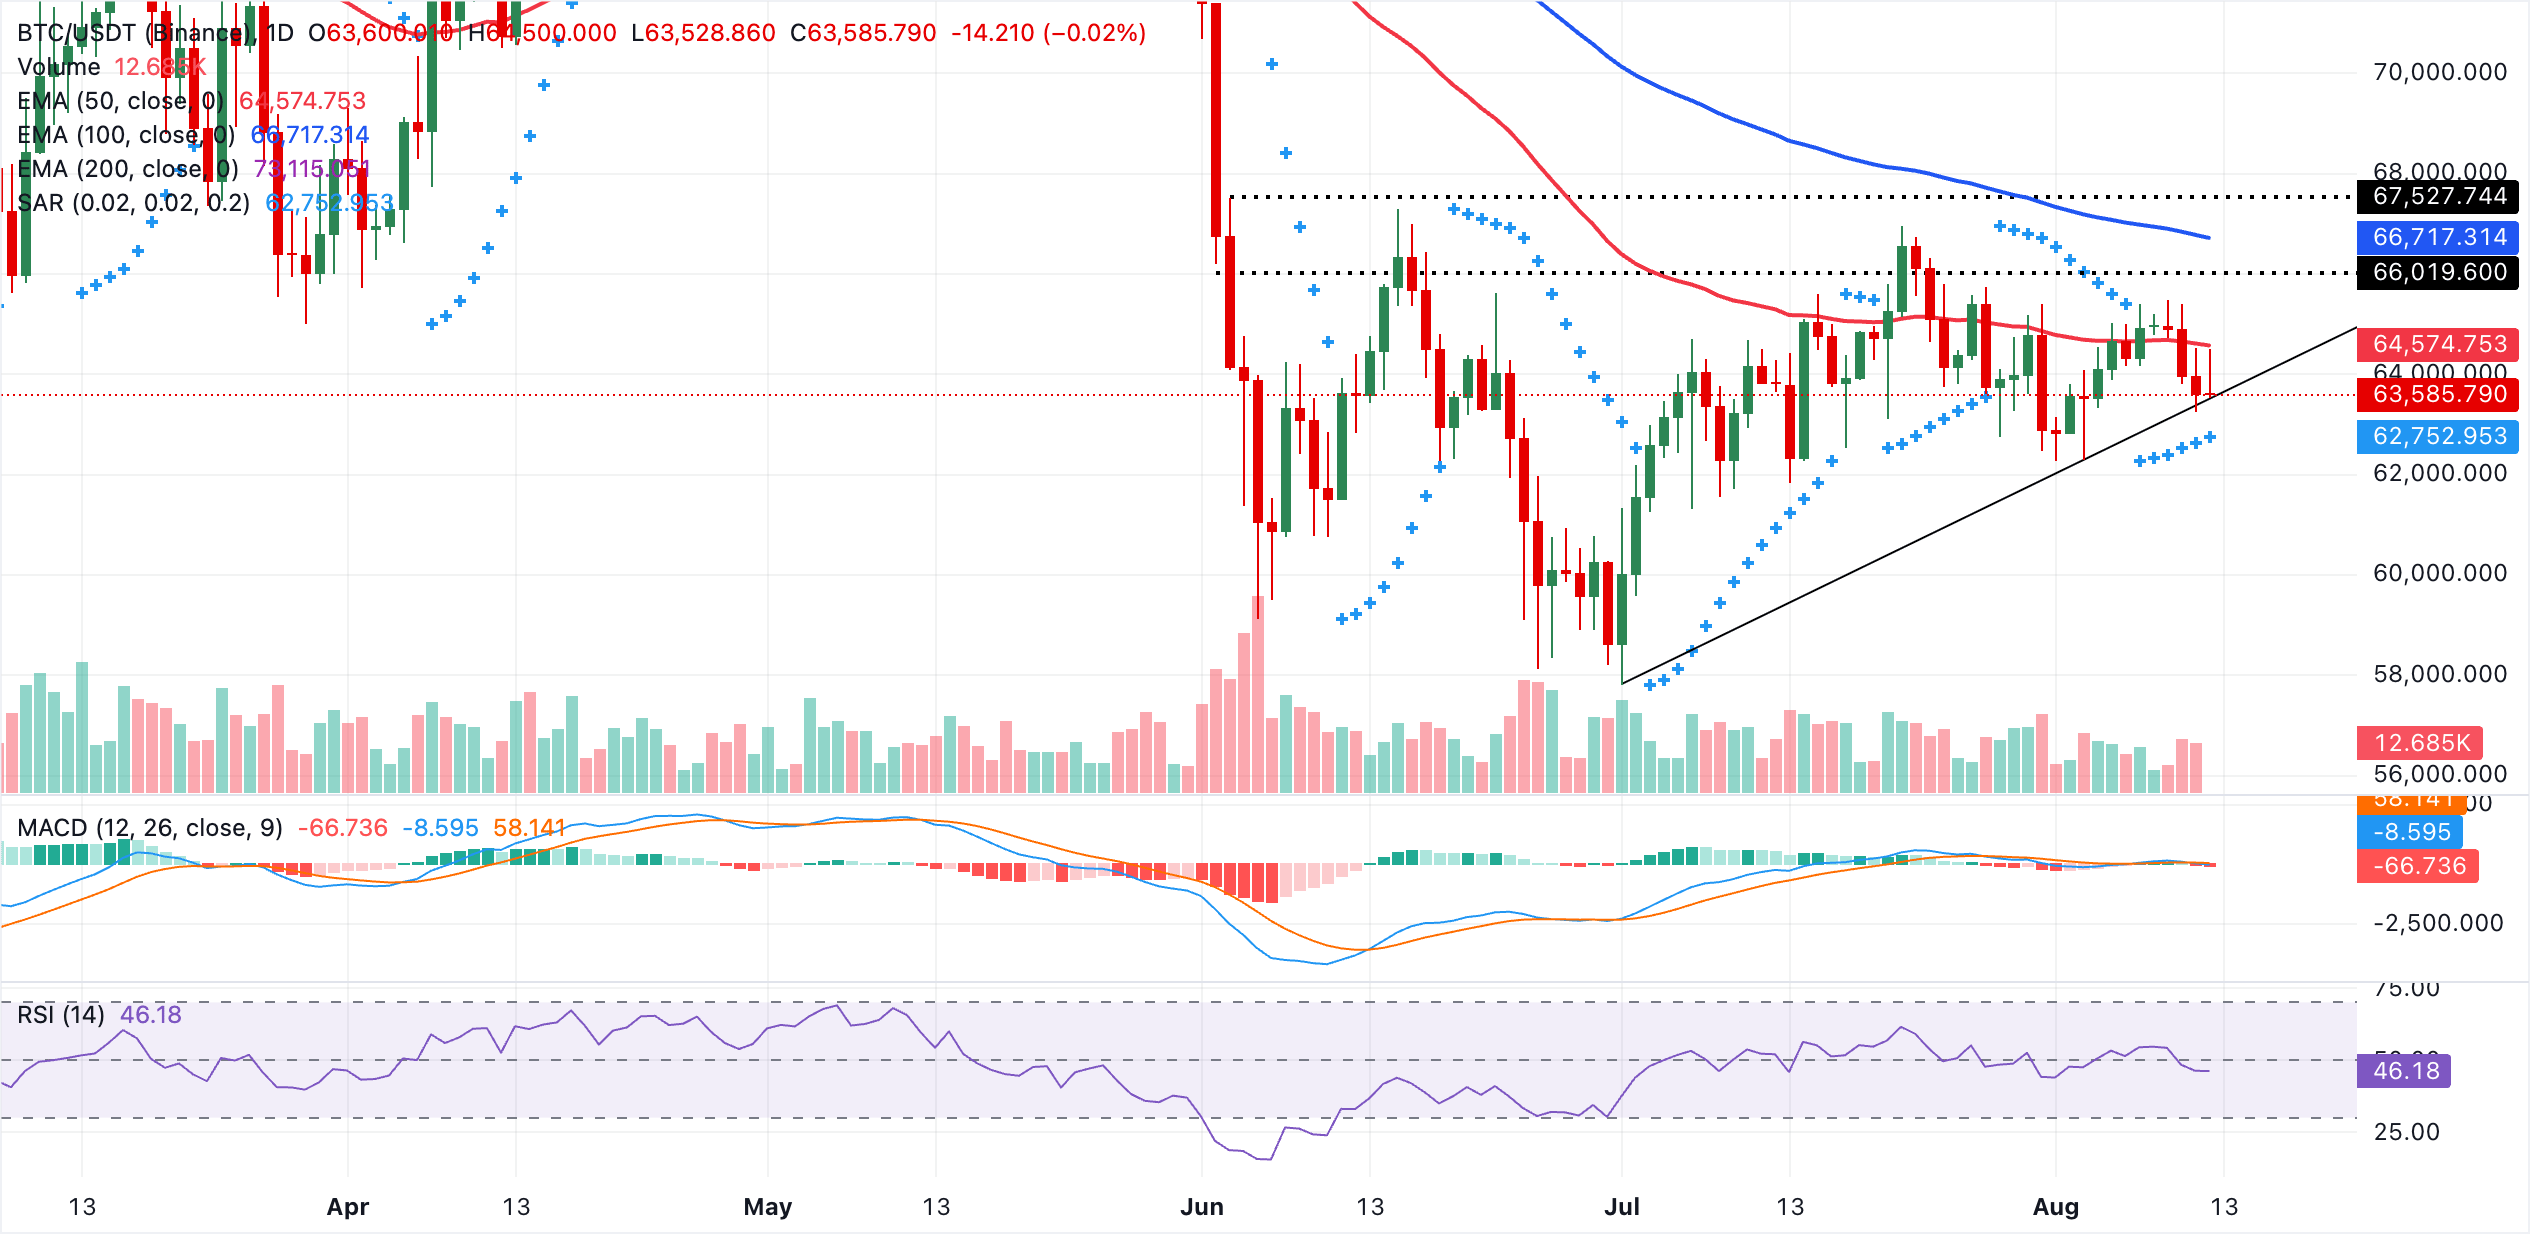
Immediate support is defined by the Parabolic SAR level near $62,753. A clear move below this area would open the way for deeper retracements towards the pivotal $60,000 demand area. On the topside, initial resistance appears at the round-figure $64,000 level, followed by the 50-day EMA at $64,575 and then the 100-day EMA at $66,717, ahead of the more distant 200-day EMA at $73,115, which collectively outline a dense overhead barrier that Bitcoin must overcome to shift the daily bias back to bullish.
Gold extends breakout toward $4,500
Gold trades roughly at $4,419 and holds a clear bullish near-term bias as the spot price extends well above the key moving averages, with the 100-day, 200-day, and 50-day EMAs all providing underlying trend support.
The SuperTrend line at $4,120 reinforces this constructive backdrop, while momentum remains strong. Moreover, the RSI near 68 flirts with overbought territory and the MACD stands in positive territory with its latest reading rising, hinting at persistent upside pressure.
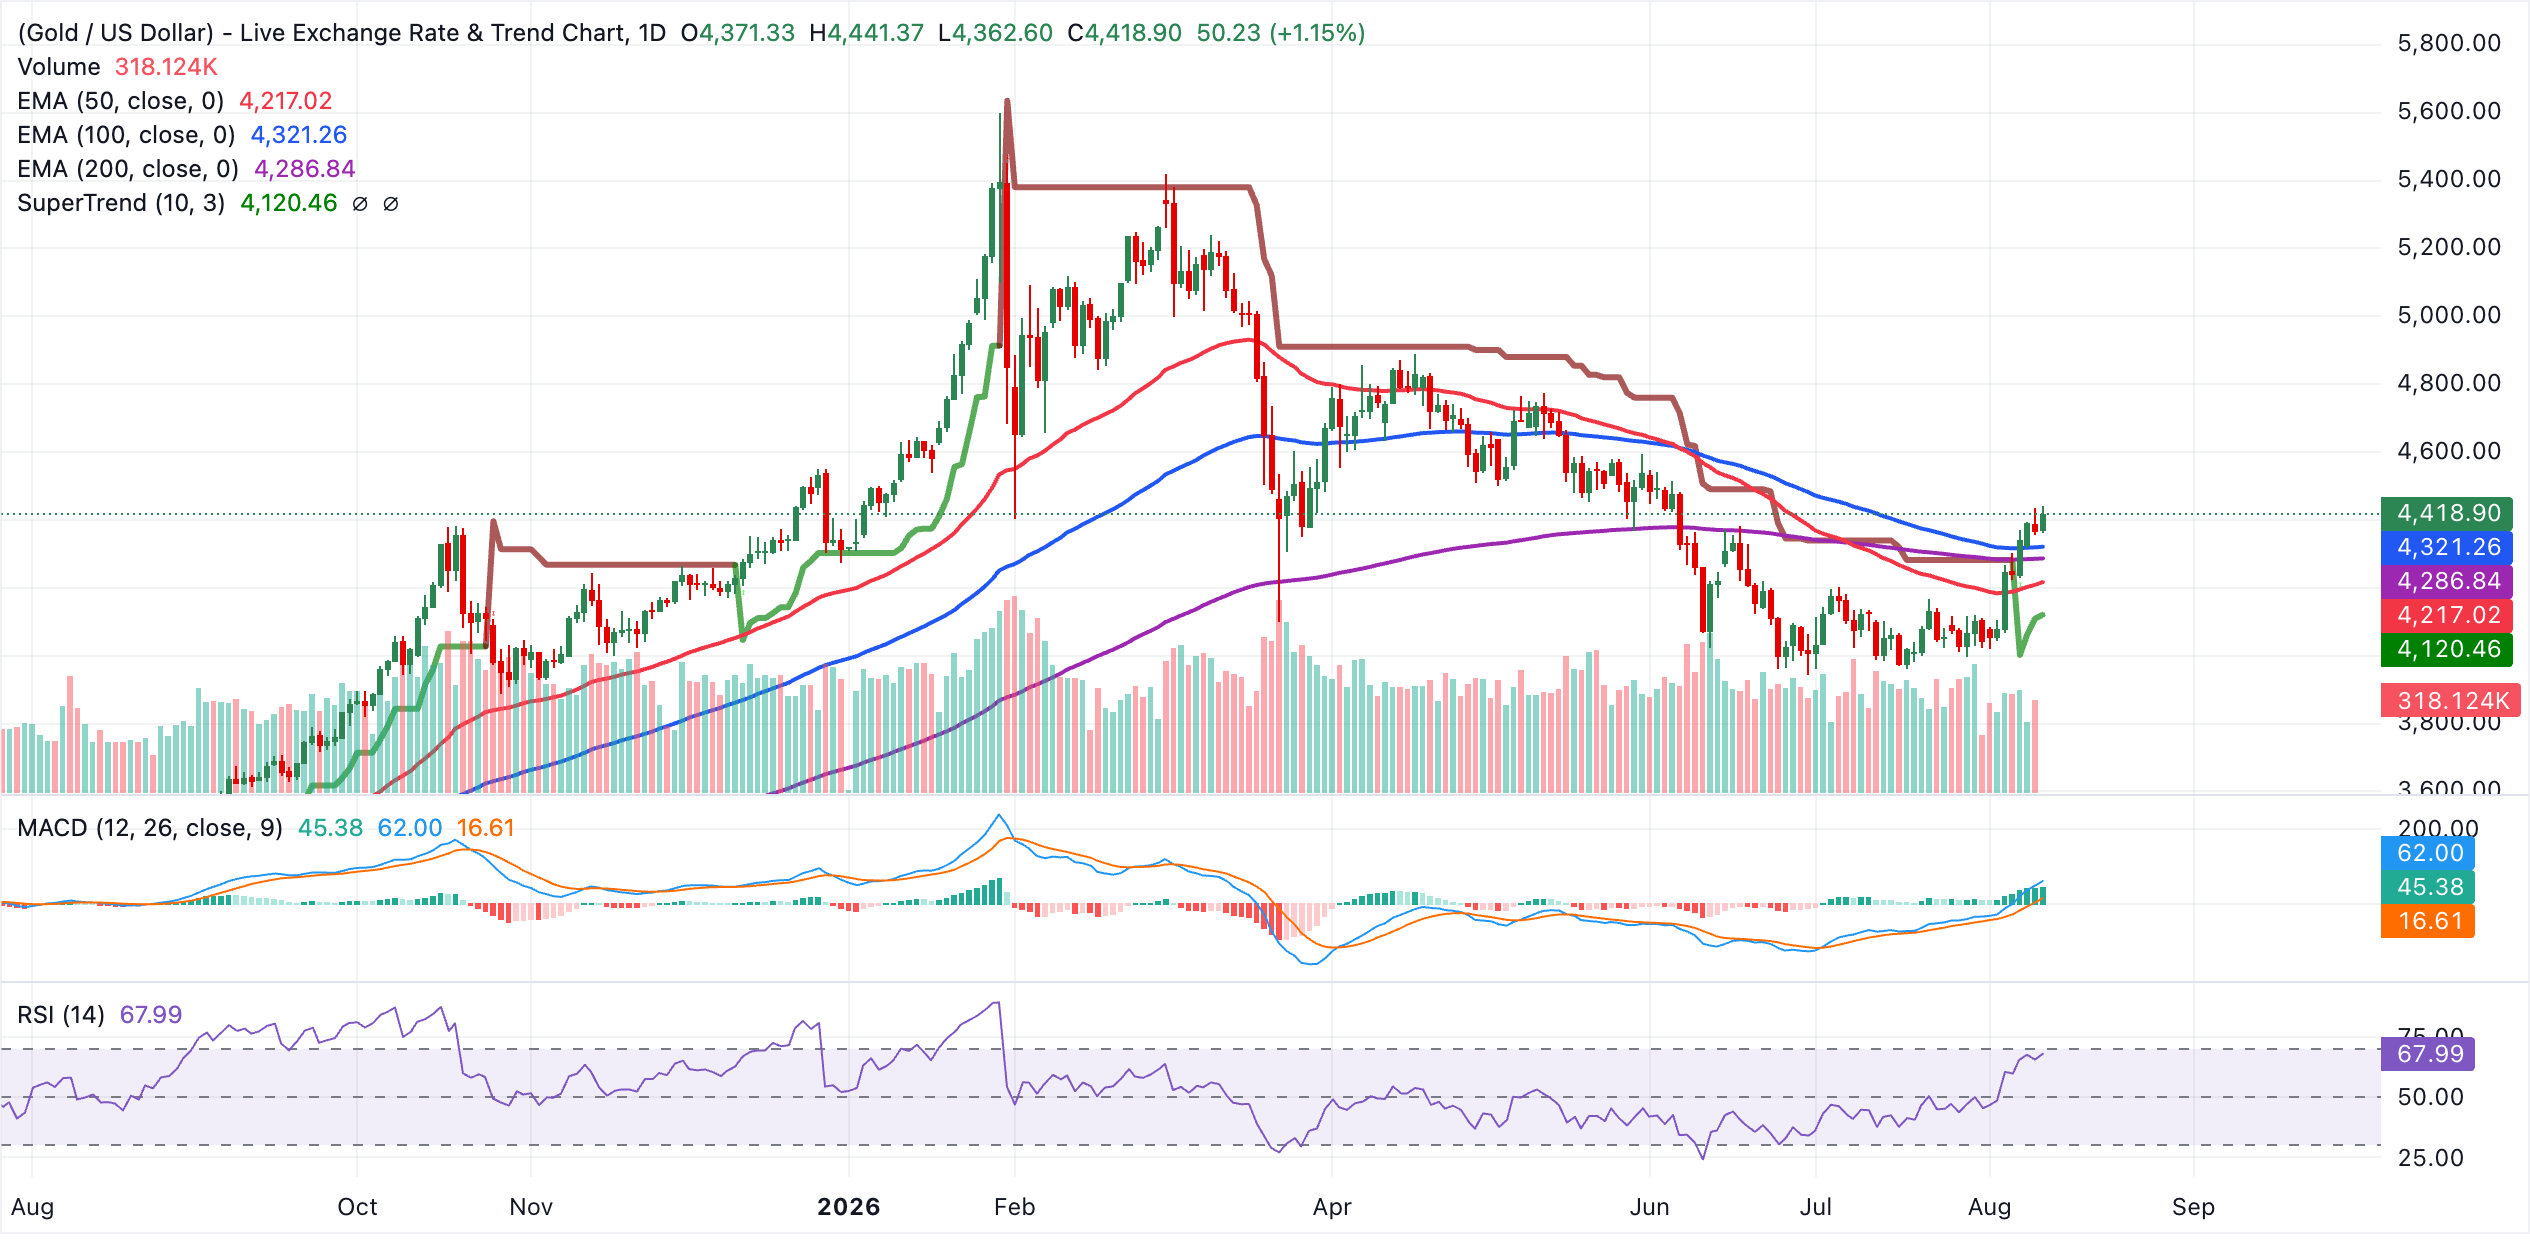
Initial support lies at the 100-day EMA around $4,321, followed by the 200-day EMA near $4,287, which guards deeper pullbacks within the broader uptrend. Below that support cluster, the 50-day EMA at approximately $4,217 and the SuperTrend level at $4,120 form a wider demand zone that would be expected to cushion a more pronounced correction. Note that any setback towards these supports would likely be seen as a corrective dip within an ongoing bullish phase rather than a trend reversal.
(The technical analysis of this story was written with the help of an AI tool. Know more.)
Bitcoin, altcoins, stablecoins FAQs
Bitcoin is the largest cryptocurrency by market capitalization, a virtual currency designed to serve as money. This form of payment cannot be controlled by any one person, group, or entity, which eliminates the need for third-party participation during financial transactions.
Altcoins are any cryptocurrency apart from Bitcoin, but some also regard Ethereum as a non-altcoin because it is from these two cryptocurrencies that forking happens. If this is true, then Litecoin is the first altcoin, forked from the Bitcoin protocol and, therefore, an “improved” version of it.
Stablecoins are cryptocurrencies designed to have a stable price, with their value backed by a reserve of the asset it represents. To achieve this, the value of any one stablecoin is pegged to a commodity or financial instrument, such as the US Dollar (USD), with its supply regulated by an algorithm or demand. The main goal of stablecoins is to provide an on/off-ramp for investors willing to trade and invest in cryptocurrencies. Stablecoins also allow investors to store value since cryptocurrencies, in general, are subject to volatility.
Bitcoin dominance is the ratio of Bitcoin's market capitalization to the total market capitalization of all cryptocurrencies combined. It provides a clear picture of Bitcoin’s interest among investors. A high BTC dominance typically happens before and during a bull run, in which investors resort to investing in relatively stable and high market capitalization cryptocurrency like Bitcoin. A drop in BTC dominance usually means that investors are moving their capital and/or profits to altcoins in a quest for higher returns, which usually triggers an explosion of altcoin rallies.
Nothing in this material constitutes investment advice, personal recommendation, investment research, an offer, or a solicitation to buy or sell any financial instrument. The content has been prepared without consideration of your individual investment objectives, financial situation, or needs, and should not be treated as such.
Past performance is not a reliable indicator of future performance and/or results. Forward-looking scenarios or forecasts are not a guarantee of future performance. Actual results may differ materially from those anticipated.
Mitrade makes no representation or warranty as to the accuracy or completeness of the information provided and accepts no liability for any loss arising from reliance on such information.
Recommended Articles


