



Bitcoin posts strongest weekly gain since November 2024 as market activity surges — K33
- Bitcoin gained 23% over the past week, marking its strongest weekly performance since the post-election rally in November 2024.
- The top crypto reclaimed its 200-week, 200-day, 100-day and 50-day moving averages within four days, favoring continued bullish momentum.
- BTC’s largest-ever short squeeze liquidated $1.37 billion in bearish positions, reducing leverage and reinforcing the recent market recovery.
Bitcoin (BTC) has posted its strongest one-week gain since the November 2024 US presidential election, climbing 23% over the past week as spot market activity and institutional demand returned sharply, according to a Tuesday report from K33.
Bitcoin spot volumes surge 188% as market activity rebounds
The rally pushed Bitcoin from around $63,000 to over $80,000 by late Monday. However, unlike the 2024 rally, the latest advance has been heavily influenced by forced deleveraging and a historic short squeeze.
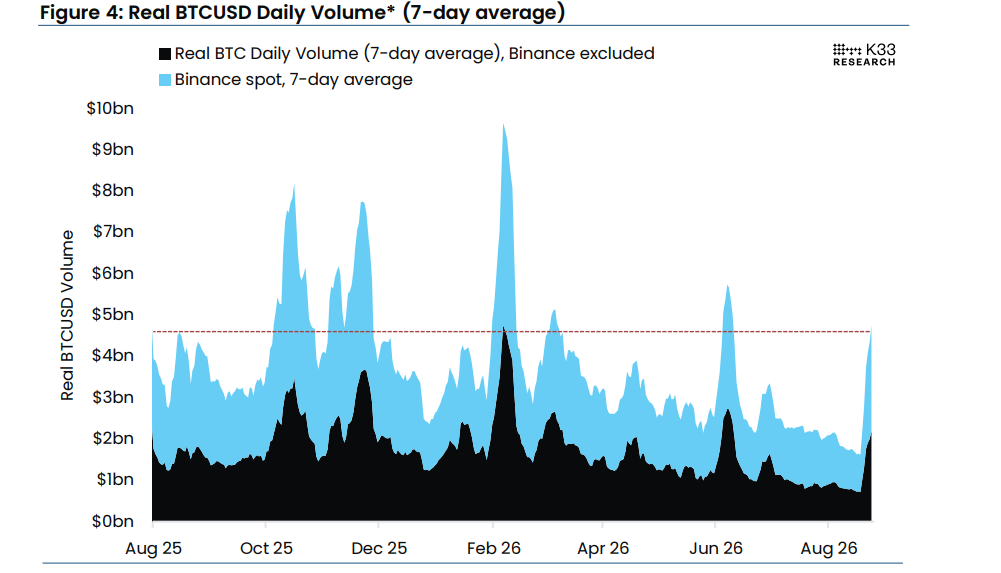
Average daily Bitcoin spot volumes jumped 188% week-over-week to $4.7 billion, reaching their highest level since early June. The increase came after a prolonged period of consolidation marked by declining volumes and volatility.
Bitcoin exchange-traded products (ETPs) also recorded their strongest weekly inflows since October 2025. Net inflows reached 31,740 BTC, lifting total BTC held by ETPs to 1.47 million BTC. However, holdings remain 121,743 BTC below their previous peak following heavy outflows between mid-May and June.
Bitcoin reclaims moving averages in four trading days
At the same time, BTC's recovery pushed it above its 200-week, 200-day, 100-day and 50-day moving averages within just four days.
According to the report, the top crypto had never previously reclaimed all four averages so quickly. Only three earlier instances saw Bitcoin reclaim all four within 45 days, including October 2015, April 2020 and October 2023. Each period marked the beginning of a cyclical bull market.
“This suggests that momentum clearly favors the bulls. Furthermore, the extreme spike in daily RSI to 85.9 on August 21 led many to point to BTC as overbought,” the report stated.
However, historical data presents a more favorable picture. RSI readings between 85 and 90 have historically produced the highest 10-day, 30-day, 180-day and 365-day forward win rates among the ranges examined, K33 noted.
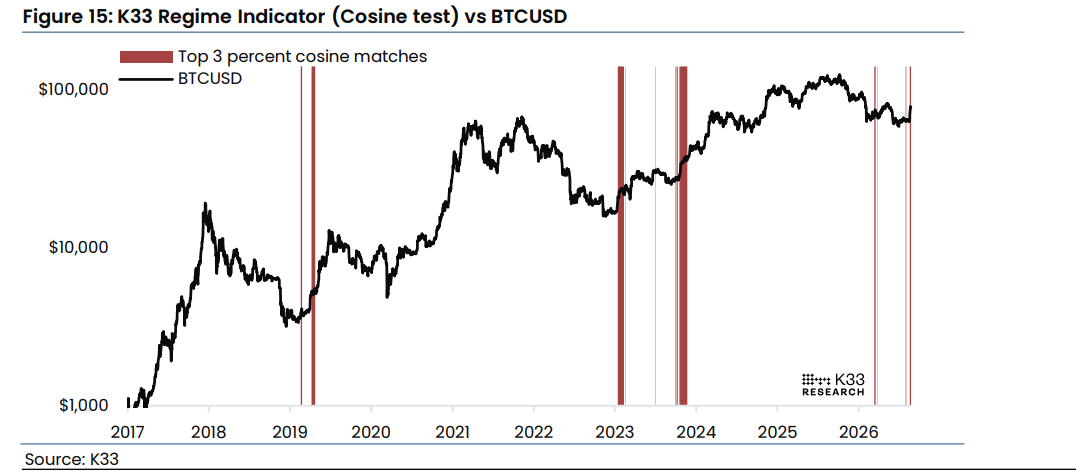
The firm's market regime framework, which incorporates technical indicators, derivatives, ETF flows and macroeconomic conditions, currently resembles previous bear-market breakouts in 2019 and 2023. While the report stressed that historical similarities do not guarantee the same outcome, current conditions remain supportive of a continued recovery.
Although Bitcoin's recovery has been impressive so far, the top crypto remains 36% below its all-time high and farther from peak levels than other major assets.
Gold has also advanced, while its correlation with Bitcoin has reached its highest level since October 2020 and its correlation with the Nasdaq has fallen to one-year lows.
A historic unwinding of bearish positions has also amplified the latest rally. K33 highlighted that Bitcoin recorded both its largest and third-largest daily short liquidation events over the past week. On August 19 alone, $1.37 billion in Bitcoin shorts were liquidated, surpassing the previous record of $757 million set in July 2021.
K33 noted that major short squeezes have historically appeared during Bitcoin’s bottoming phases, when bearish positioning becomes crowded, and selling pressure becomes exhausted.
“Historically, flips in long-tenor skew have been reliable reversal signals in both directions, identifying attractive periods to buy as well as to sell,” K33 added.
BTC is trading at $78,480, up 0.1% in the past 24 hours at the time of writing.
Nothing in this material constitutes investment advice, personal recommendation, investment research, an offer, or a solicitation to buy or sell any financial instrument. The content has been prepared without consideration of your individual investment objectives, financial situation, or needs, and should not be treated as such.
Past performance is not a reliable indicator of future performance and/or results. Forward-looking scenarios or forecasts are not a guarantee of future performance. Actual results may differ materially from those anticipated.
Mitrade makes no representation or warranty as to the accuracy or completeness of the information provided and accepts no liability for any loss arising from reliance on such information.
Recommended Articles


