



Is the Bottom Officially In? Bitcoin's 11-Month Cycle Position Says Accumulation Season Starts Now
TradingKey - Up until mid-August, bears dominated the market, forcing Bitcoin price under $60,000 in August. Over the last week or so, Bitcoin staged a massive, face-melting rally above $80,000 that forced a brutal short squeeze across the crypto space.
With billions in shorts during this rally above $80K and accumulations rising, we're left with one question: Is the Bitcoin bottom officially in? Let's find out what the data suggests.
What's Behind Bitcoin's Recent Surge?
You don't just wake up to a 24% pump without a few massive catalysts acting as rocket fuel. So, what exactly triggered this explosive Bitcoin price pump toward $80,000?
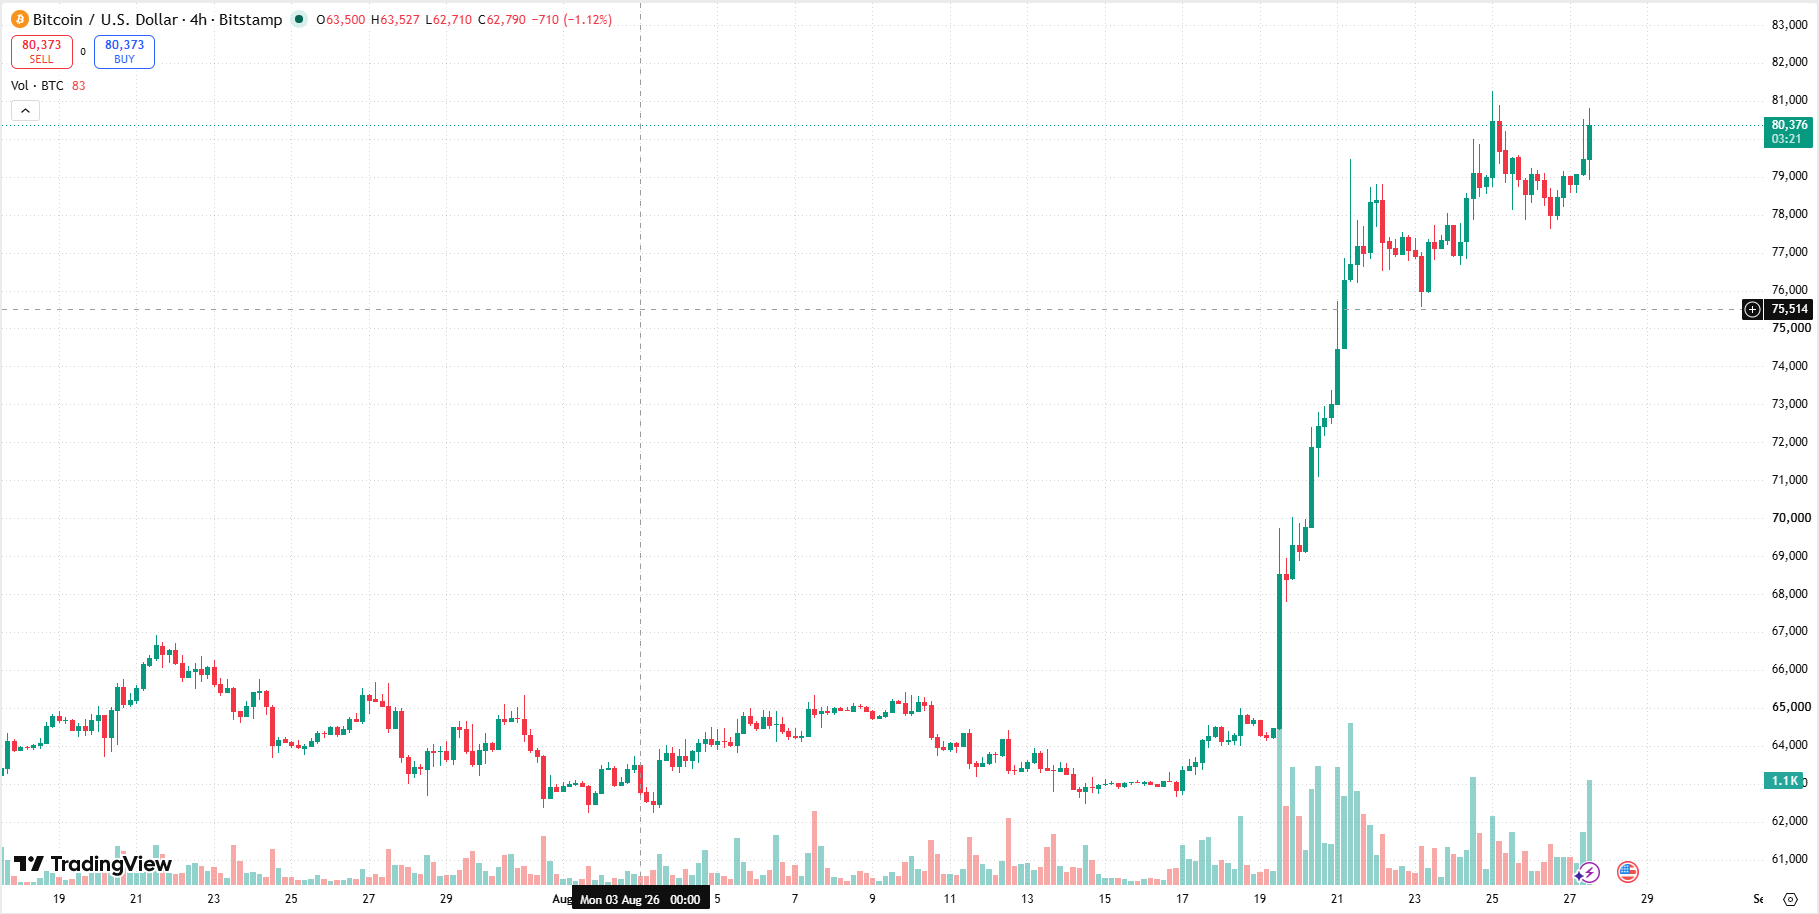
First off, it was a classic, textbook short squeeze. The market was heavily skewed short. Everyone expected the downtrend to continue. When the price ticked up just enough to liquidate heavily leveraged positions, those liquidations acted like gasoline on a fire.
Bears were forced to buy back in, driving the Bitcoin price even higher. But it wasn't just degenerate leverage driving the bus. Macroeconomic and political catalysts played a massive role.
The U.S. Treasury recently decided to double its buyback operations for long-term Treasuries, pushing fresh liquidity into the system. Throw in Donald Trump teasing the possibility of a strategic government Bitcoin reserve, and we have the Bitcoin rally we are seeing.
Bitcoin's 11-Month Cycle Position Says Accumulation Season Starts Now
If you zoom out and ignore the daily noise, the macro picture becomes incredibly clear. Popular crypto analysts have consistently pointed out that Bitcoin operates in highly structured, time-based cycles.
Right now, the 11-month cycle position indicates that the worst of the bleed is over. We are officially entering the accumulation season. What does that mean for you? It means the smart money (whales, institutions, and seasoned veterans) are buying the dips heavily.
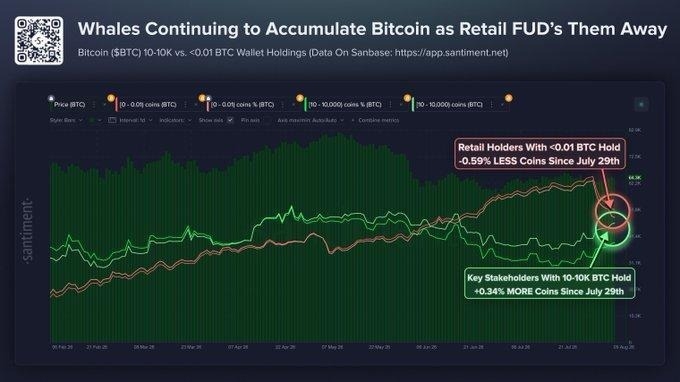
The intense selling pressure has exhausted itself, and deep-pocketed buyers are absorbing whatever stray coins panic-sellers toss onto the market. Data from Santiment already shows smart money are stuffing their wallets with BTC.
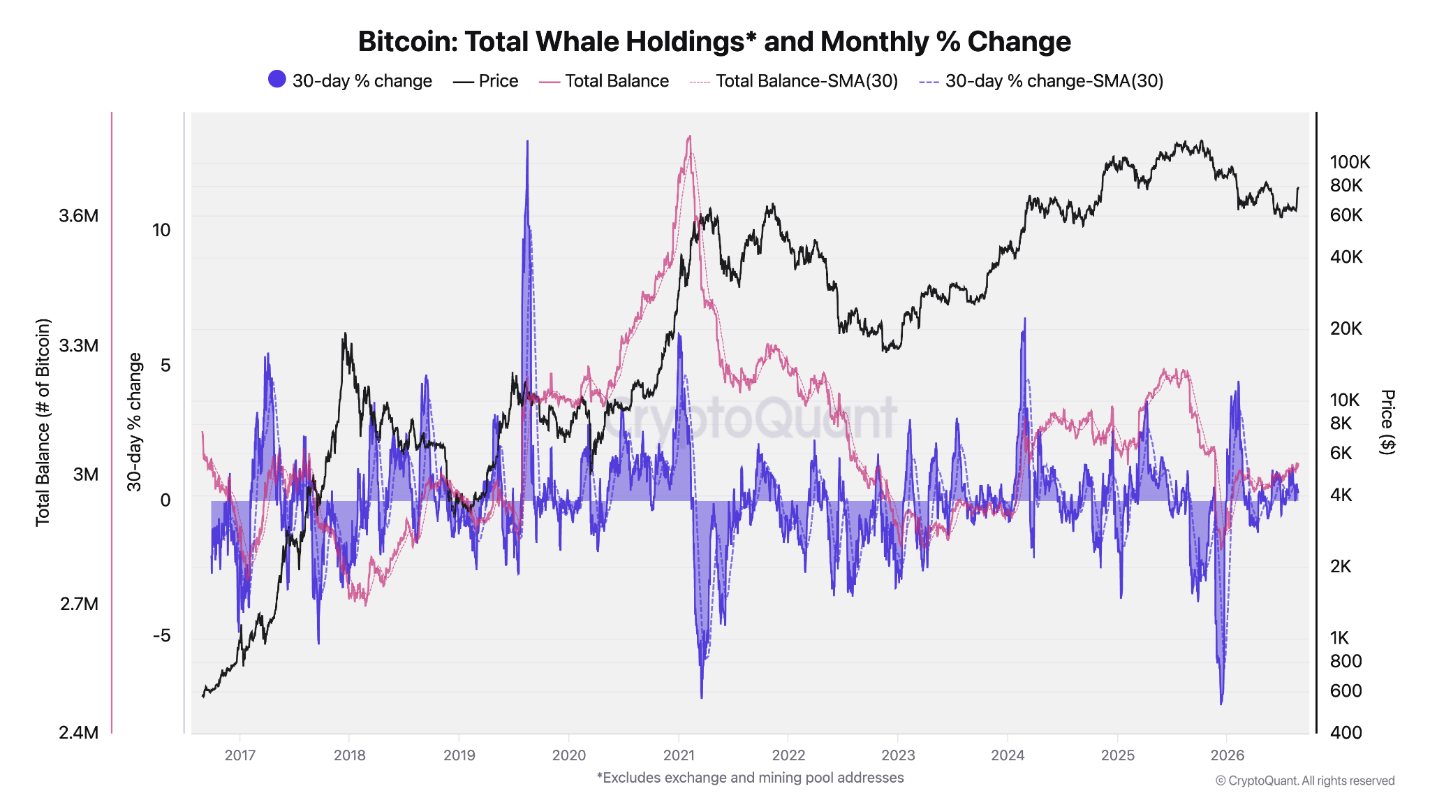
 Similarly, CryptoQuant reports that addresses holding 1,000+ BTC have added over 122,000 BTC in the past four weeks, showing the 11-month accumulation cycle could be back. According to historical cycle data, this transition phase is where foundational wealth is built.
Is the Bottom Officially in?
With the market looking greener than it has in a year, is the bottom officially in? Yes and no. It depends entirely on your timeframe. If you're asking whether we will ever see the devastating lows of the first half, the data strongly suggests the macro bottom is firmly in the rearview mirror.
Apparent demand in the spot market has returned to an aggressive expansion phase. The Bitcoin bull score has jumped from 30 to 80 in a single week. With that being the fastest flip in a year, the bottom must be in, right?
However, calling a local bottom is a trickier game. According to on-chain analytics firm CryptoQuant, traders currently hold an average unrealized profit ratio of around 20.5%. The last time it hit these levels, profit-taking triggered a brutal 30% correction.
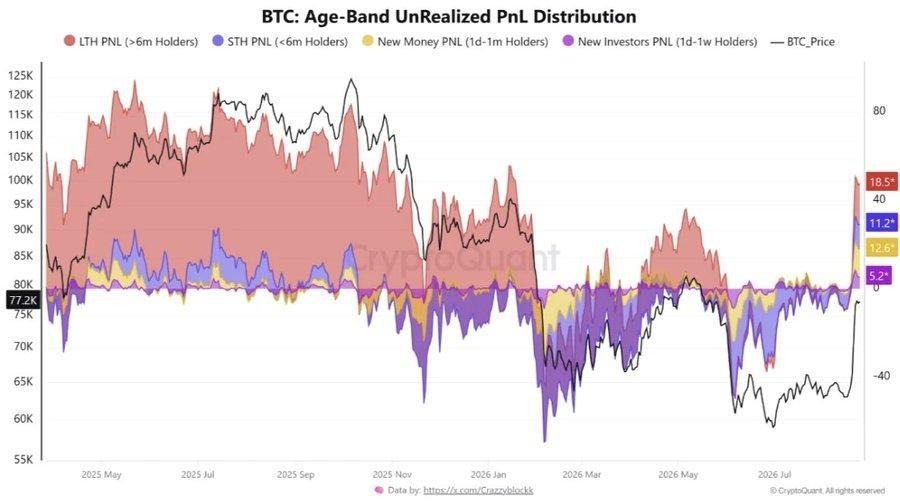
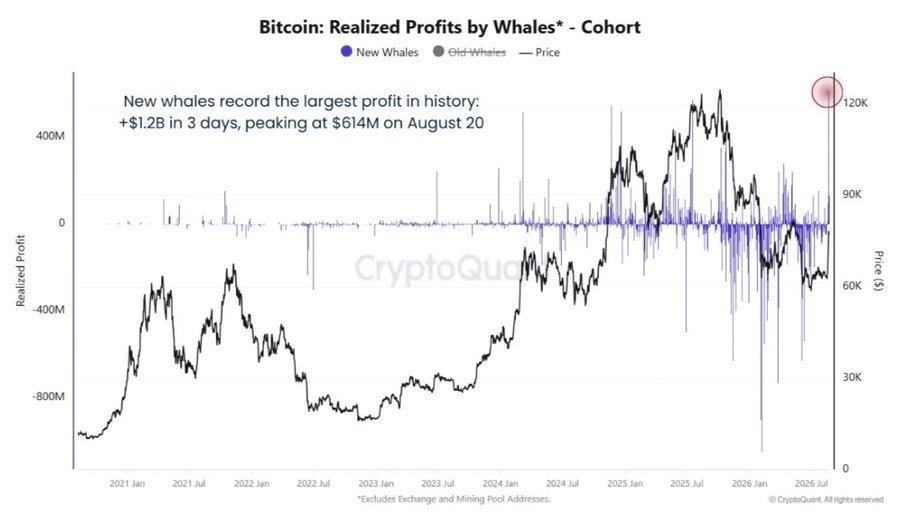
Whale investors with a short-term time horizon have already started moving coins. In fact, when Bitcoin flirted with $79,000 recently, short-term holders cashed out over $1.2 billion in profits. So, while the absolute macro bottom is likely cemented, short-term dips and shakeouts are absolutely still on the table.
$83,000 Would Confirm Entry into New Bull Market
So, where is the magic line in the sand? According to both on-chain data and technical analysis, that number is exactly $83,000. This level represent the last boss before the bull market is set in stone.
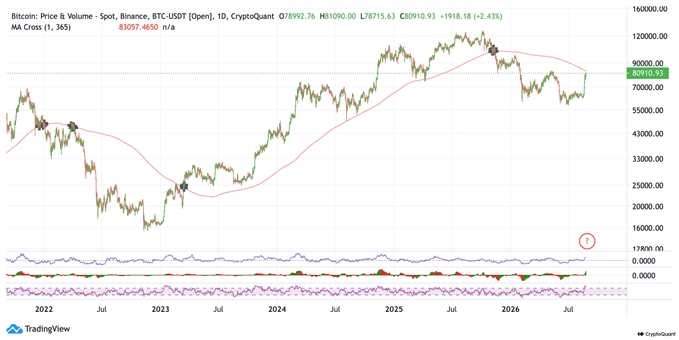
The $83K level is very important because it perfectly aligns with the crucial 365-day moving average. More than that, this level represents a massive liquidity zone that can cause a pullback if Bitcoin price fails to break above.
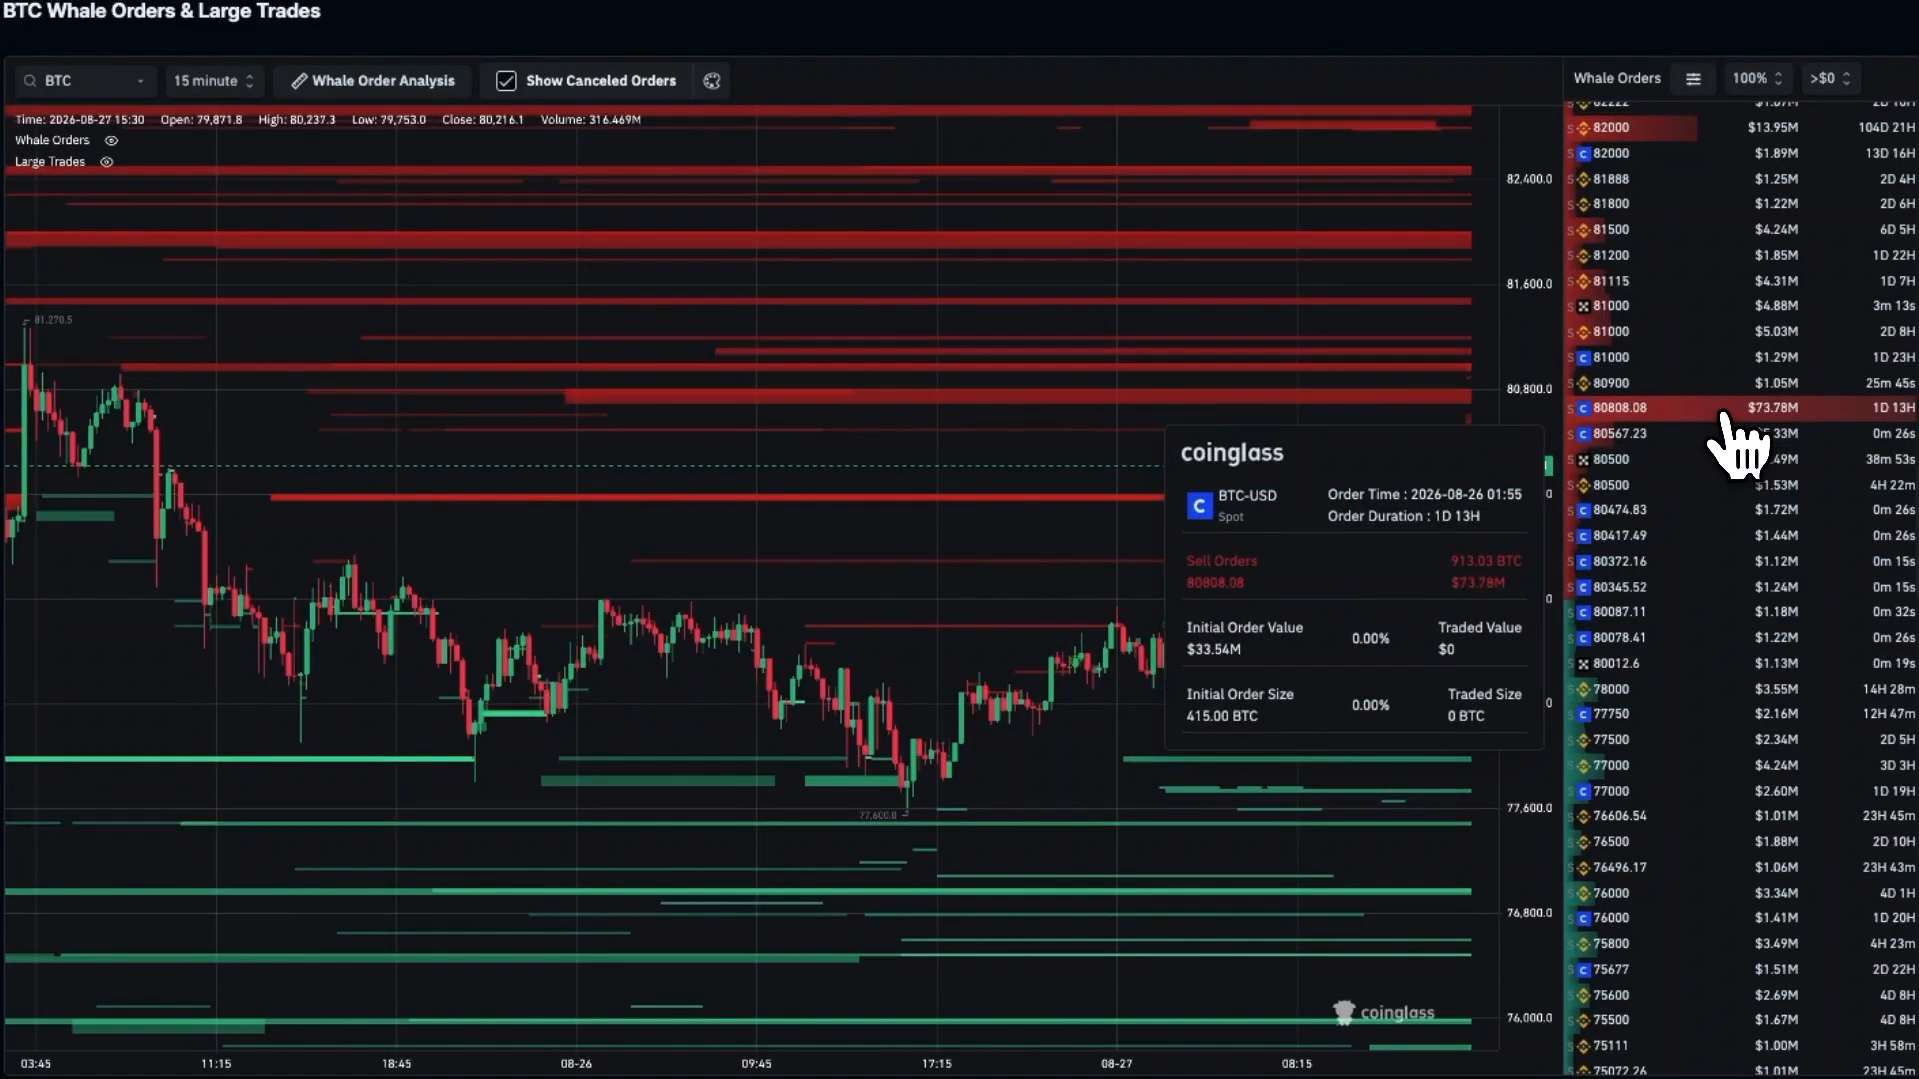
Once we conquer that level, the transition from a bearish chop-fest to a raging new bull market is structurally confirmed. Technical analysts agree. Over on YouTube, More Crypto Online broke down the Elliott Wave structure, noting that $83,000 is the critical swing high from May.
A clean break above this resistance, followed by a confirmed five-wave upward structure, validates a medium-to-long-term bullish reversal. If Bitcoin price clears this level, we could see Bitcoin target $90,000.
In Conclusion
So, is the bottom completely in? The macro cycle screams yes, and the accumulation phase is undeniably underway. However, we believe there's one last major battle before we can firmly say the bottom is set in stone. The $84K supply wall.
Given the amount locked behind this wall, BTC price pushing past the 5% supply barrier just above $83,000 will be a grueling, violent battle. When this happens, we're officially in a new bull market. So, we are undoubtedly standing on the precipice of a new bull market. But expect turbulence.
Nothing in this material constitutes investment advice, personal recommendation, investment research, an offer, or a solicitation to buy or sell any financial instrument. The content has been prepared without consideration of your individual investment objectives, financial situation, or needs, and should not be treated as such.
Past performance is not a reliable indicator of future performance and/or results. Forward-looking scenarios or forecasts are not a guarantee of future performance. Actual results may differ materially from those anticipated.
Mitrade makes no representation or warranty as to the accuracy or completeness of the information provided and accepts no liability for any loss arising from reliance on such information.
Recommended Articles


