



Crypto Overview: Bitcoin shows resilience at $78,000 – Arbitrum, Curve DAO rally
- Bitcoin hovers above $78,000 on Tuesday, sustaining its mild recovery from the previous day.
- Arbitrum records double-digit gains in 24 hours as the Robinhood app, built on Arbitrum Orbit, hits a record high in revenue.
- Curve DAO is up 3% on Tuesday, extending its 14% rise from the previous day.
The broader cryptocurrency market sustains its risk-on sentiment, with Bitcoin (BTC) showing resilience near $78,000 on Tuesday. Arbitrum (ARB) records double-digit gains over the last 24 hours as the Robinhood app, built on Arbitrum Orbit, hits a record high in revenue collection, while Curve DAO (CRV) follows suit.
Bitcoin shows strength near key support level
Bitcoin trades at $78,415 at press time on Tuesday, holding a clear bullish bias. The King crypto price holds above the 50-day Exponential Moving Average (EMA) near $70,050, the 100-day EMA around $69,088, and the 200-day EMA near $72,303, suggesting a firmly supported uptrend.
BTC price also holds above the 50% Fibonacci retracement level between the annual high of $97,924 and the $57,800 swing low, at roughly $77,862, reinforcing a constructive structure.
Momentum is positive but cooling, with the Relative Strength Index (RSI) hovering around 70 and edging out of overbought territory, while the Moving Average Convergence Divergence (MACD) has rolled below its signal line, hinting at a maturing rally.
On the topside, initial resistance appears at the 78.6% Fibonacci retracement at $89,338, with the cycle high at $97,924 serving as a more distant barrier.
On the downside, immediate support is located at the 50% retracement around $77,862, followed by the 200-day EMA at about $72,303. Deeper pullbacks would expose the cluster of the 50-day EMA at $70,050 and the 100-day EMA at $69,088, while a loss of the 23.6% retracement around $67,270 could start to undermine the prevailing bullish structure.
Arbitrum and Curve DAO rallies gain momentum
Arbitrum is up 9% on Tuesday, advancing its 29% rally from the previous day. ARB maintains a bullish near-term bias as price holds above the 50-day and 100-day EMAs at $0.0879 and $0.0917, and tests the 200-day EMA at $0.1163.
The RSI at 74 suggests overbought conditions, while the MACD crosses above its signal line in the positive territory, hinting at constructive momentum despite the stretched setup.
The immediate resistance cluster forms between the 200-day EMA at $0.1163 and the 50% retracement of the downswing from $0.2277 to $0.0705, at $0.1267. A confirmed breakout above $0.1267 could extend the rally toward the 78.6% Fibonacci retracement level at $0.1771.
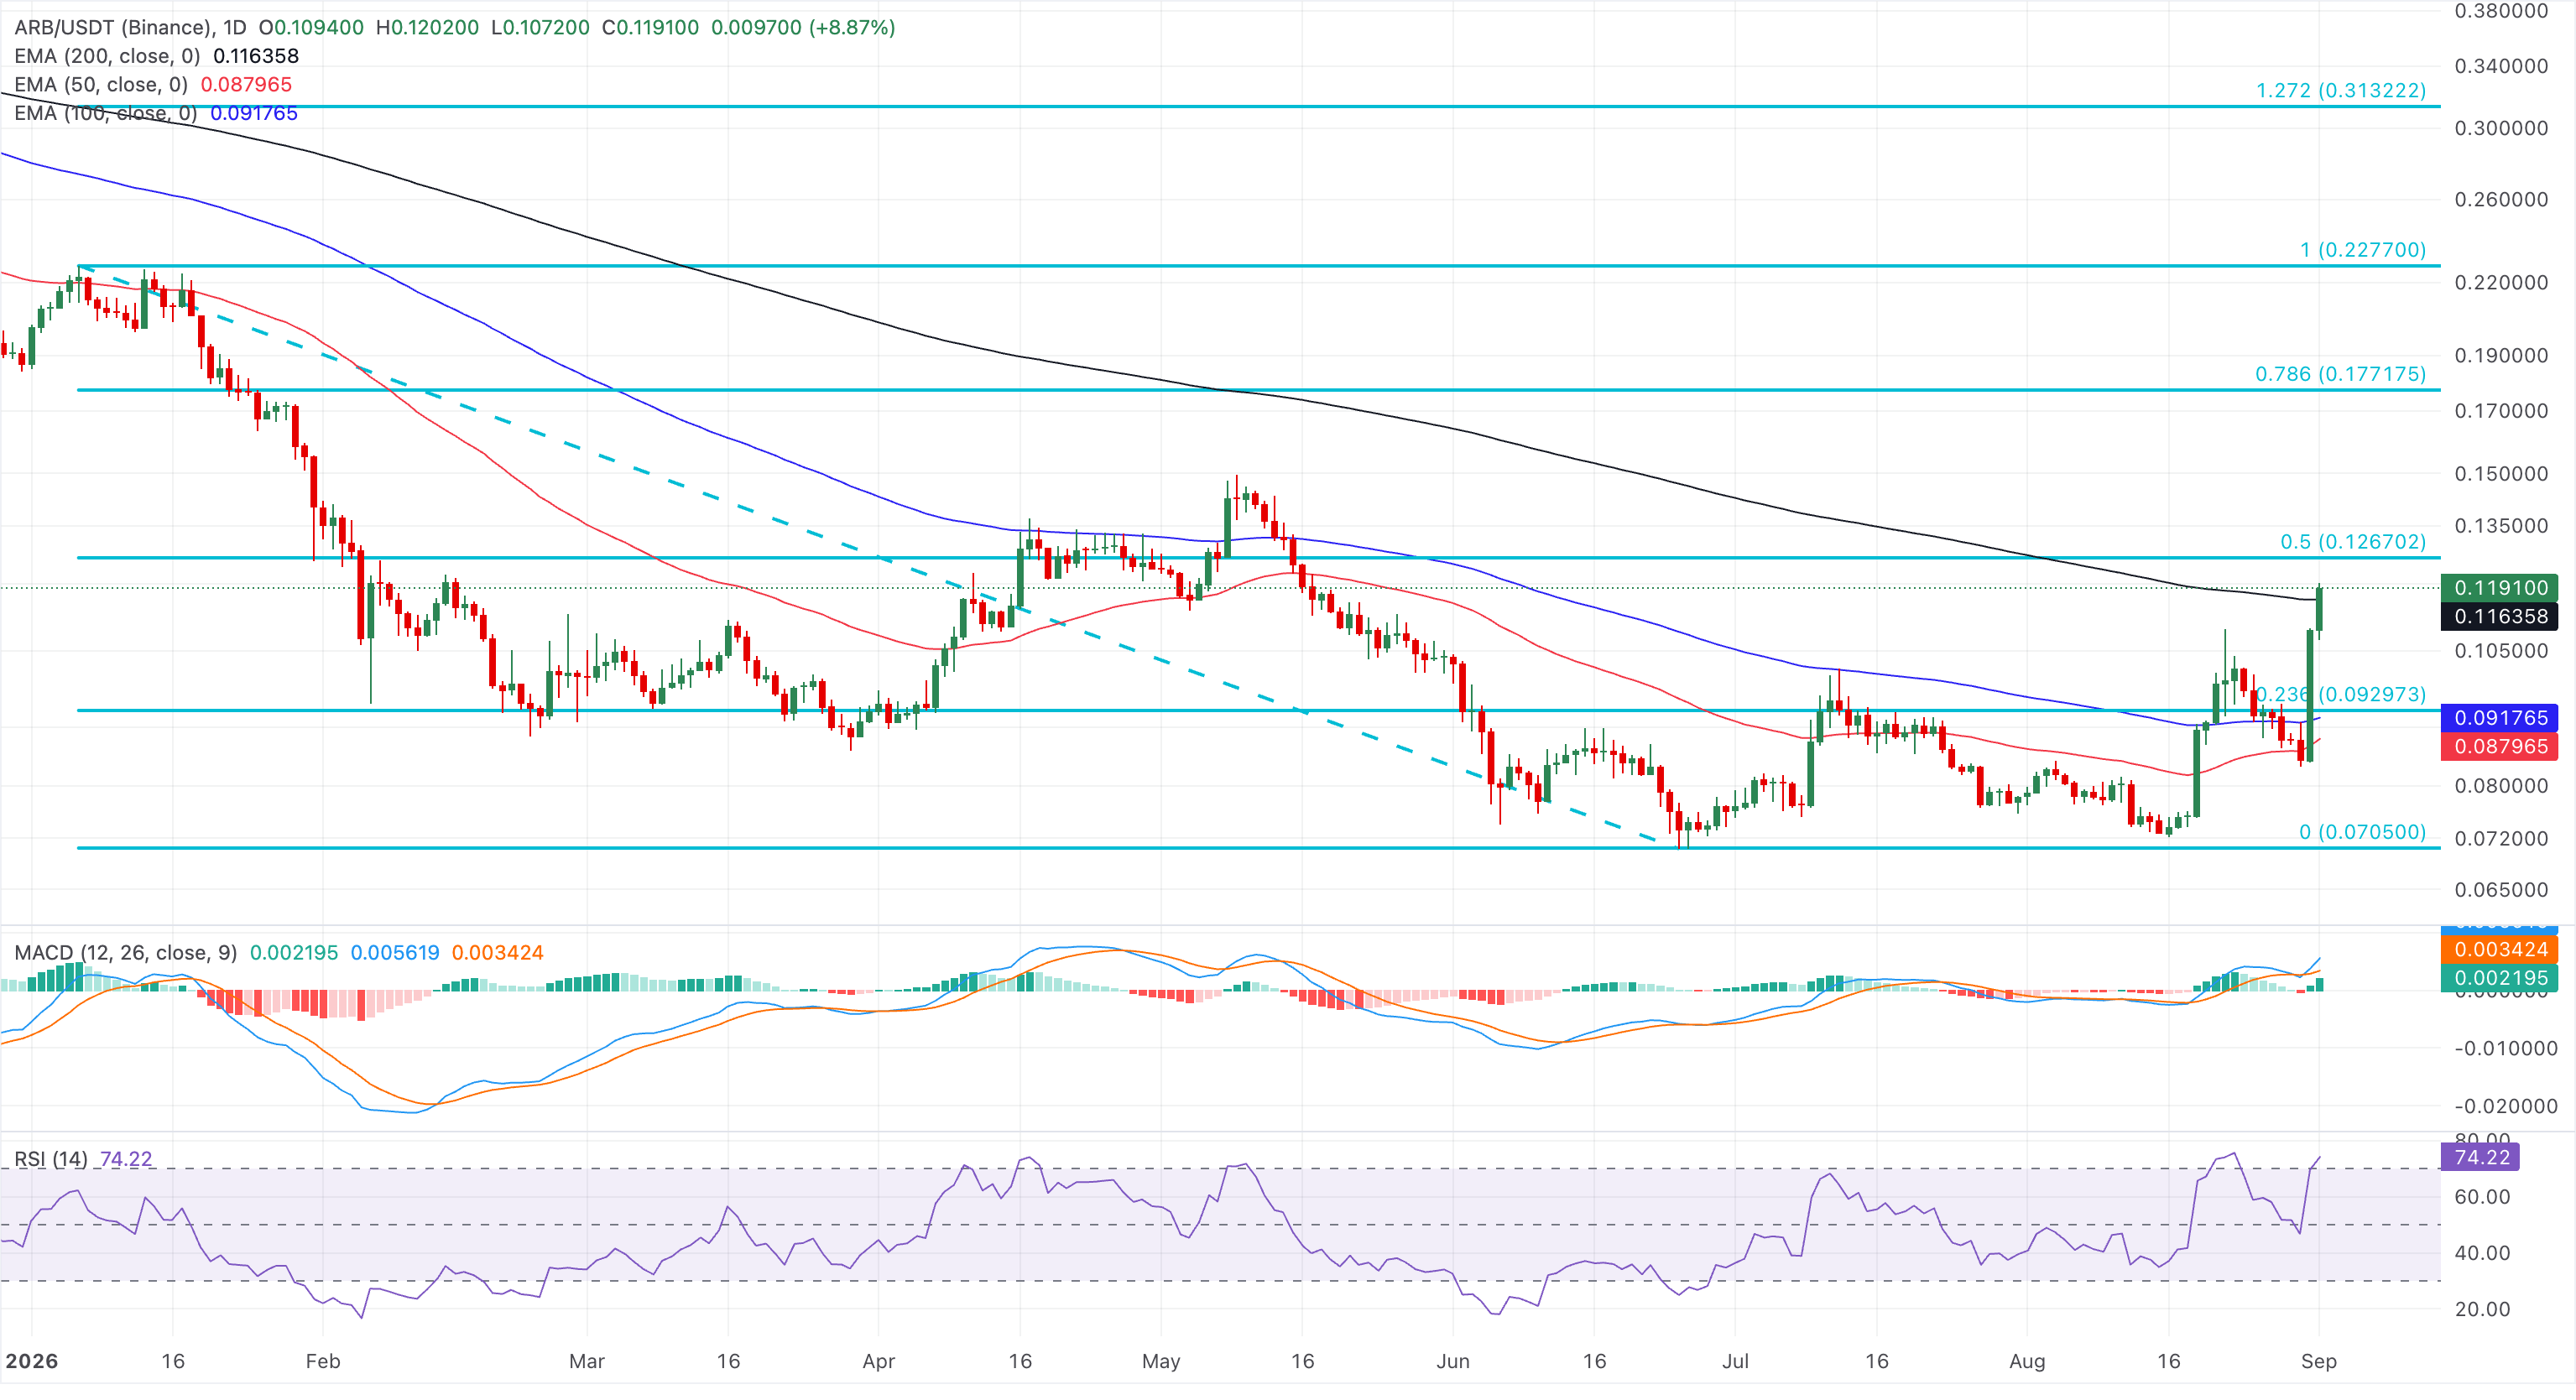
Looking down, immediate support is seen at the 23.6% Fibonacci retracement at $0.0929, followed by the 100-day and 50-day EMAs at $0.0917 and $0.0879, ahead of the structural floor at $0.0705.
Curve DAO trades at $0.3497 on Tuesday, extending its 14% gains from the previous day. CRV maintains a bullish near-term bias with the 50-day, 100-day, and 200-day EMAs at $0.2645, $0.2483, and $0.2699, forming a broad underlying demand area.
Momentum metrics back the topside tone, with the RSI hovering around 68, close to overbought territory, while the MACD has turned positive and continues to edge higher, hinting at persistent buying pressure.
The immediate resistance is seen at the 78.6% retracement, measured from $0.4578 to $0.1700, at $0.3703, ahead of the cycle high at the 100% retracement near $0.4578.
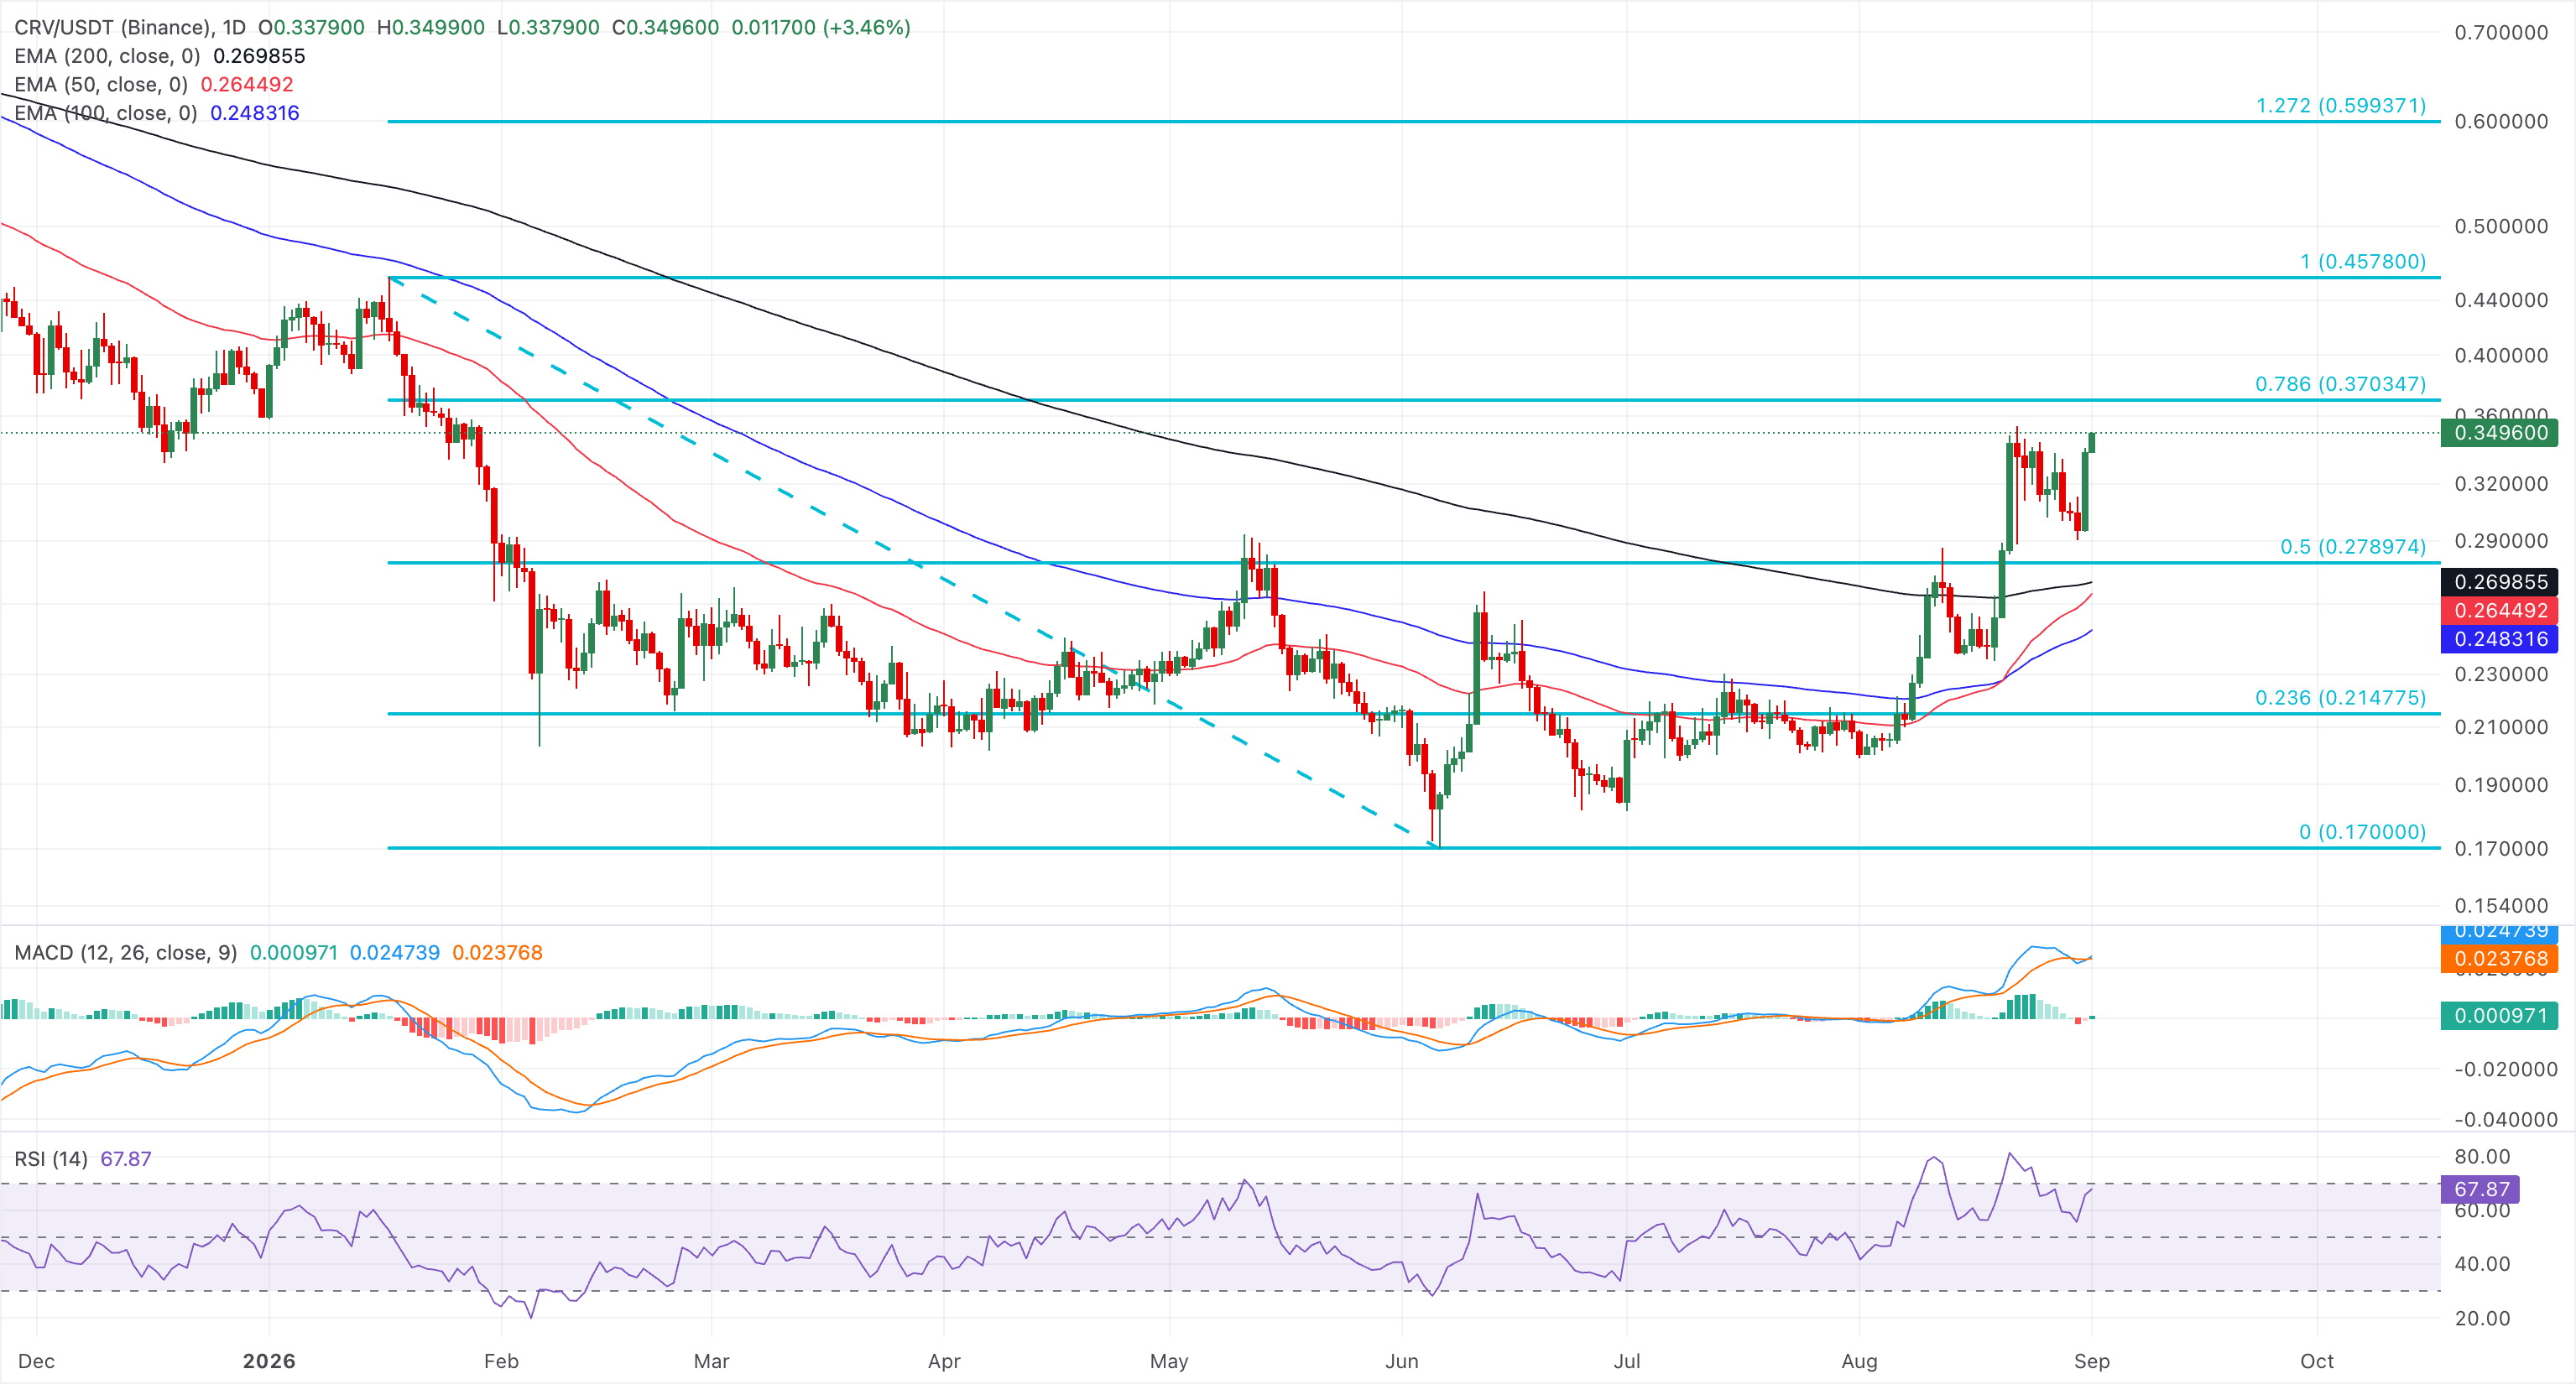
On the flip side, the key support for CRV aligns with the 50% retracement level at $0.2789. Deeper pullbacks would expose the cluster of medium- and long-term EMAs between $0.2699 and $0.2483, with the 23.6% retracement at $0.2379 acting as a more distant structural floor.
(The technical analysis of this story was written with the help of an AI tool. Know more.)
Nothing in this material constitutes investment advice, personal recommendation, investment research, an offer, or a solicitation to buy or sell any financial instrument. The content has been prepared without consideration of your individual investment objectives, financial situation, or needs, and should not be treated as such.
Past performance is not a reliable indicator of future performance and/or results. Forward-looking scenarios or forecasts are not a guarantee of future performance. Actual results may differ materially from those anticipated.
Mitrade makes no representation or warranty as to the accuracy or completeness of the information provided and accepts no liability for any loss arising from reliance on such information.
Recommended Articles


