



Uniswap Price Forecast: UNI rally stretches thin amid waning retail demand
- Uniswap is down 2% on Thursday, capped below $6.00 after rallying over 80% in more than two weeks.
- UNI derivatives indicate a sell-side bias, with Open Interest down 12% and around $2 million in long liquidations over the last 24 hours.
- The technical outlook for UNI indicates a pullback bias, with momentum indicators signaling an overstretched rally.
Uniswap (UNI) is down 2% on Thursday, facing fresh selling pressure near the $6.00 mark after a steady recovery of over 80% in more than two weeks. Retail speculation is beginning to fade, with UNI futures Open Interest down 12% over the last 24 hours and a long positional wipeout of more than $2 million. The technical outlook for PI suggests a downside bias as momentum stretches thin.
Retail demand is losing strength
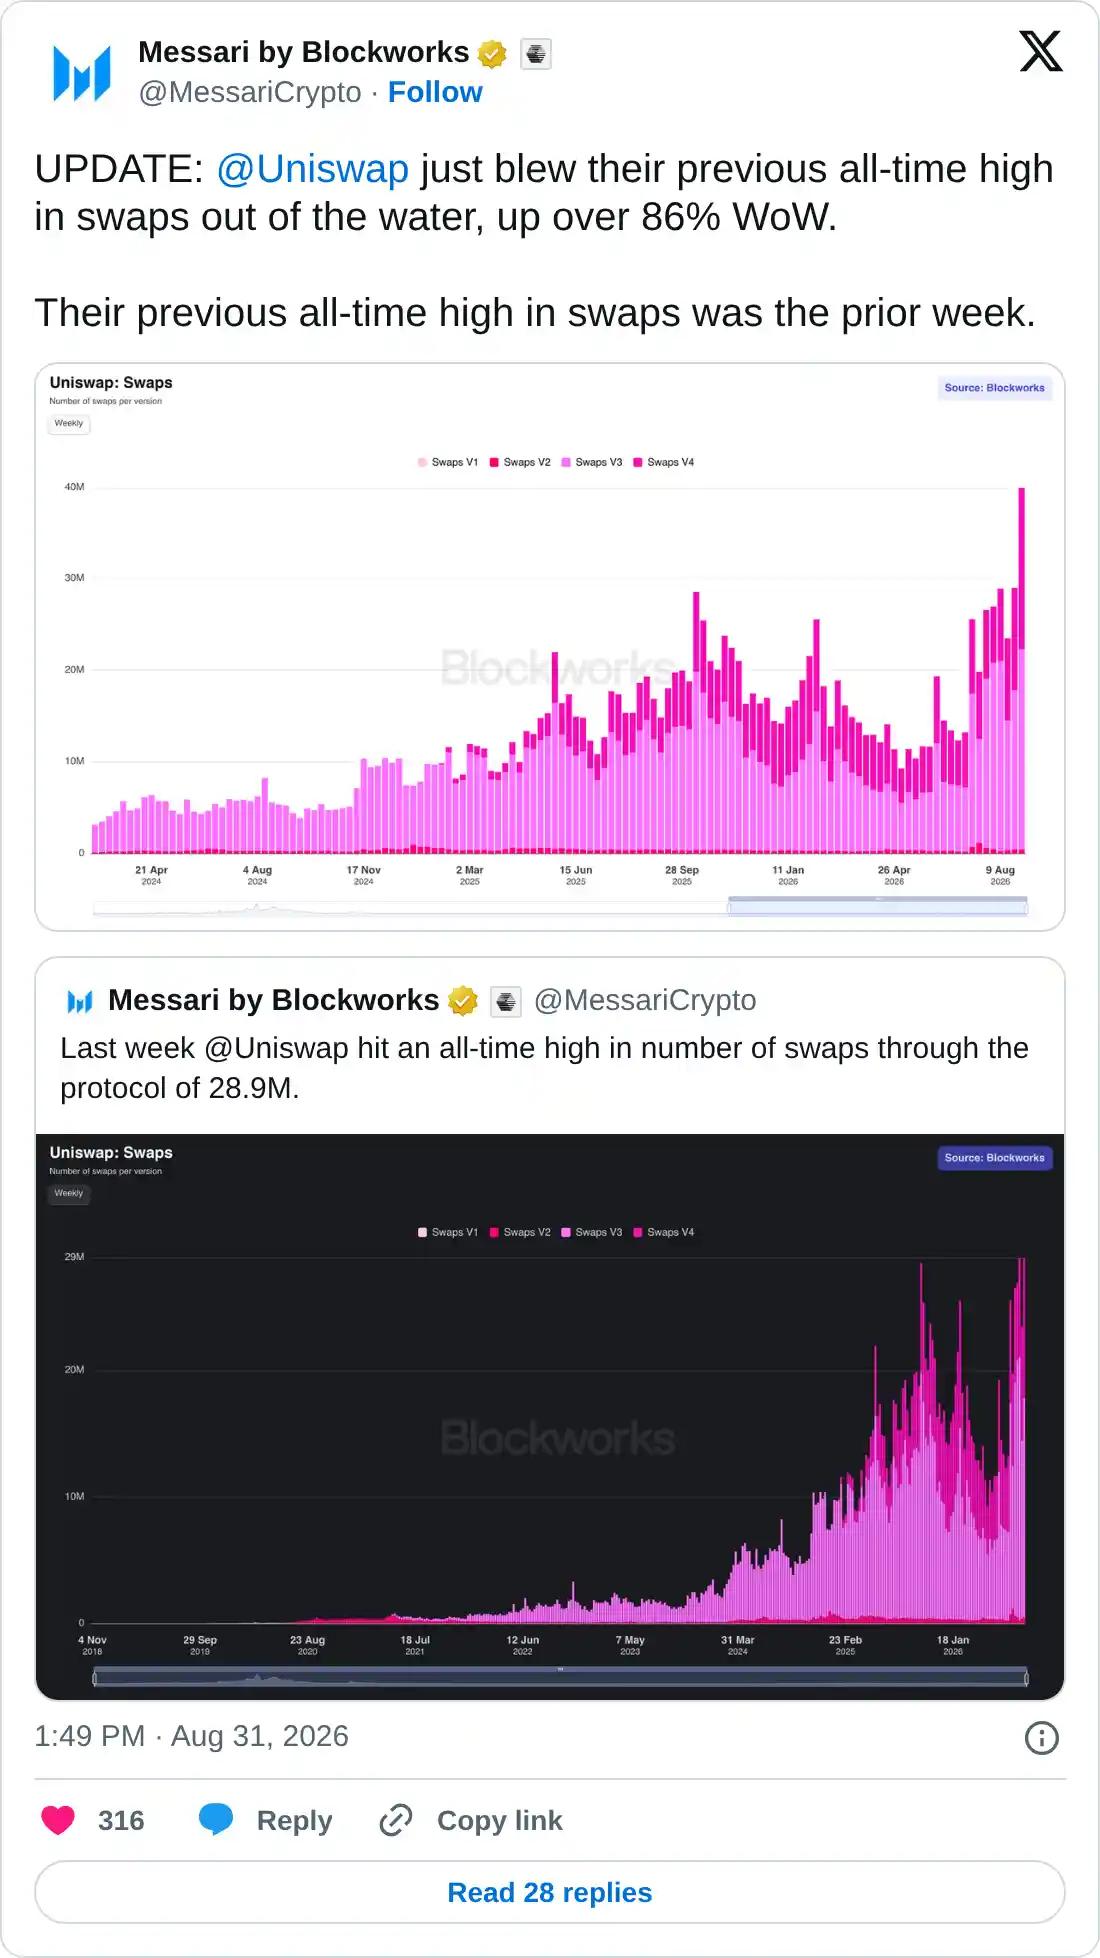
Uniswap is losing its retail strength after a steady recovery over the last 15 days, driven by strong on-chain performance. Uniswap processed another around $2 billion in Robinhood Stock Token volume in the last 2 weeks, while swaps reached a record high of 40 million last week.
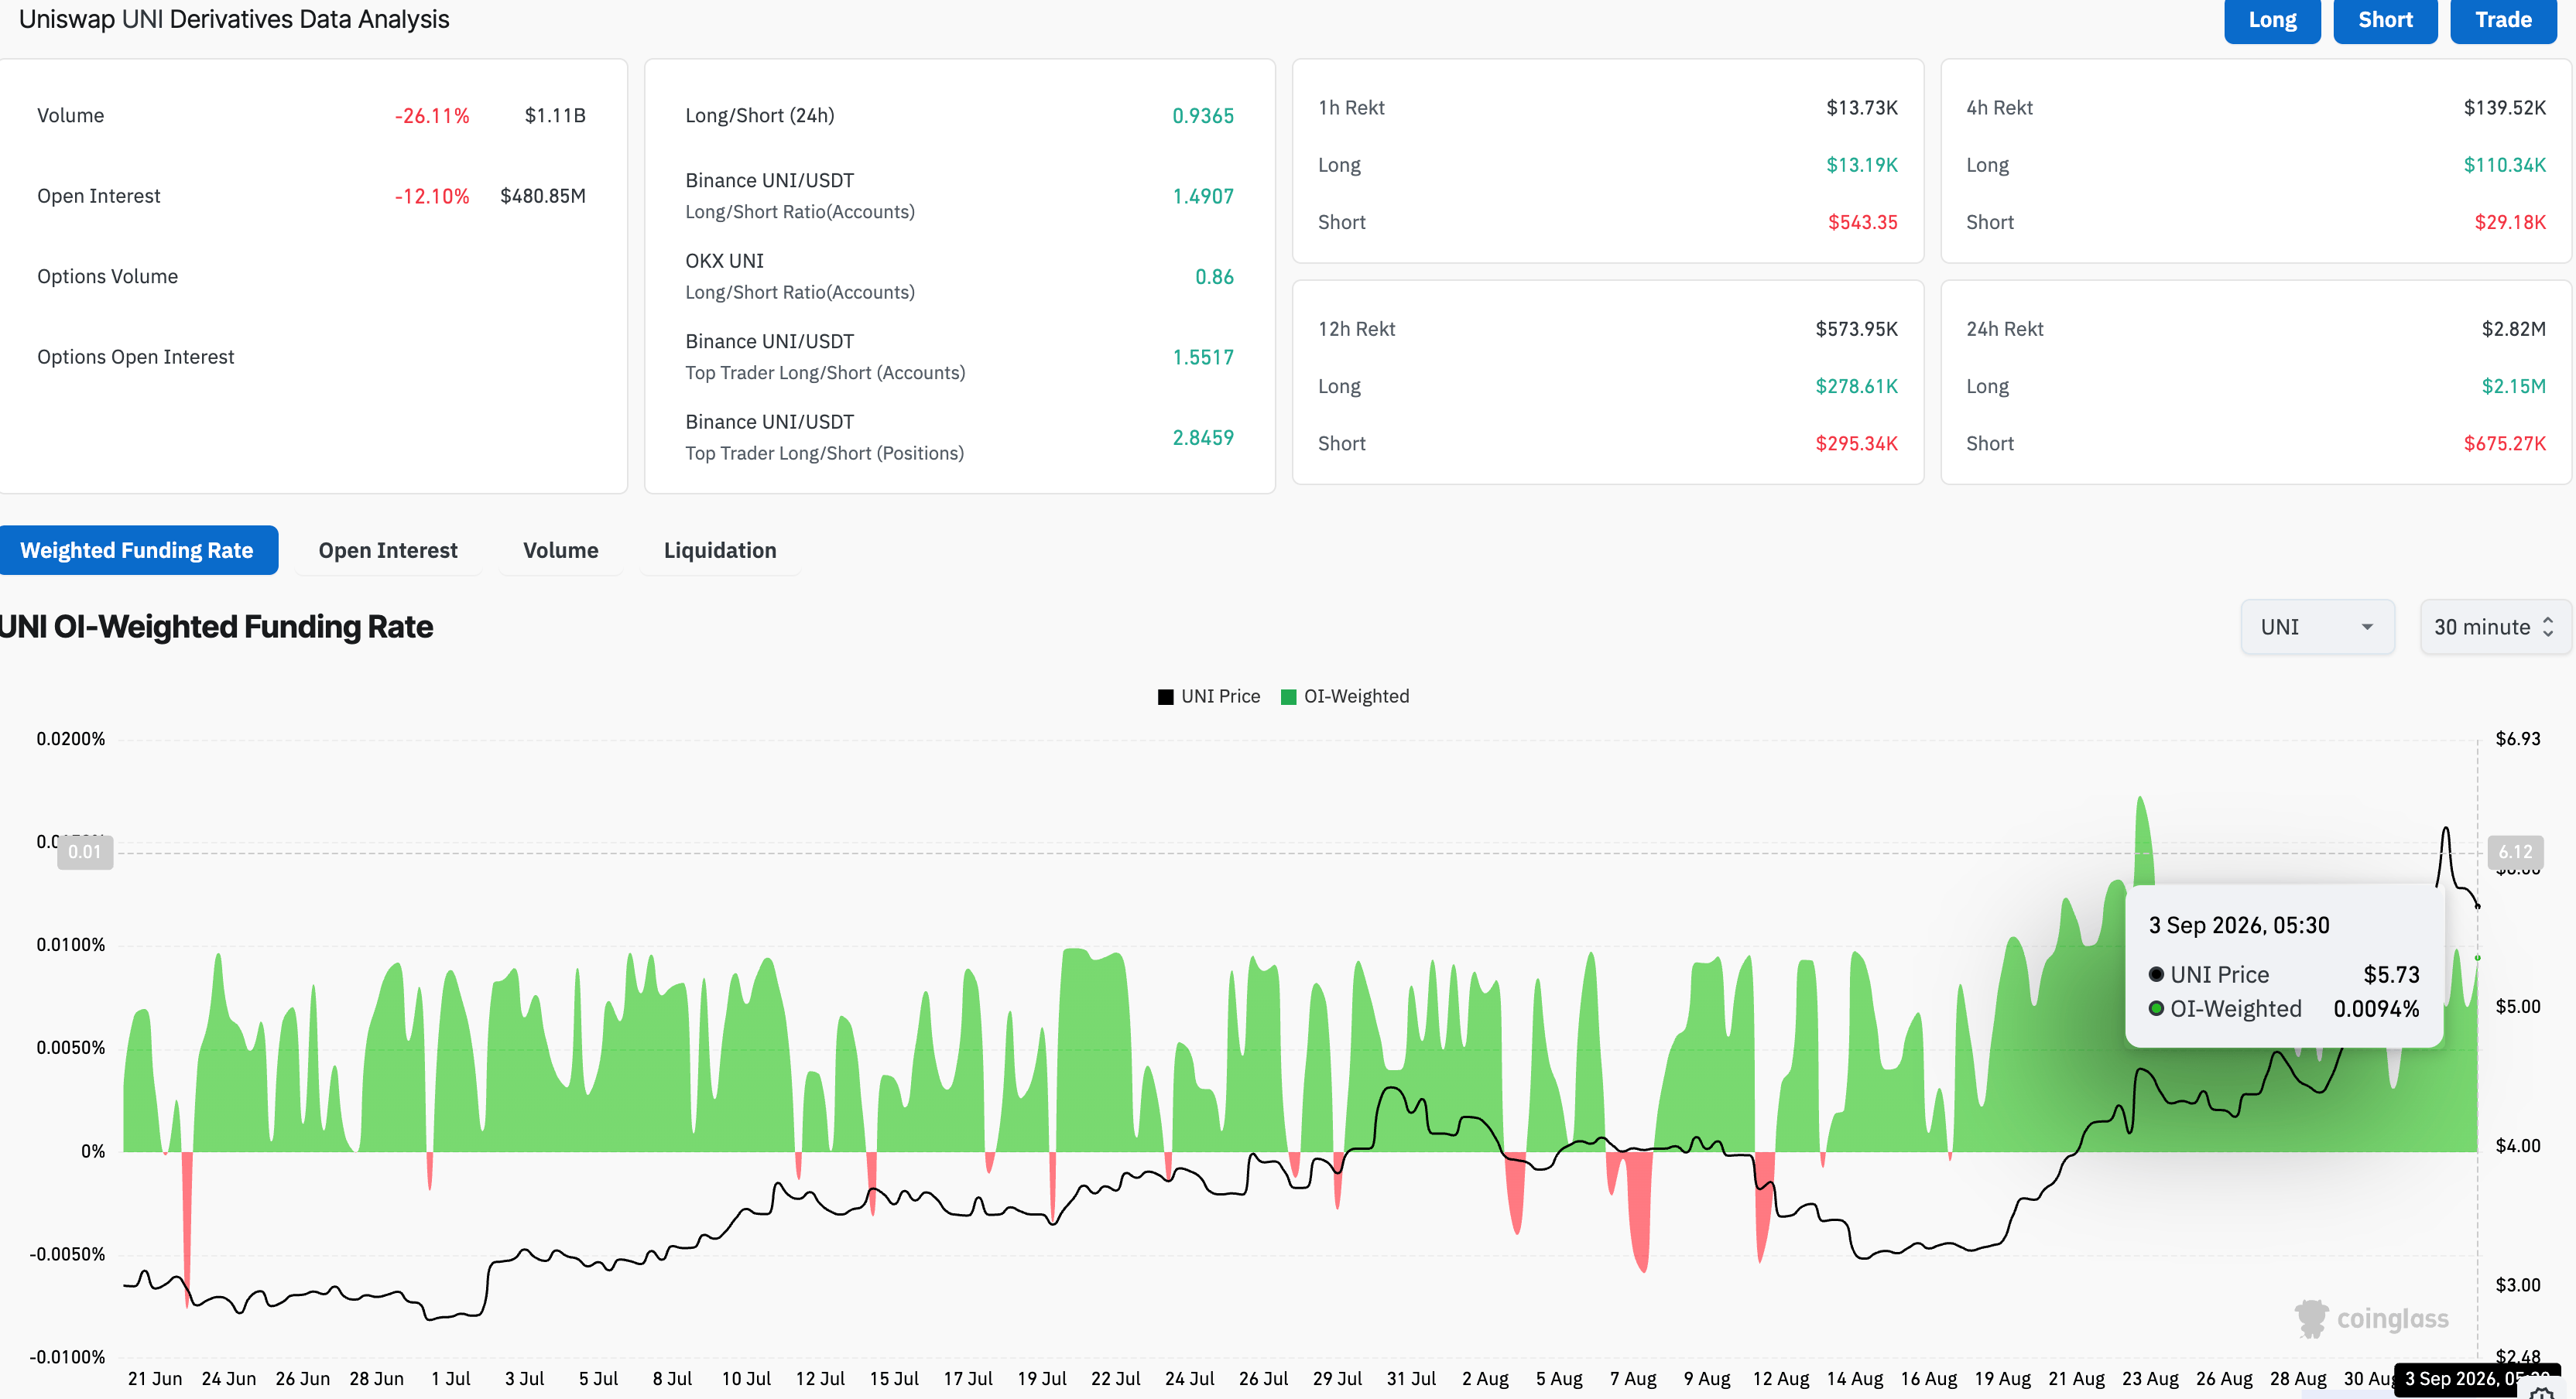
CoinGlass data shows UNI Open Interest (OI) is down 12% to $480.85 million over the last 24 hours, suggesting a positional wipeout or a reduction in notional value due to the decline in the spot price. Total liquidation of $2.85 million, led by $2.15 million in long liquidation, reaffirms the unwinding of bullish positions.
Still, the OI-weighted funding rate of 0.0094% suggests that traders are inclined to take long positions at a premium despite the higher risk of liquidation, in hopes of an extended recovery.
Technical outlook: Will UNI rally extend above $6?
Uniswap trades around $5.73 at press time on Thursday, as price remains capped below the $6.00 threshold. Still, UNI maintains a bullish bias after a steady upward trend since August 15 and recording an annual high of $6.38 the previous day.
Uniswap holds well above the 50-day Exponential Moving Average (EMA) at $4.15, which crosses above the 200-day EMA at $3.98, marking a Golden Cross patten, which supports the uptrend and signals bullish trend reversal.
From a technical perspective, a confirmed breakout above the R1 Pivot Point at $6.09 could target the overhead R2 and R2 Pivot levels at $6.95 and $8.41, respectively. Momentum remains constructive on the daily chart, with the Moving Average Convergence Divergence (MACD) holding above its signal line, while the Relative Strength Index (RSI) at 74 flags overbought conditions.
On the downside, initial technical support is seen at the recent breakout area around the broken resistance trendline near $4.74, followed by the 50-day EMA at $4.15 where dip-buying interest could re-emerge if a pullback develops.
(The technical analysis of this story was written with the help of an AI tool. Know more.)
Nothing in this material constitutes investment advice, personal recommendation, investment research, an offer, or a solicitation to buy or sell any financial instrument. The content has been prepared without consideration of your individual investment objectives, financial situation, or needs, and should not be treated as such.
Past performance is not a reliable indicator of future performance and/or results. Forward-looking scenarios or forecasts are not a guarantee of future performance. Actual results may differ materially from those anticipated.
Mitrade makes no representation or warranty as to the accuracy or completeness of the information provided and accepts no liability for any loss arising from reliance on such information.
Recommended Articles


