



Crypto Today: Bitcoin, Ethereum, XRP extend sell-off amid ETF outflows
- Bitcoin falls below $83,000, aligning with a broader sell-off amid rising ETF outflows.
- Ethereum continues to trade under pressure, weighed down by capital outflows and weakening technical structure.
- XRP tests the 50-day and 200-day EMAs support cluster as selling pressure takes root across the crypto market.
Bitcoin (BTC) extends its decline below $83,000 on Thursday as heightened selling pressure weighs on the market. Leading altcoins, including Ethereum (ETH) and Ripple (XRP), mirror the sector-wide pullback, with ETH dipping under $2,600 and XRP challenging support at $1.40.
Bitcoin and Ethereum ETFs see heavy outflows
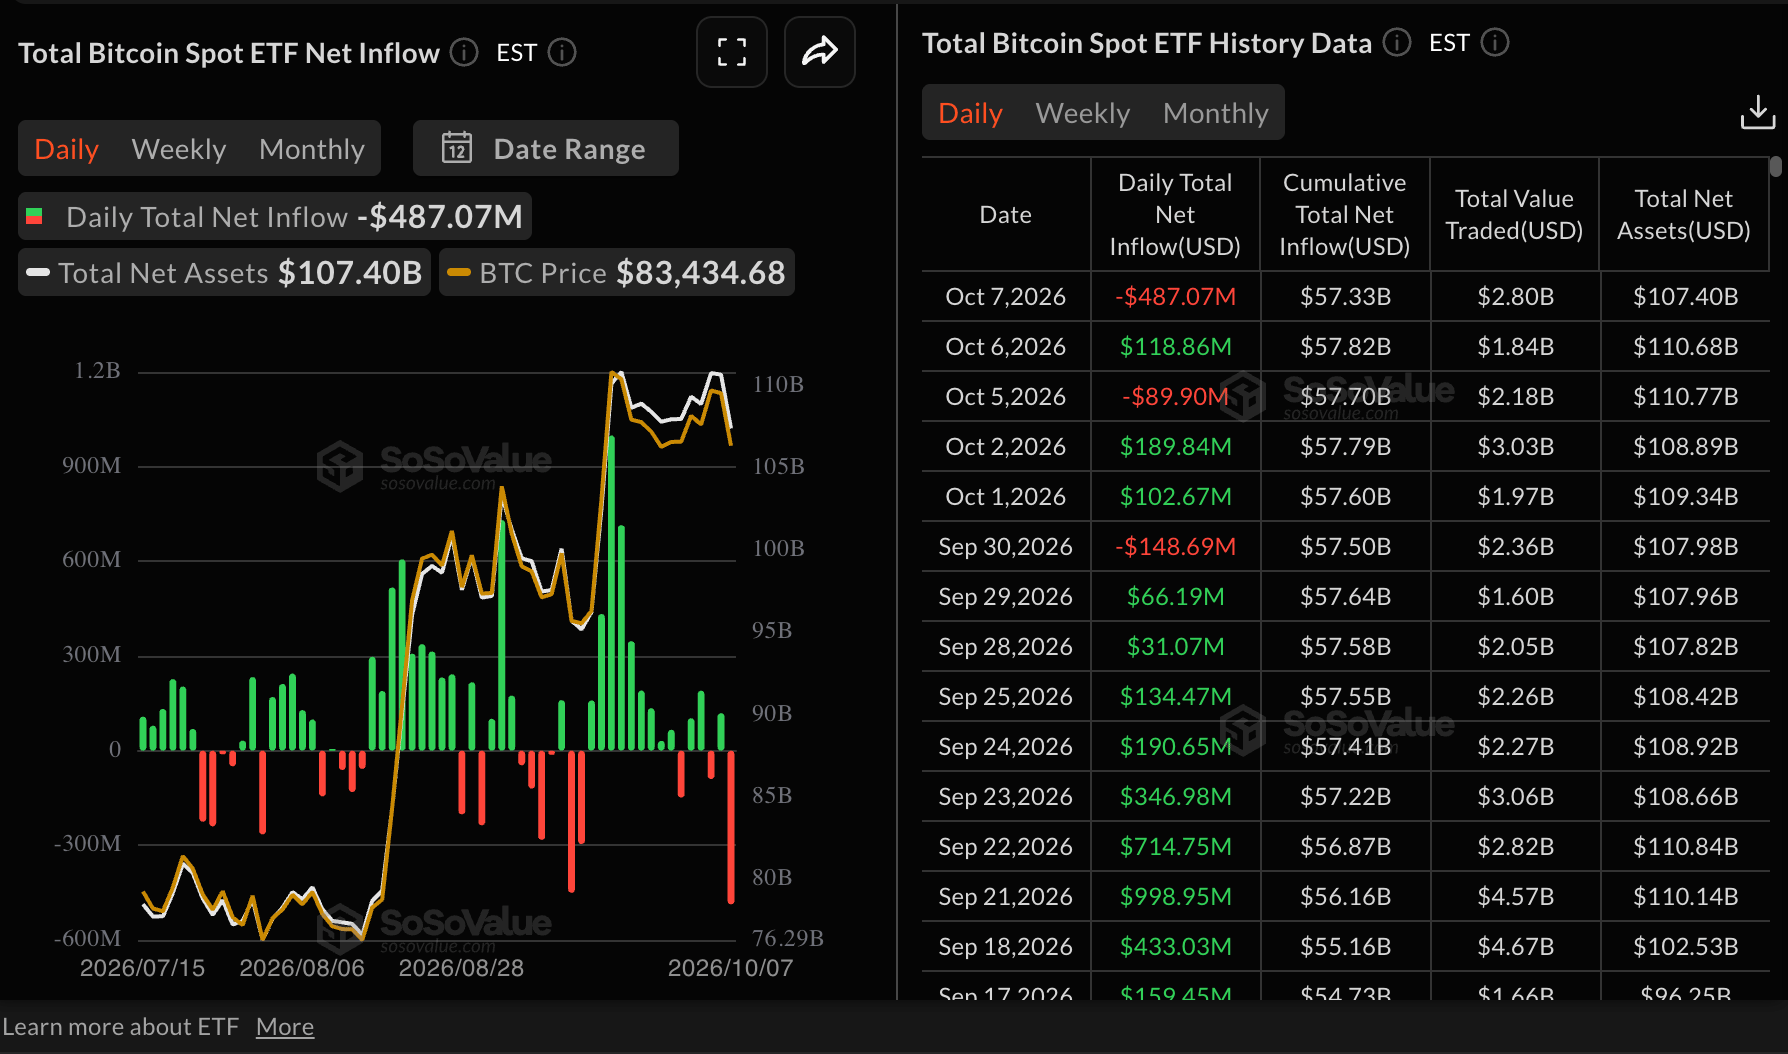
Bitcoin spot Exchange-Traded Funds (ETFs) are facing fading demand amid returning outflows, which totaled $487 million on Wednesday. The outflows followed a single day of inflows, averaging $119 million on Tuesday. Despite fading institutional demand, market sentiment remains relatively elevated, as reflected in the Crypto Greed & Fear Index at 64 in the Greed territory on Thursday, down from 71 the previous day. Sustained elevated appetite would cushion against the headwinds, allowing for consolidation ahead of another breakout attempt.
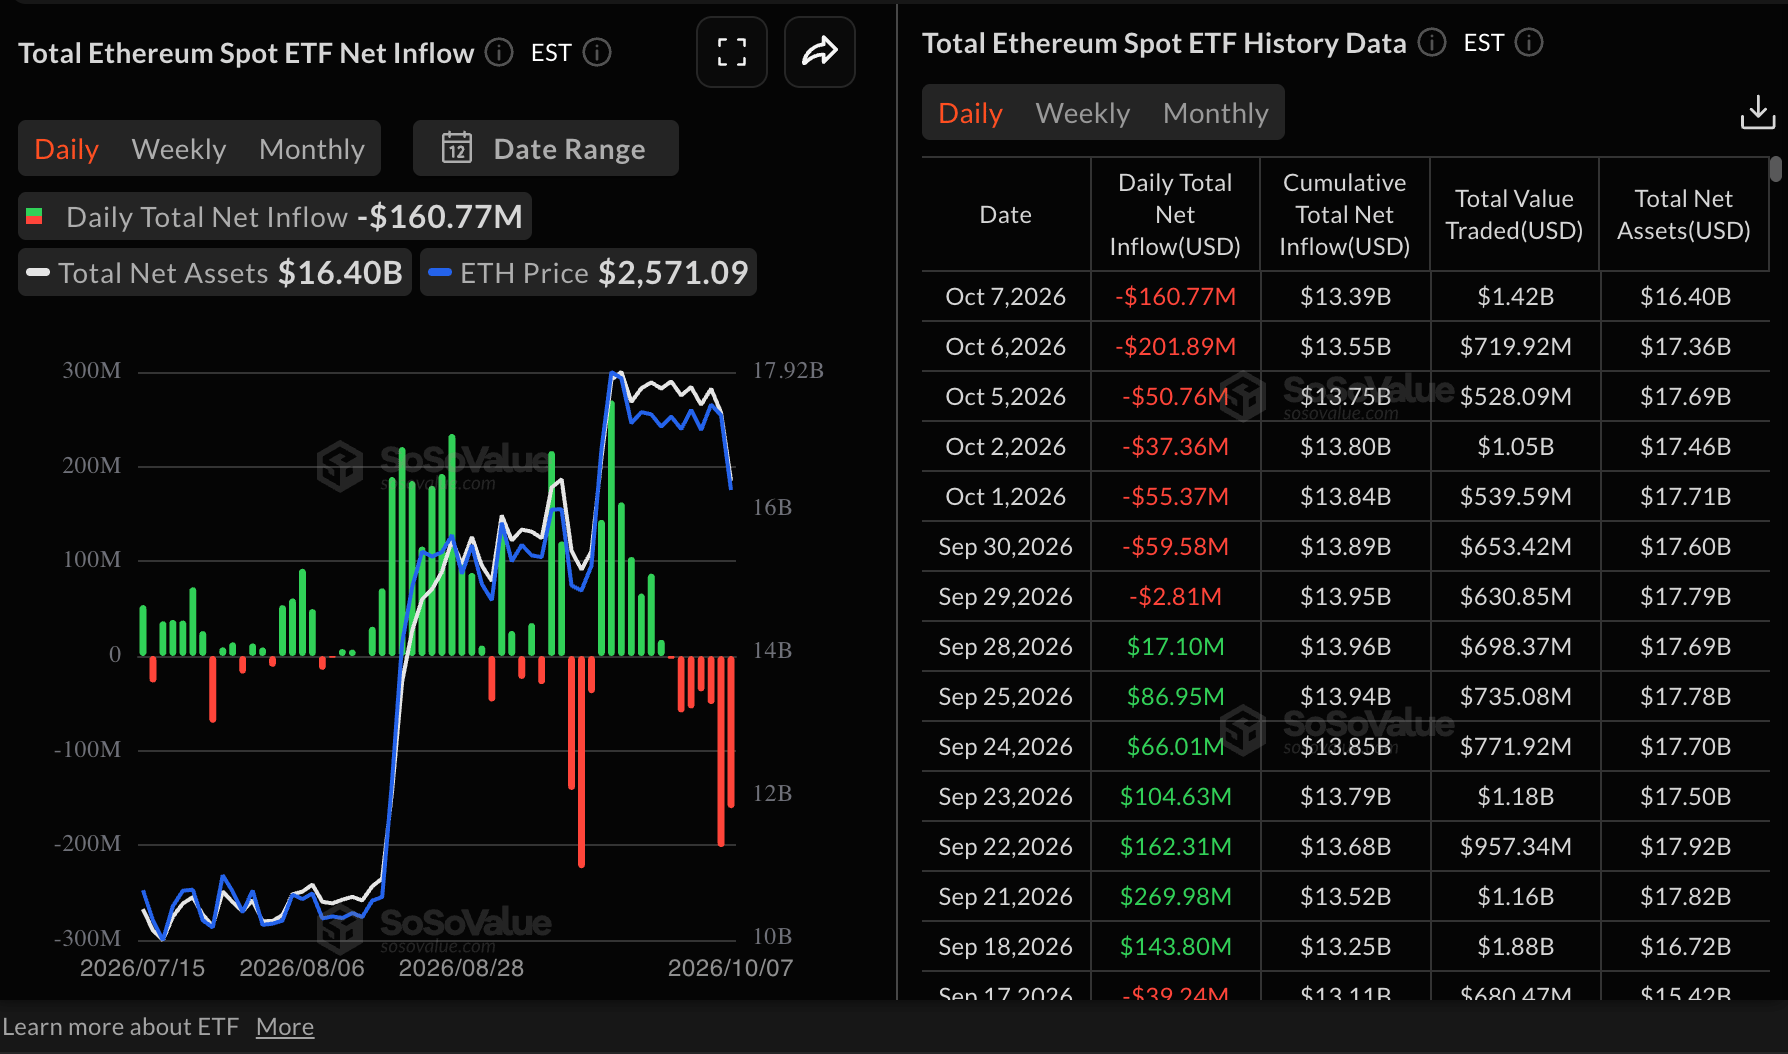
Ethereum spot ETFs extended their bearish streak for the seventh consecutive day, as investors withdrew $161 million on Wednesday. Cumulative inflows amount to $413 million this week through Thursday, suggesting that the US-listed ETFs are on course to log the second consecutive weekly outflows. Extended outflows signal growing headwinds, raising the odds of a heavy sell-off.
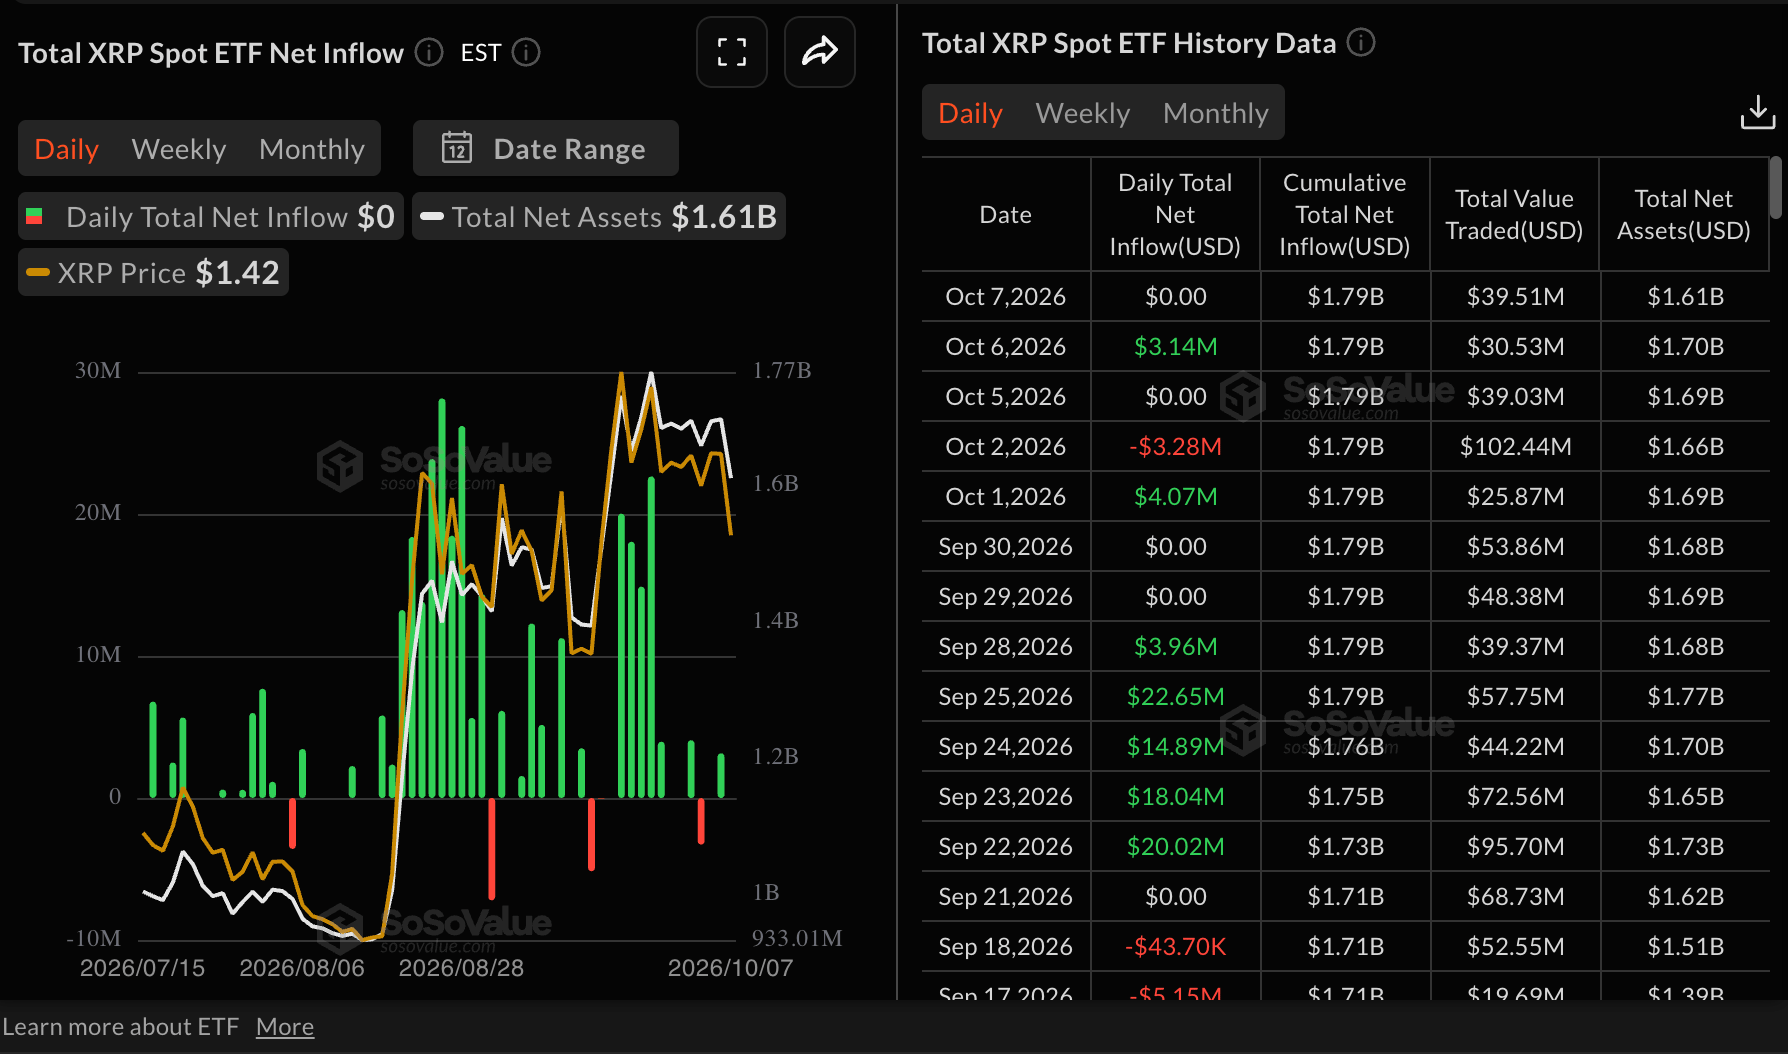
XRP spot ETFs are facing an erratic pattern amid inflows and muted activity this week. US-listed spot ETFs remained muted on Wednesday after recording outflows of $3 million the day before. As demand for the remittance token takes a back seat, the path of least resistance will likely stay downward.
“Bitcoin has already shown that strong ETF demand alone is not enough to drive a sustained rally when yields and the dollar are working against it,” Markus Levin, co-founder of XYO, said via email, adding, “if yields begin to fall while ETF inflows remain positive, Bitcoin could regain momentum toward $90,000 and eventually $100,000.”
Technical analysis: Bitcoin decline deepens
Bitcoin trades downward below $83,000 as bulls lose momentum. Despite falling for four consecutive days, the pair holds a constructive bullish bias as price stands well above the 50-day, 100-day, and 200-day Exponential Moving Averages (EMAs), suggesting the broader uptrend remains intact despite the latest consolidation.
The SuperTrend indicator at $79,664 also sits comfortably below spot, reinforcing dynamic support, while momentum is mixed, with the Moving Average Convergence Divergence (MACD) in negative territory and the Relative Strength Index (RSI) hovering near 51, hinting at a pause rather than a trend reversal.
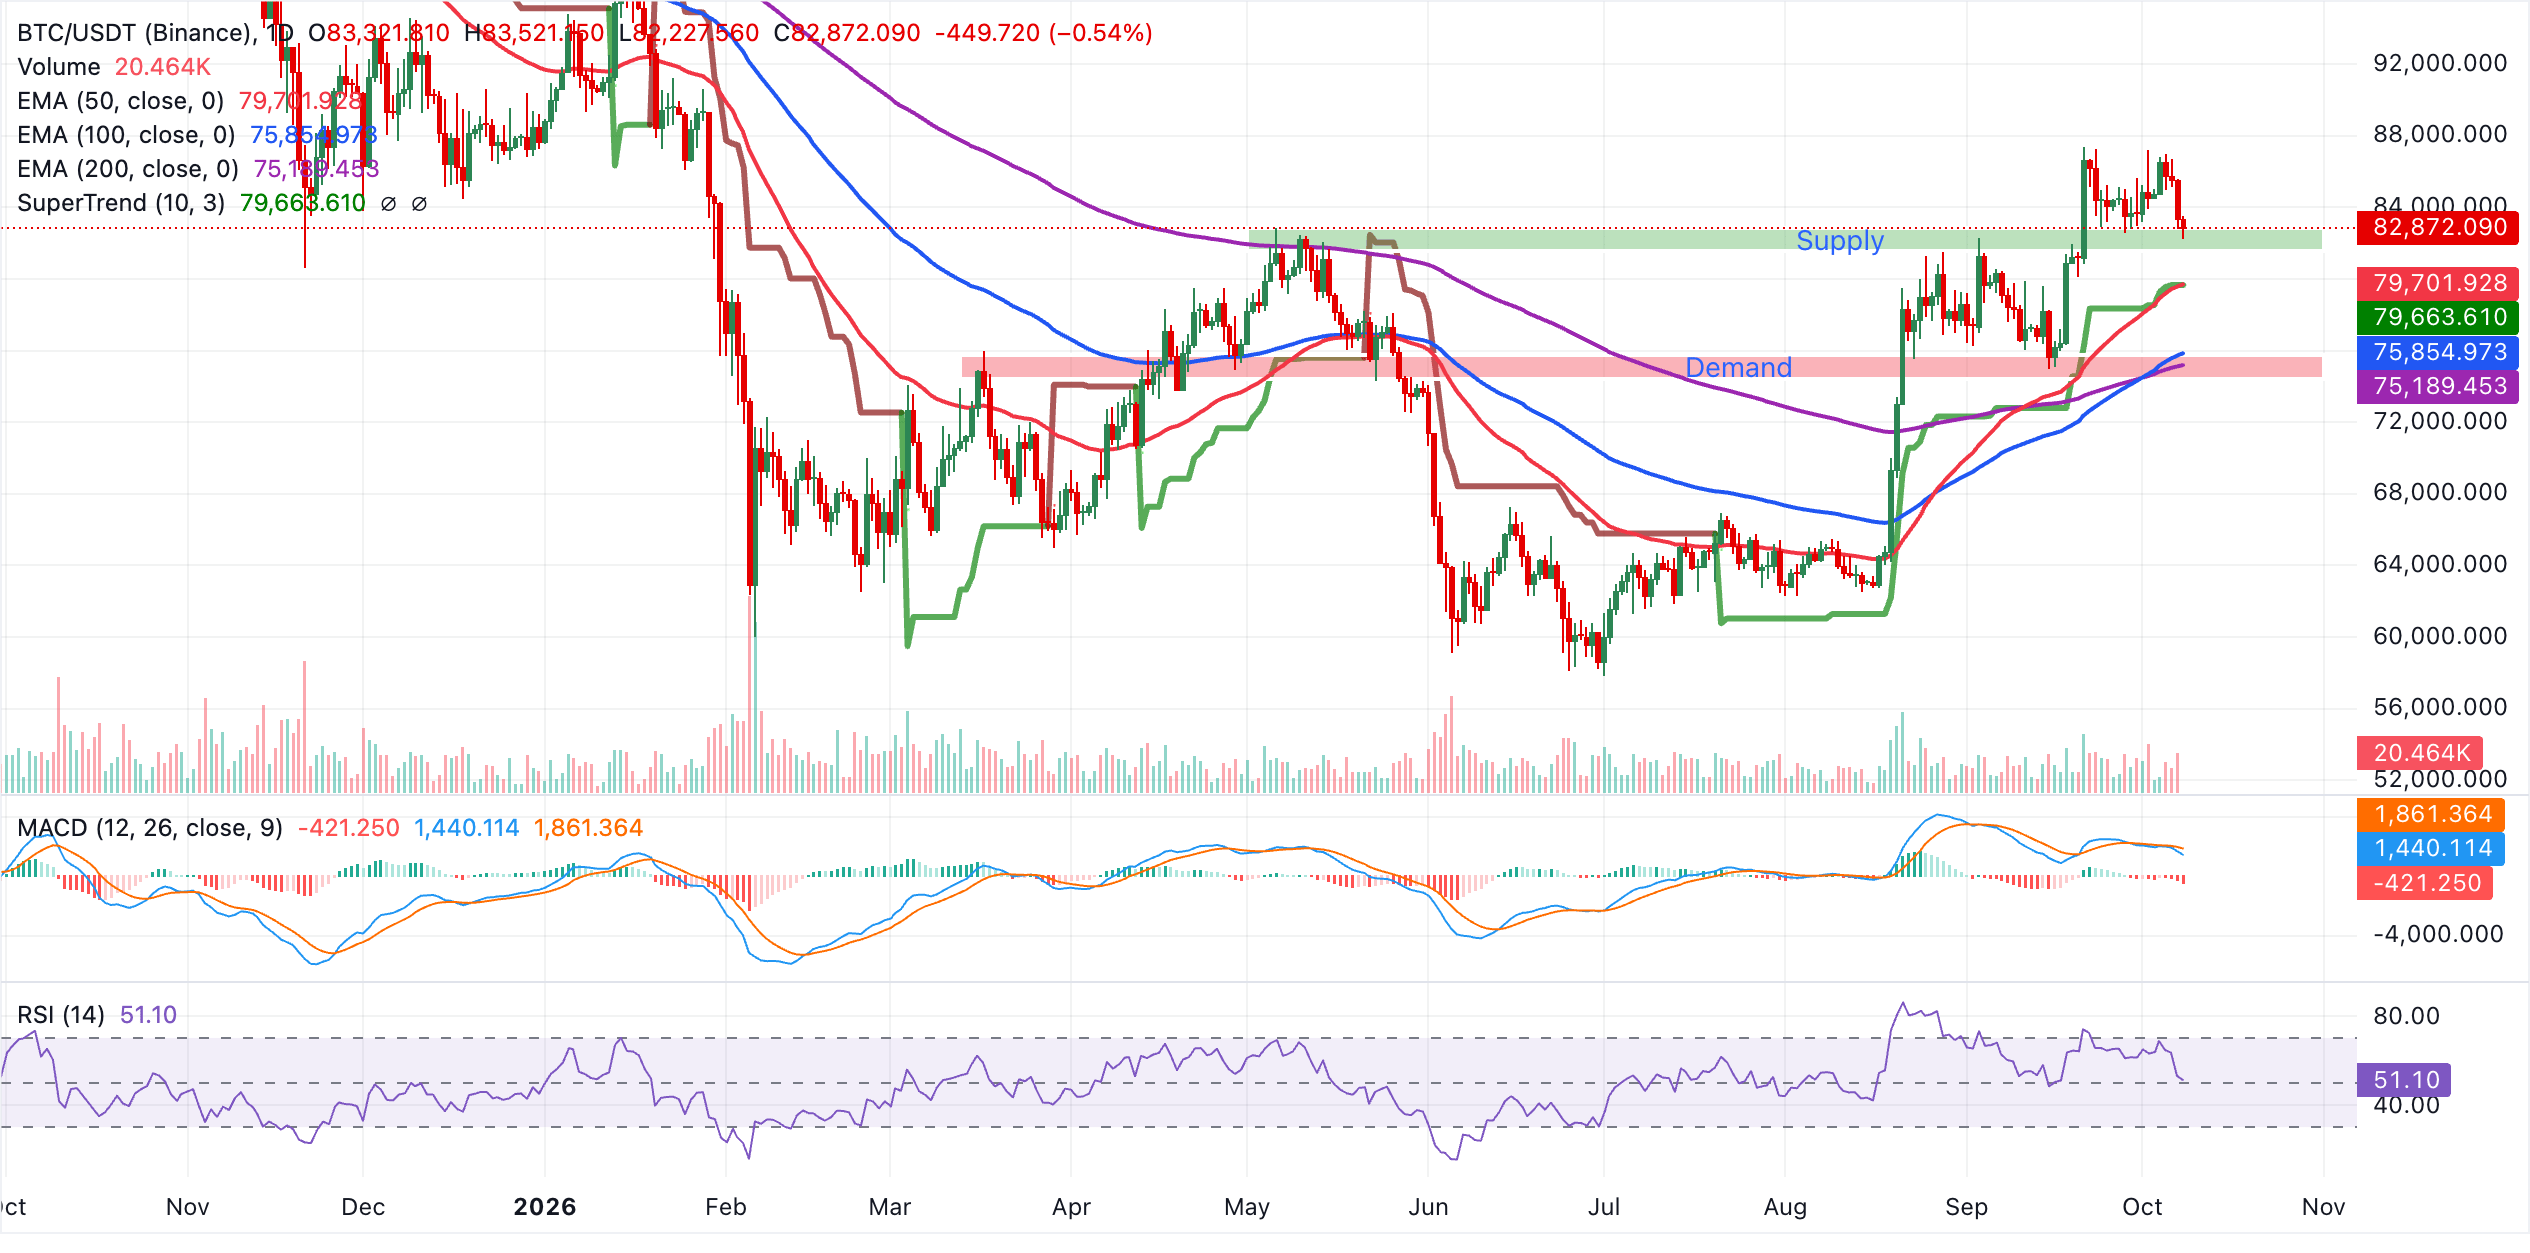
Immediate support lies at the recent pivot area near $83,000, ahead of a dense cluster formed by the 50-day EMA at $79,702 and the SuperTrend line at $79,664, which should act as the first meaningful defense on pullbacks. A deeper correction would expose the 100-day EMA at $75,855 and then the 200-day EMA at $75,189, where buyers are likely to re-emerge to protect the prevailing bullish structure.
Altcoins technical outlook: Ethereum and XRP bulls lose grip
Ethereum trades at $2,560 as bulls eye short-term stability amid losses incurred this week. Still, the smart contract token holds a constructive bias as price remains above the short- and long-term moving averages. The 50-day EMA at $2,506, together with the 100-day and 200-day EMAs at $2,339 and $2,295, respectively, suggests the broader uptrend is still supported despite the recent pullback.
The SuperTrend line at $2,478 also sits below spot, reinforcing the idea of underlying demand. However, momentum has cooled, with the RSI near 44 and the MACD line deeply negative, hinting that bulls may be losing conviction in the near term.
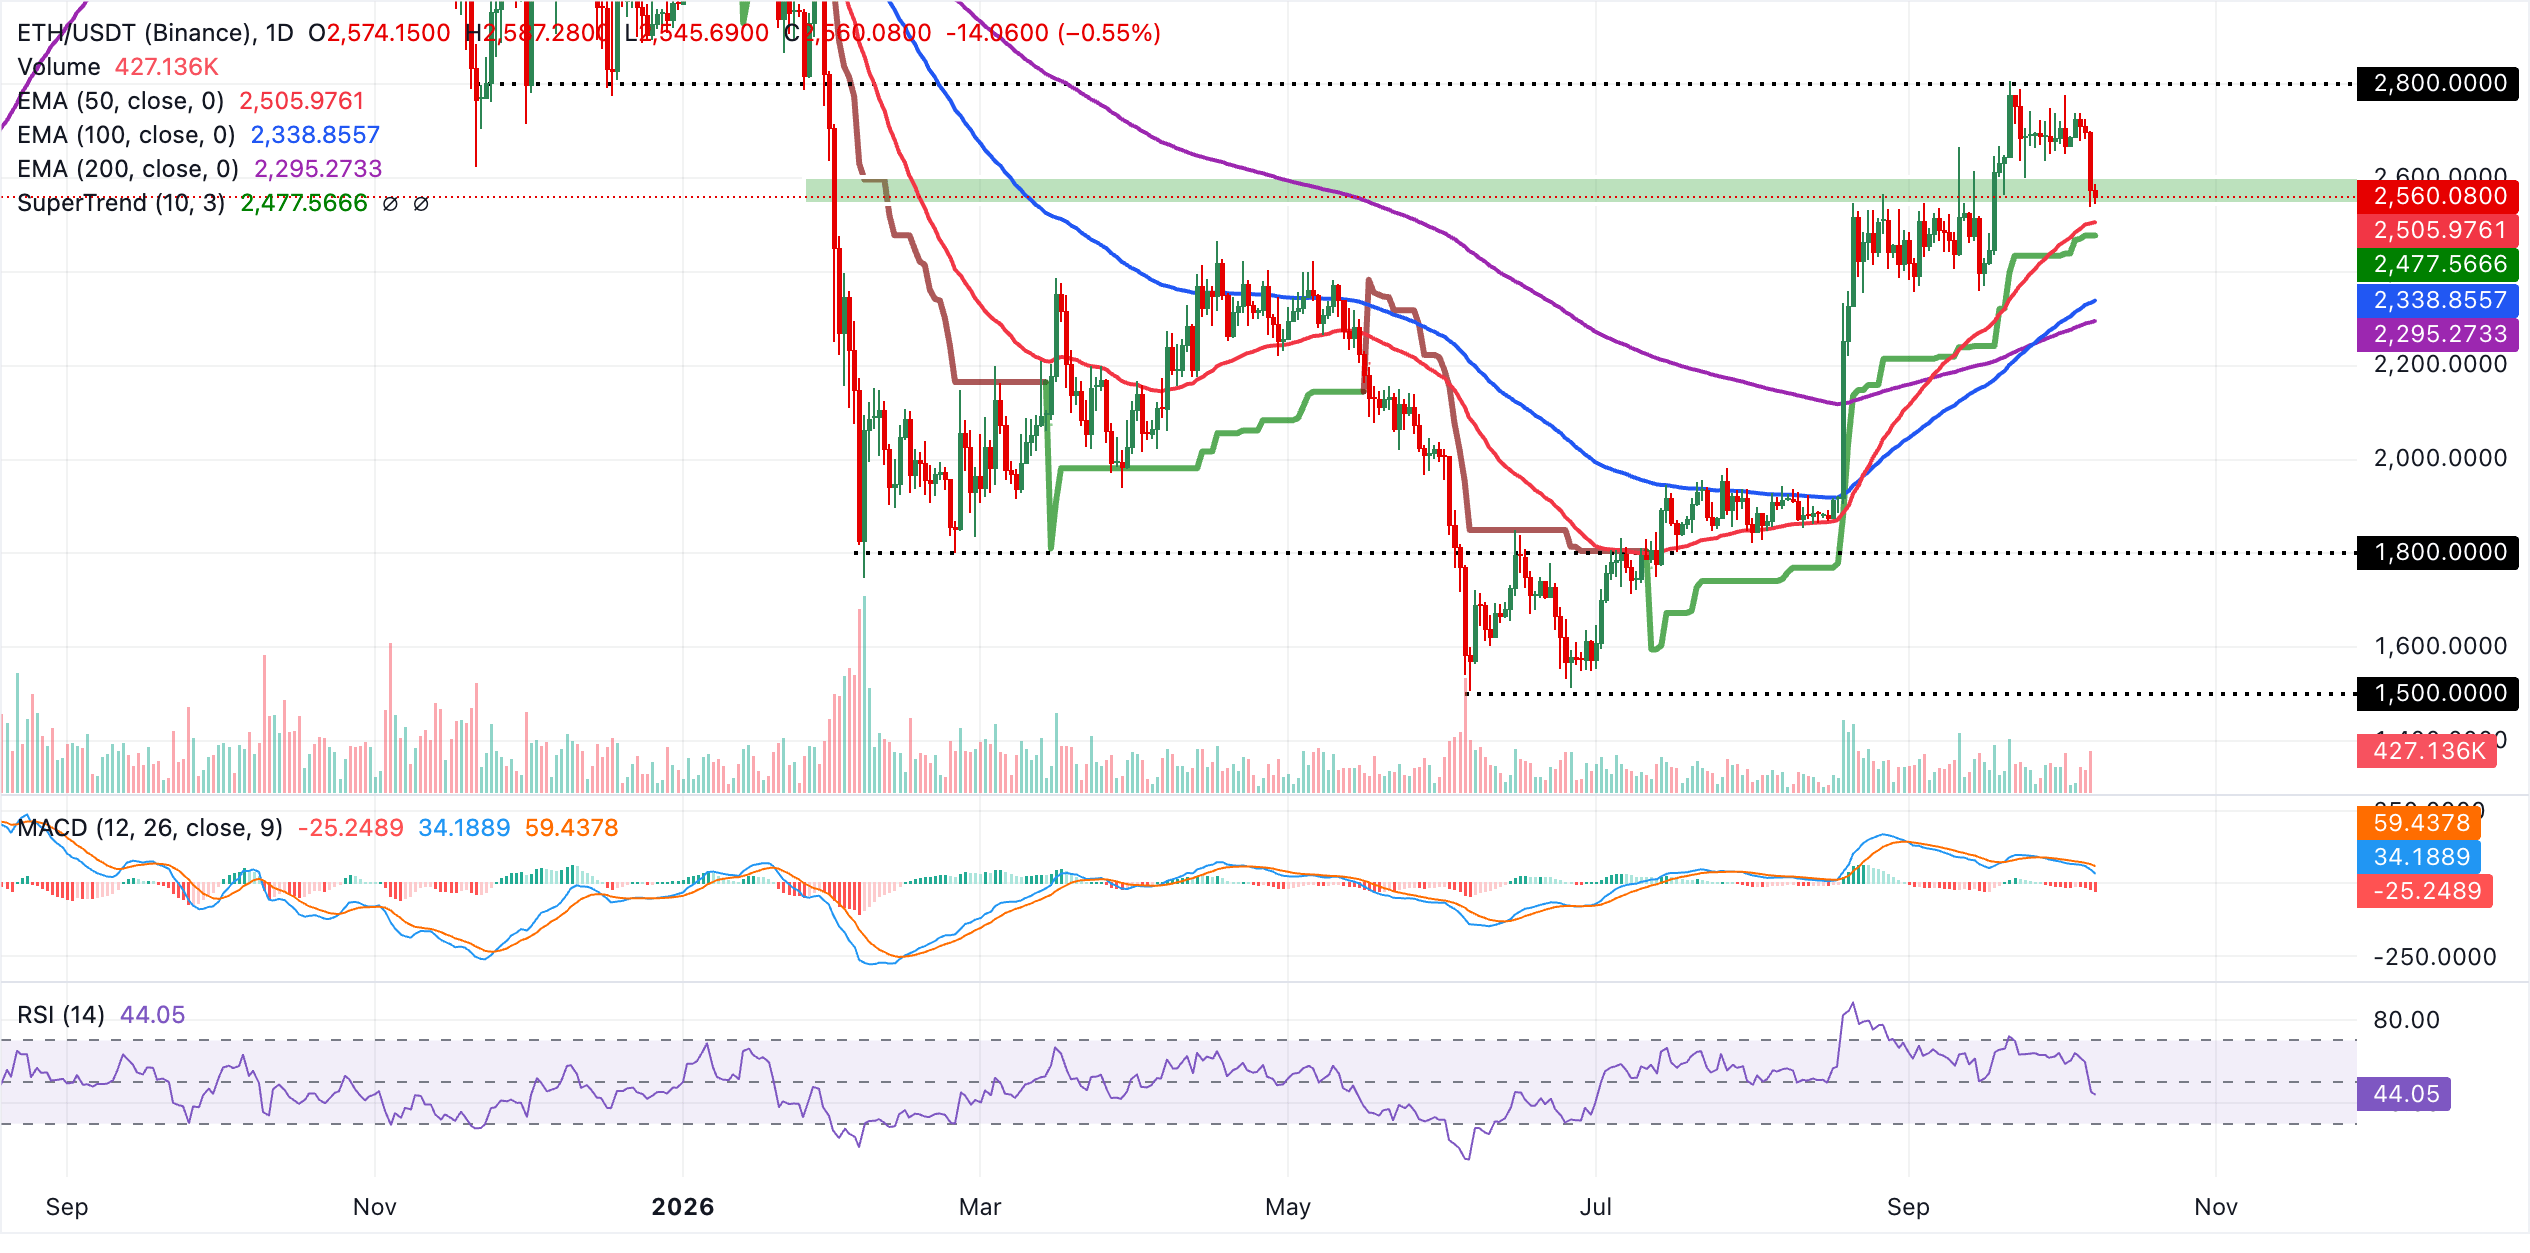
Initial support lies at the 50-day EMA around $2,505, ahead of the SuperTrend baseline near $2,478. A sustained break below these levels would expose deeper support at the 100-day EMA at $2,339 and then the 200-day EMA at $2,295, where dip-buying interest could re-emerge.
With no clear overhead reference on the daily chart, any recovery above the recent close would largely be guided by market psychology rather than defined chart barriers, leaving price action vulnerable to swings until fresh resistance levels are established.
XRP, meanwhile, trades at $1.41 amid intense selling pressure. Still, the remittance holds a constructive bullish bias as price sits above the short, medium and long-term EMAs. The MACD shows the line below its signal, with both hovering around the zero line and a slightly negative, contracting histogram, suggesting waning bullish momentum but not yet a decisive bearish shift. At the same time, the RSI near 45 has eased from prior overbought readings, hinting at a consolidative phase within an overall positive structure.
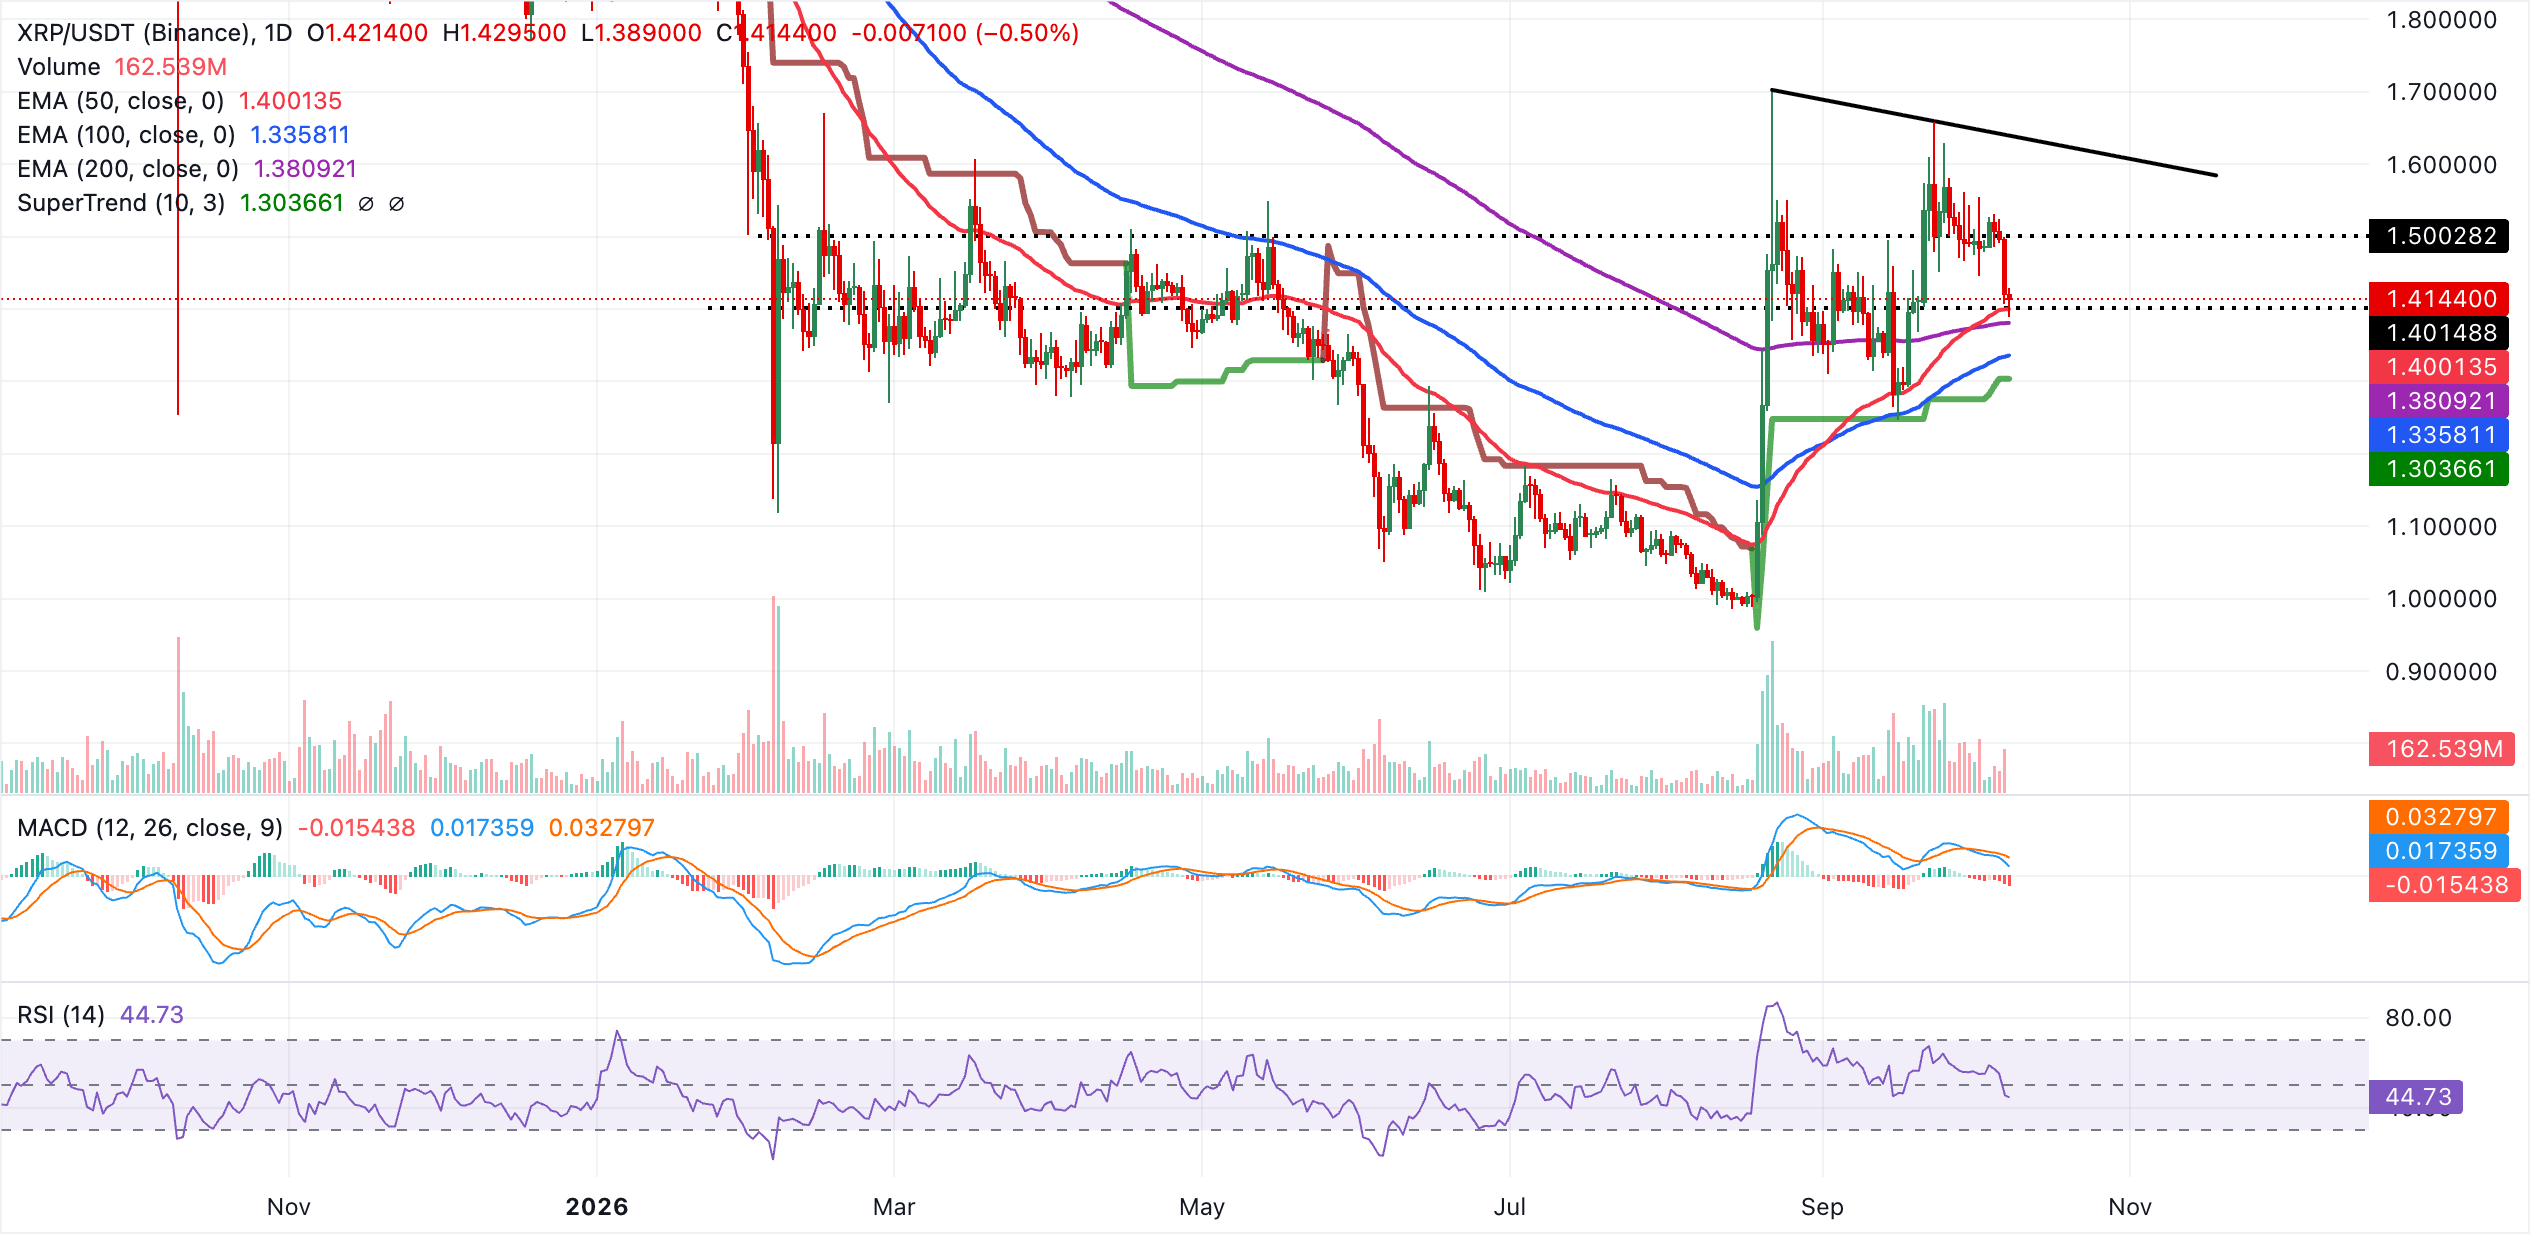
Initial support is seen at the 50-day EMA at $1.40, ahead of the 200-period EMA at $1.38, with deeper demand expected around the 100-period EMA at $1.34 and the SuperTrend baseline near $1.30. On the topside, the primary hurdle remains the downward resistance trend line originating from $1.70 and projecting above the current price, and a decisive daily close above that barrier would open the way for a continuation of the recovery, while failure to clear it could keep XRP contained in a corrective pullback toward the clustered moving-average supports.
(The technical analysis of this story was written with the help of an AI tool. Know more.)
Crypto ETF FAQs
An Exchange-Traded Fund (ETF) is an investment vehicle or an index that tracks the price of an underlying asset. ETFs can not only track a single asset, but a group of assets and sectors. For example, a Bitcoin ETF tracks Bitcoin’s price. ETF is a tool used by investors to gain exposure to a certain asset.
Yes. The first Bitcoin futures ETF in the US was approved by the US Securities & Exchange Commission in October 2021. A total of seven Bitcoin futures ETFs have been approved, with more than 20 still waiting for the regulator’s permission. The SEC says that the cryptocurrency industry is new and subject to manipulation, which is why it has been delaying crypto-related futures ETFs for the last few years.
Yes. The SEC approved in January 2024 the listing and trading of several Bitcoin spot Exchange-Traded Funds, opening the door to institutional capital and mainstream investors to trade the main crypto currency. The decision was hailed by the industry as a game changer.
The main advantage of crypto ETFs is the possibility of gaining exposure to a cryptocurrency without ownership, reducing the risk and cost of holding the asset. Other pros are a lower learning curve and higher security for investors since ETFs take charge of securing the underlying asset holdings. As for the main drawbacks, the main one is that as an investor you can’t have direct ownership of the asset, or, as they say in crypto, “not your keys, not your coins.” Other disadvantages are higher costs associated with holding crypto since ETFs charge fees for active management. Finally, even though investing in ETFs reduces the risk of holding an asset, price swings in the underlying cryptocurrency are likely to be reflected in the investment vehicle too.
Nothing in this material constitutes investment advice, personal recommendation, investment research, an offer, or a solicitation to buy or sell any financial instrument. The content has been prepared without consideration of your individual investment objectives, financial situation, or needs, and should not be treated as such.
Past performance is not a reliable indicator of future performance and/or results. Forward-looking scenarios or forecasts are not a guarantee of future performance. Actual results may differ materially from those anticipated.
Mitrade makes no representation or warranty as to the accuracy or completeness of the information provided and accepts no liability for any loss arising from reliance on such information.
Recommended Articles


