



Bitcoin Price Forecast: BTC rebounds despite cautious sentiment
- Bitcoin rebounds over 2%, trading above $83,500 on Tuesday, recovering the previous day’s losses.
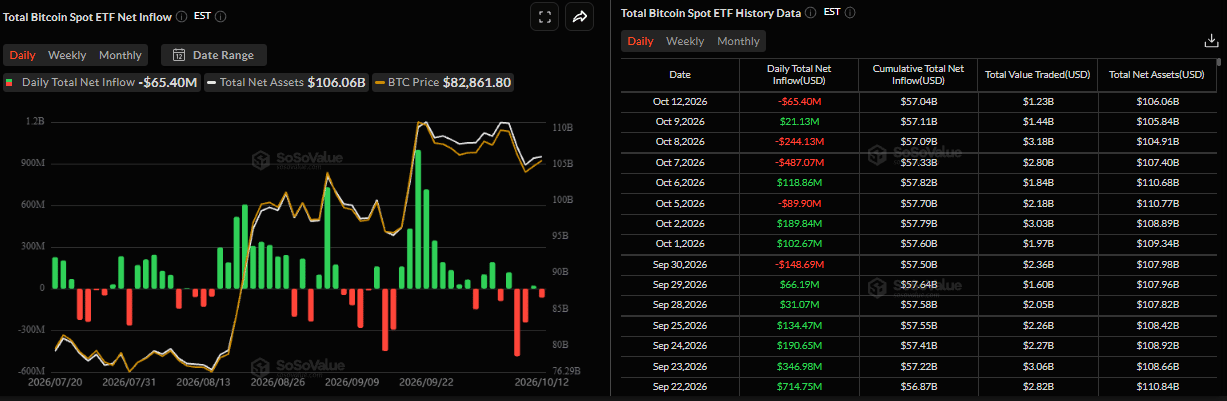
- US-listed BTC spot ETFs recorded an outflow of $65.40 million on Monday, while Strategy added 250 BTC to its reserve.
- Persistent geopolitical tensions and mixed signals continue to weigh on risk appetite, keeping investors cautious despite BTC’s recovery.
Bitcoin (BTC) rebounds over 2%, trading above $83,500 at the time of writing on Tuesday, recovering the losses from the previous day. Institutional demand shows signs of weakness, with spot Exchange Traded Funds (ETFs) recording $65.40 million outflows on Monday, while Strategy (MSTR) added 250 BTC to its reserve. Despite the mild recovery, traders should remain cautious as persistent geopolitical tensions and mixed signals continue to weigh on risk appetite.
Mild outflows in ETFs
Institutional demand started the week on a negative note. SoSoValue data show spot ETFs recorded a mild outflow of $65.40 million on Monday after $681.10 million in net outflows last week. If these withdrawals continue and intensify this week, BTC could dip.
On the corporate side, Michael Saylor announced on Monday that his firm, Strategy, acquired another 250 BTC after buying 1,665 BTC previously. The company currently holds 848,250 BTC, and its total reserves are $5.5 billion in USD assets. This move suggests Saylor’s company is returning to its familiar approach of aggressively accumulating BTC, supporting a bullish outlook for the King Crypto.
Persistent global tensions limit appetite for riskier assets
The Iran-backed Houthi group in Yemen escalated its campaign against Saudi Arabia and fired more missiles on Monday. This follows deadly strikes on Riyadh’s King Khalid International Airport over the weekend, which drew a Saudi vow of retaliation.
Moreover, US President Donald Trump raised the possibility of joining strikes on the Houthi group and resuming attacks on Iran.
These developments underscore persistent uncertainty, dampening risk appetite and, therefore, weighing on risk-sensitive assets such as BTC.
Bitfinex Analysts told FXStreet that Bitcoin has weathered last week’s sharp sell-off, but its recovery faces a bigger challenge: a lack of fresh buying.
The Bitfinex Alpha report highlighted that while leveraged-position liquidations have eased immediate selling pressure, institutional demand remains weak, with Bitcoin ETF investors now marginally underwater. The concern is that BTC’s recovery could stall just as investors who bought at higher prices get the chance to exit without a loss. US spot Bitcoin ETFs recorded $678.9 million in outflows last week, their largest weekly withdrawal since June, while a substantial concentration of BTC bought above current prices could create further selling pressure as the market rebounds.
“Attention now turns to Wednesday’s US inflation report, which could determine whether Bitcoin has room to recover. Bitfinex analysts expect Bitcoin to remain between $81,300 and $84,500 ahead of the release. Softer inflation, accompanied by renewed ETF buying, could help Bitcoin reclaim $84,500 and bring its $87,722 yearly open back into view. But persistent inflation and further ETF withdrawals could instead push Bitcoin lower, toward $77,400,” the analyst added.
Bitcoin technical outlook: BTC holds above key EMAs
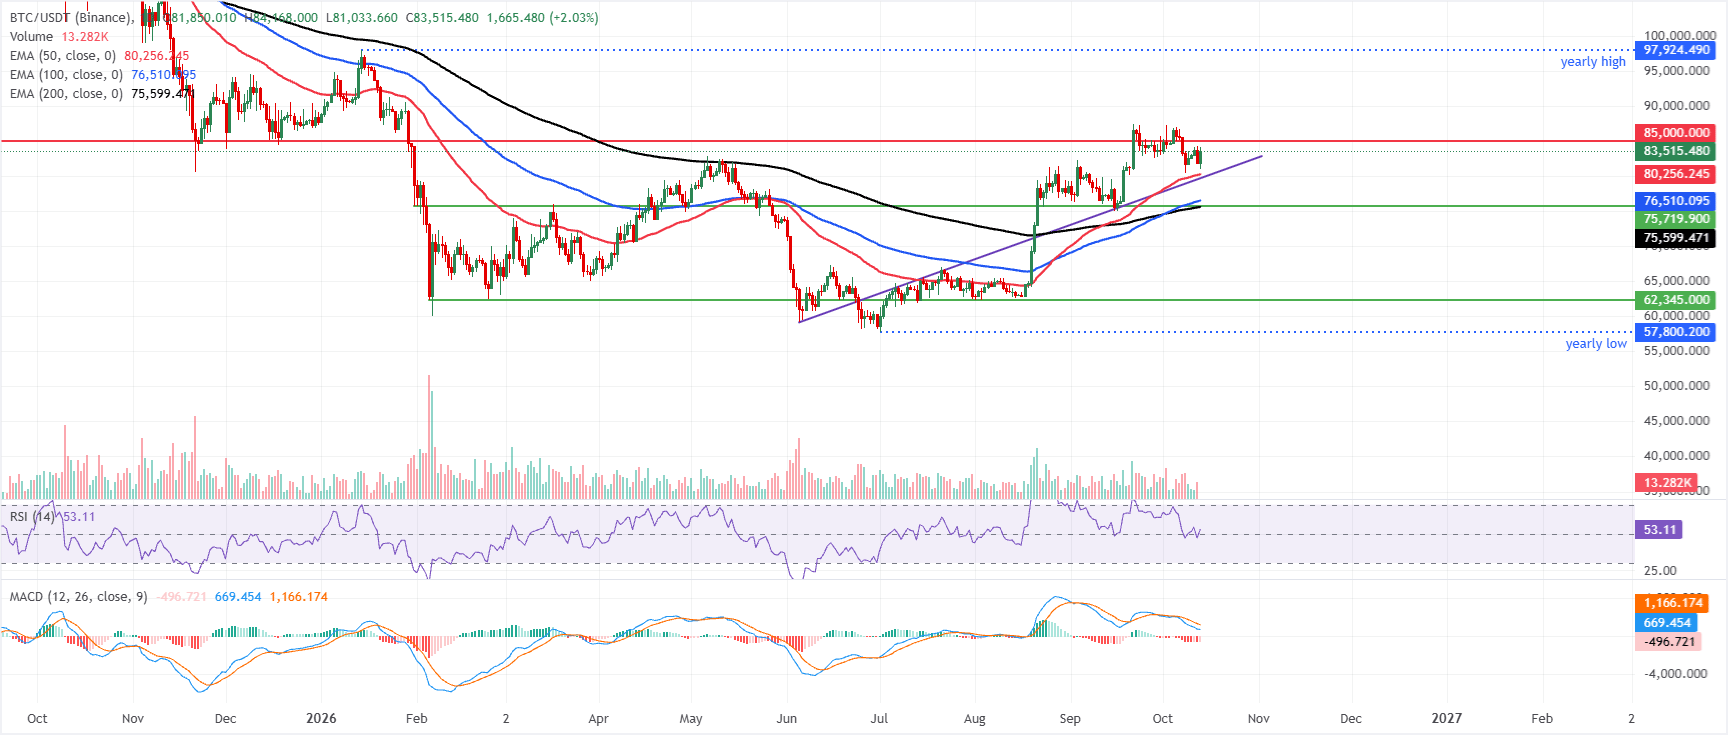
Bitcoin price trades at $83,515 on Tuesday, holding a bullish bias as it remains comfortably above the 50-day, 100-day and 200-day Exponential Moving Averages (EMAs) at $80,256, $76,510 and $75,599 respectively.
The clustering of these EMAs below spot suggests underlying trend support despite recent volatility, while the Relative Strength Index (RSI) around 53 hints at steady, non-extreme momentum. In contrast, the Moving Average Convergence Divergence (MACD) histogram stays below zero, indicating that bullish pressure is constructive but not yet impulsive.
On the topside, immediate resistance is seen at the horizontal barrier near $85,000, where sellers could attempt to cap further gains.
On the downside, initial support comes from the 50-day EMA area around $80,256, with deeper demand expected near the 100-day EMA at $76,510 and the 200-day EMA at $75,599 if a broader corrective phase unfolds.
(The technical analysis of this story was written with the help of an AI tool. Know more.)
Bitcoin, altcoins, stablecoins FAQs
Bitcoin is the largest cryptocurrency by market capitalization, a virtual currency designed to serve as money. This form of payment cannot be controlled by any one person, group, or entity, which eliminates the need for third-party participation during financial transactions.
Altcoins are any cryptocurrency apart from Bitcoin, but some also regard Ethereum as a non-altcoin because it is from these two cryptocurrencies that forking happens. If this is true, then Litecoin is the first altcoin, forked from the Bitcoin protocol and, therefore, an “improved” version of it.
Stablecoins are cryptocurrencies designed to have a stable price, with their value backed by a reserve of the asset it represents. To achieve this, the value of any one stablecoin is pegged to a commodity or financial instrument, such as the US Dollar (USD), with its supply regulated by an algorithm or demand. The main goal of stablecoins is to provide an on/off-ramp for investors willing to trade and invest in cryptocurrencies. Stablecoins also allow investors to store value since cryptocurrencies, in general, are subject to volatility.
Bitcoin dominance is the ratio of Bitcoin's market capitalization to the total market capitalization of all cryptocurrencies combined. It provides a clear picture of Bitcoin’s interest among investors. A high BTC dominance typically happens before and during a bull run, in which investors resort to investing in relatively stable and high market capitalization cryptocurrency like Bitcoin. A drop in BTC dominance usually means that investors are moving their capital and/or profits to altcoins in a quest for higher returns, which usually triggers an explosion of altcoin rallies.
Nothing in this material constitutes investment advice, personal recommendation, investment research, an offer, or a solicitation to buy or sell any financial instrument. The content has been prepared without consideration of your individual investment objectives, financial situation, or needs, and should not be treated as such.
Past performance is not a reliable indicator of future performance and/or results. Forward-looking scenarios or forecasts are not a guarantee of future performance. Actual results may differ materially from those anticipated.
Mitrade makes no representation or warranty as to the accuracy or completeness of the information provided and accepts no liability for any loss arising from reliance on such information.
Recommended Articles


