



Ethereum reclaims $2,400 as PPI hits 6.3% and yields fall
- Ethereum reclaims $2,400 after an earlier US PPI inflation shock briefly pushed its price near $2,320
- The recovery follows the US 10Y Treasury Yield falling to 5.095%, its lowest level since September 22.
- ETH bounced off the 100-day EMA and the $2,355 horizontal level convergence.
Ethereum (ETH) is back above $2,400 on Thursday, rebounding from a brief decline toward $2,340, which was sparked by an upside surprise in the US wholesale inflation report.
The Producer Price Index (PPI) increased 1.3% monthly and 6.3% annually in September, far above expectations of 0.5% and 5.3%, respectively. Core PPI, which omits volatile energy and food prices, rose 0.7% MoM and 5% YoY, also above market forecasts of 0.3% and 4.4%, respectively.
The hot PPI print came in a day after the Consumer Price Index (CPI) also accelerated past market estimates, triggering selloffs across risk assets.
The PPI inflation reading follows nearly $1 billion in crypto liquidations over the past 24 hours. Ethereum accounts for most of that figure, as a brief decline to $2,340 triggered roughly $286 million in liquidations, with longs making up 84%.
ETH recovers on falling Treasury yields
However, the top altcoin has joined the wider crypto market in staging a comeback, reclaiming $2,400.
The recovery follows a pullback in US 10-year Treasury yields, which fell to 5.095% on Thursday, their lowest level since September 22. Yields had surged earlier in the week, but worries about heavy AI-related spending led some investors to rotate out of AI-linked stocks and into Treasuries. That buying pushed Treasury prices up and yields down, easing pressure on risk assets like Ethereum.
The US Dollar Index (DXY), which measures the Greenback against six major fiat currencies, also erased its earlier post-CPI gains, dropping to 102.04 at the time of writing.
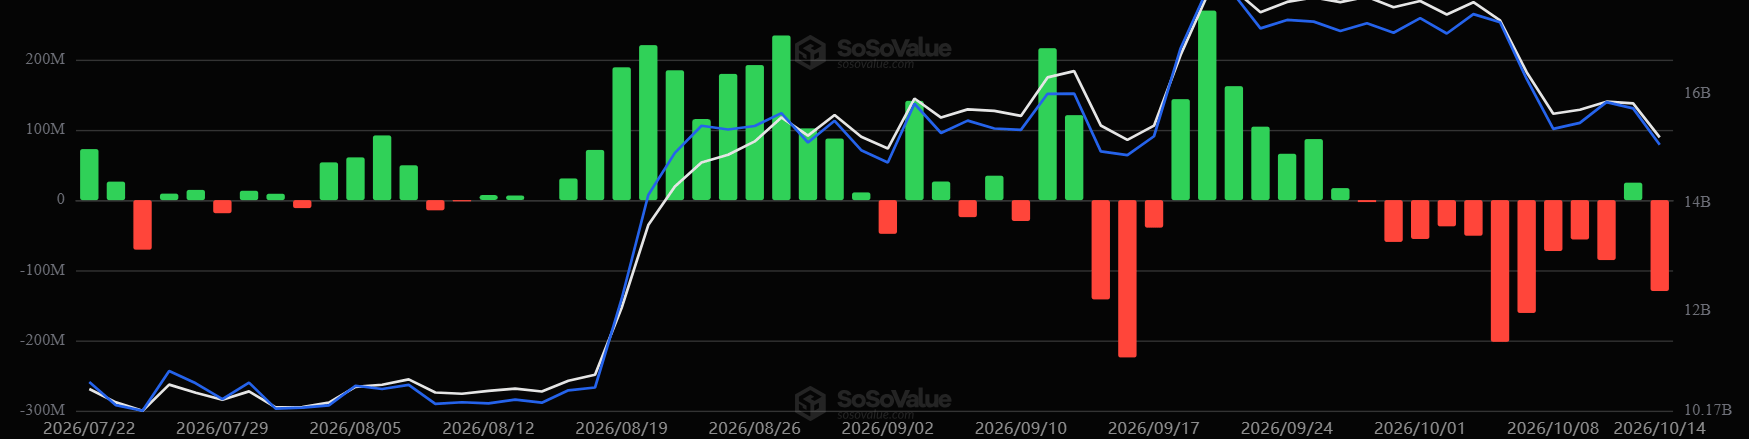
Meanwhile, on the institutional front, US spot ETH exchange-traded funds returned to net selling on Wednesday, recording nearly $130 million in net outflows, outweighing Tuesday's modest $24.8 million inflow, per SoSoValue data. The products have posted outflows in 11 out of the last 12 trading days.
Ethereum technical outlook: ETH bounces off 100-day EMA
On the daily chart, ETH bounced off the 100-day Exponential Moving Average (EMA) at $2,356 and the $2,355 horizontal level confluence. The top altcoin is looking to hold the recovery above the $2,411 level.
The slight rise in the Relative Strength Index (RSI) to 40.9 and a Stochastic reading near 25 suggest modest cooling of immediate bearish conditions.
On the topside, initial resistance is located at the 50-day EMA at $2,496, followed by the nearby horizontal barrier at $2,548 and the 20-day EMA at $2,552, forming a tight cluster that ETH must reclaim to stabilize the short-term outlook.
On the downside, immediate support is seen at the 100-day EMA and the adjacent horizontal level at $2,355. A daily close below this area would expose the next floors at $2,204, then $1,971 and $1,827.
(The technical analysis of this story was written with the help of an AI tool. Know more.)
Nothing in this material constitutes investment advice, personal recommendation, investment research, an offer, or a solicitation to buy or sell any financial instrument. The content has been prepared without consideration of your individual investment objectives, financial situation, or needs, and should not be treated as such.
Past performance is not a reliable indicator of future performance and/or results. Forward-looking scenarios or forecasts are not a guarantee of future performance. Actual results may differ materially from those anticipated.
Mitrade makes no representation or warranty as to the accuracy or completeness of the information provided and accepts no liability for any loss arising from reliance on such information.
Recommended Articles


