

Dow Jones Industrial Average drops 600 points as hot PPI data rattles markets
- Major US indexes sold off on Friday, with the Dow falling over 1% and the S&P 500 and Nasdaq both declining.
- PPI inflation came in well above expectations, with core PPI surging 0.8% month-over-month versus the 0.3% consensus.
- Block surged over 23% after announcing it would cut nearly half its workforce in an AI-driven restructuring.
- Dell jumped 17% on a blowout earnings report and guidance that its AI server revenue will double in fiscal 2027.
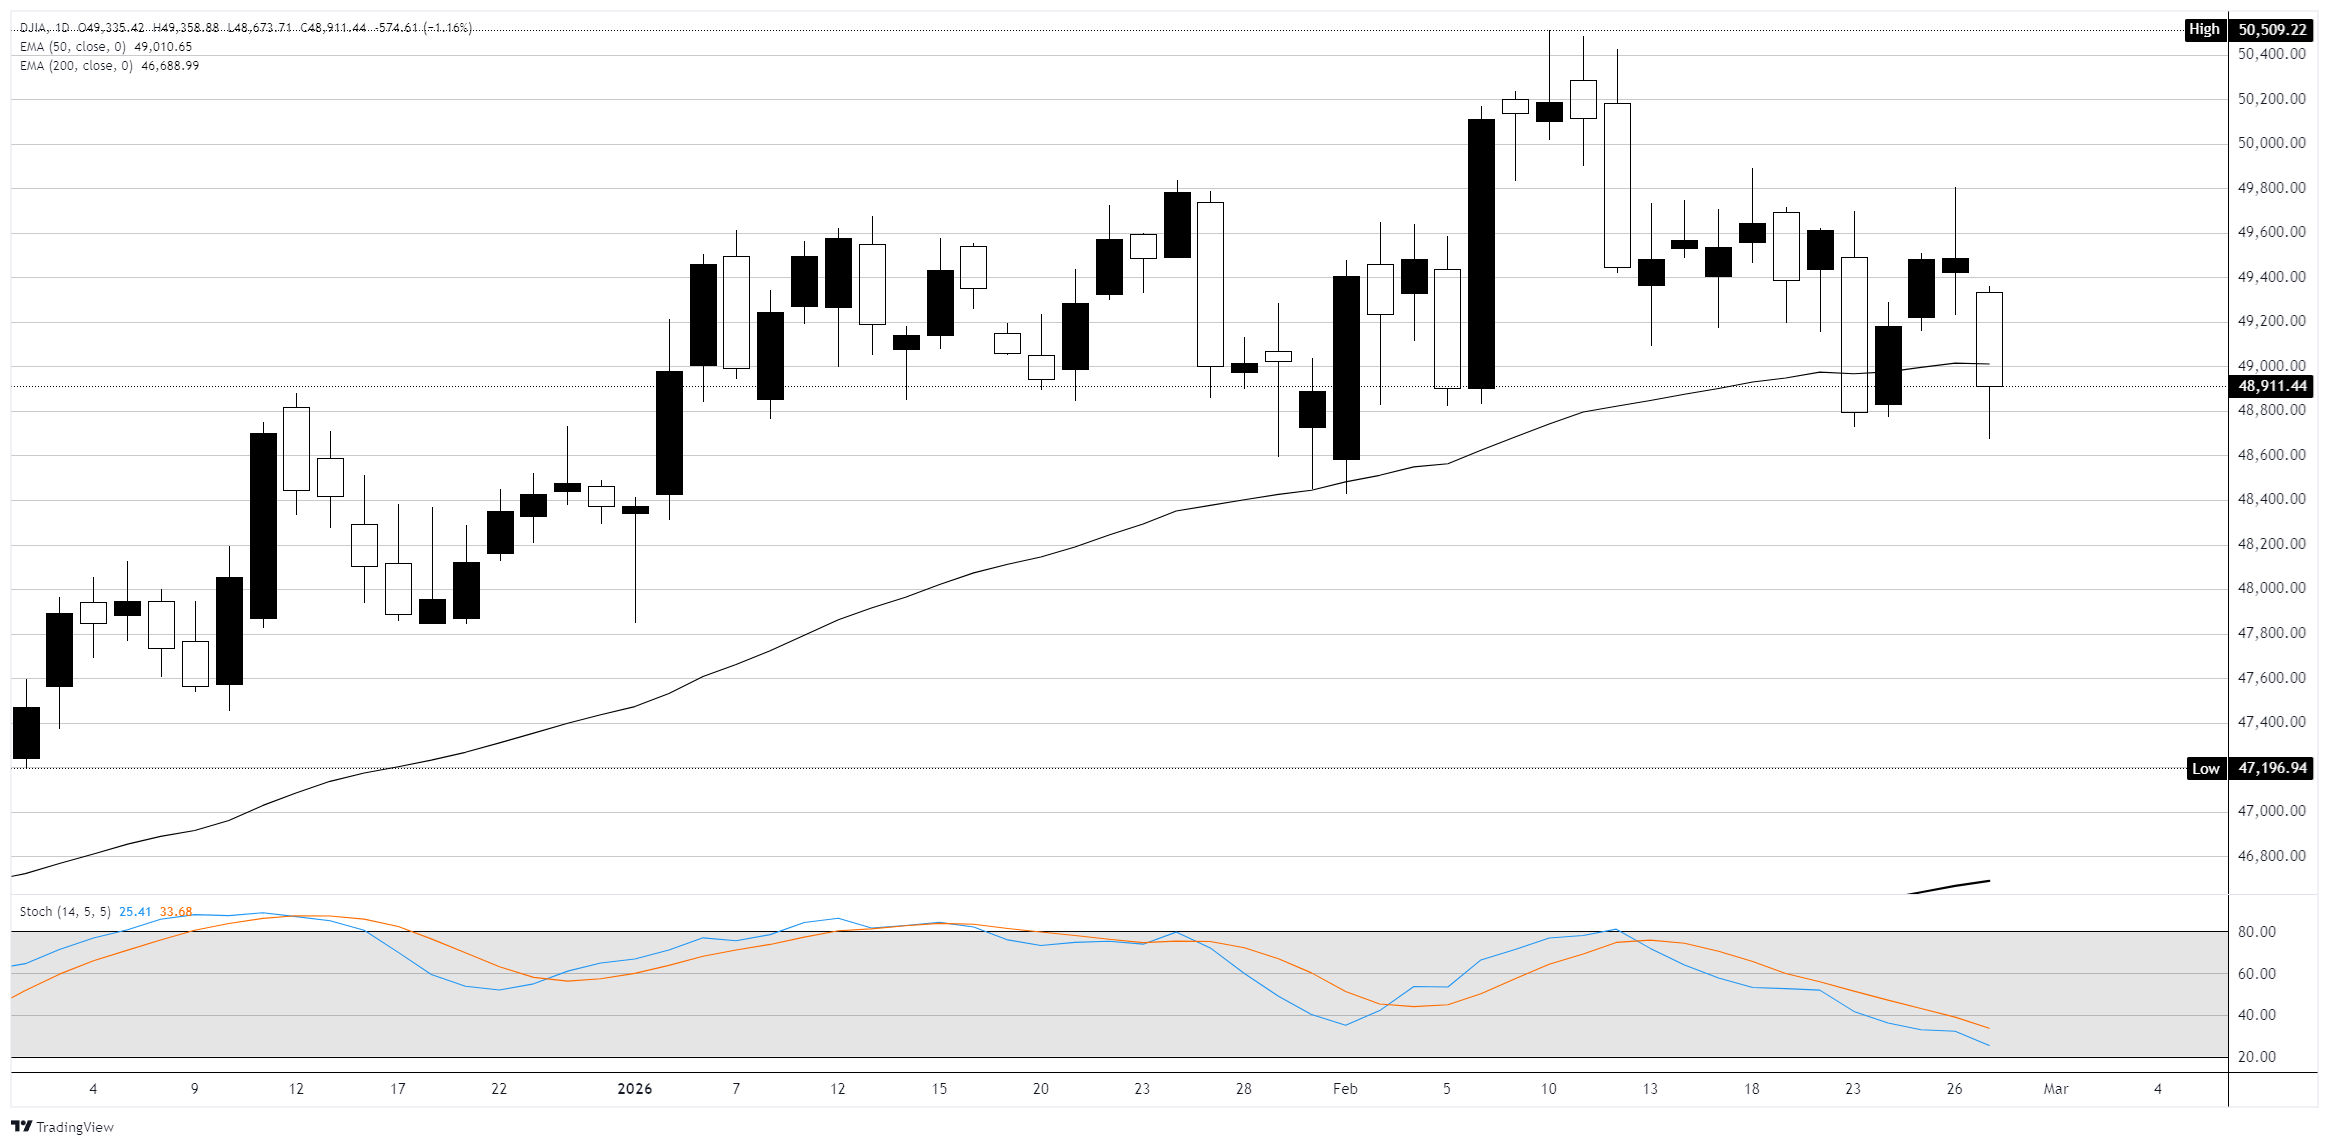
The Dow Jones Industrial Average fell 600 points, or 1.15%, tumbling back below 49,000 on Friday, capping off a turbulent final trading week in February. The S&P 500 dropped around 0.7% while the Nasdaq Composite lost roughly 0.9%. All three benchmarks finished February in the red, weighed down by a combination of sticky inflation data, persistent AI disruption fears, and profit-taking in the technology sector following Nvidia's earnings earlier in the week.
Hot wholesale inflation complicates the rate outlook
The Bureau of Labor Statistics (BLS) reported that the Producer Price Index (PPI) rose 0.5% month-over-month in January, above the 0.3% Dow Jones consensus estimate and up from a revised 0.4% gain in December. More concerning was the core reading, which excludes food and energy: core PPI surged 0.8%, nearly triple the 0.3% forecast and the largest monthly jump since July. On a year-over-year basis, headline PPI held at 2.9% while core accelerated to 3.6%, both well above the Federal Reserve's (Fed) 2% target. A 2.5% spike in trade services margins drove much of the increase, with evidence of tariff-related pass-through in apparel and chemicals categories. The data matters because several PPI components feed directly into the Personal Consumption Expenditures Price Index (PCE), the Fed's preferred inflation gauge, with economists now estimating core PCE could have risen as much as 0.5% in January. According to the CME FedWatch Tool, markets are pricing in roughly two 25-basis-point rate cuts for 2026, with the next Federal Open Market Committee (FOMC) meeting on March 17-18 widely expected to result in a hold at 3.50%-3.75%.
Block soars on massive AI-driven workforce reduction
Block Inc. (XYZ) surged over 23% after CEO Jack Dorsey announced the fintech company would cut more than 4K employees, slashing its headcount from over 10K to just under 6K. Dorsey framed the move as a bet on artificial intelligence transforming labor productivity, saying he expected the majority of companies to reach the same conclusion within the next year. The cuts came alongside fourth-quarter results that met expectations, with adjusted earnings per share of $0.65 on revenue of $6.25 billion. Gross profit jumped 24% year-over-year to $2.87 billion, driven by a 33% surge in Cash App gross profit. Block raised its full-year 2026 adjusted EPS outlook to $3.66, well above the $3.22 consensus. The stock traded between $51.80 and $69.52 on the session as investors digested the news.
Dell jumps on AI server demand, Nvidia extends losses
Dell Technologies (DELL) rallied 17.5% to around $142 after reporting fourth-quarter revenue of $33.4 billion, handily beating the $31.41 billion consensus, with a 39% year-over-year jump in sales. The standout was AI server demand — Dell closed $64 billion in AI-optimized server orders in Q4 and guided for AI server revenue to roughly double to $50 billion in fiscal 2027. The company also announced a 20% dividend hike and a $10 billion share buyback program. On the other side, Nvidia (NVDA) fell another 2.5% after Thursday's 5.5% plunge, as concerns about the sustainability of AI infrastructure spending continued to overshadow its earnings beat earlier in the week. CoreWeave (CRWV) dropped around 12% after reporting a wider-than-expected loss and EBITDA that missed the $929 million consensus, despite a massive $66.8 billion revenue backlog.
Netflix walks, Paramount wins in Warner Bros. bidding war
Netflix (NFLX) rose about 9% after the streaming giant declined to match Paramount Skydance's (PSKY) revised $31-per-share all-cash bid for Warner Bros. Discovery (WBD). Netflix had previously agreed to an $83 billion deal for a substantial portion of Warner Bros.' assets, but Paramount's updated $108.4 billion offer was deemed a superior proposal by the WBD board. Netflix said the deal was no longer financially attractive at the required price. Analysts viewed the withdrawal as a positive, removing a major overhang and allowing investors to refocus on Netflix's core growth story. Paramount Skydance rose around 4% while Warner Bros. Discovery slipped roughly 2%.
Software sector closes out a brutal February
The broader software sector finished February as one of the worst-performing areas of the market, with the iShares Expanded Tech-Software Sector ETF (IGV) down more than 10% for the month. Oracle (ORCL) lost 17%, Microsoft (MSFT) dropped about 15%, and Salesforce (CRM) tumbled 13% over the same period, as fears about AI disruption to traditional software business models continued to weigh on sentiment. Nvidia CEO Jensen Huang pushed back on the narrative during the week, telling CNBC that markets had overestimated the threat AI poses to software companies, singling out ServiceNow (NOW) as an example. The Dow ended February up roughly 1%, while the Nasdaq Composite fell about 2.5% for the month. Gold held steady near $5,192 per ounce, on track for its seventh consecutive monthly gain, supported by falling real yields and geopolitical uncertainty.
Dow Jones daily chart
Dow Jones FAQs
The Dow Jones Industrial Average, one of the oldest stock market indices in the world, is compiled of the 30 most traded stocks in the US. The index is price-weighted rather than weighted by capitalization. It is calculated by summing the prices of the constituent stocks and dividing them by a factor, currently 0.152. The index was founded by Charles Dow, who also founded the Wall Street Journal. In later years it has been criticized for not being broadly representative enough because it only tracks 30 conglomerates, unlike broader indices such as the S&P 500.
Many different factors drive the Dow Jones Industrial Average (DJIA). The aggregate performance of the component companies revealed in quarterly company earnings reports is the main one. US and global macroeconomic data also contributes as it impacts on investor sentiment. The level of interest rates, set by the Federal Reserve (Fed), also influences the DJIA as it affects the cost of credit, on which many corporations are heavily reliant. Therefore, inflation can be a major driver as well as other metrics which impact the Fed decisions.
Dow Theory is a method for identifying the primary trend of the stock market developed by Charles Dow. A key step is to compare the direction of the Dow Jones Industrial Average (DJIA) and the Dow Jones Transportation Average (DJTA) and only follow trends where both are moving in the same direction. Volume is a confirmatory criteria. The theory uses elements of peak and trough analysis. Dow’s theory posits three trend phases: accumulation, when smart money starts buying or selling; public participation, when the wider public joins in; and distribution, when the smart money exits.
There are a number of ways to trade the DJIA. One is to use ETFs which allow investors to trade the DJIA as a single security, rather than having to buy shares in all 30 constituent companies. A leading example is the SPDR Dow Jones Industrial Average ETF (DIA). DJIA futures contracts enable traders to speculate on the future value of the index and Options provide the right, but not the obligation, to buy or sell the index at a predetermined price in the future. Mutual funds enable investors to buy a share of a diversified portfolio of DJIA stocks thus providing exposure to the overall index.
Nothing in this material constitutes investment advice, personal recommendation, investment research, an offer, or a solicitation to buy or sell any financial instrument. The content has been prepared without consideration of your individual investment objectives, financial situation, or needs, and should not be treated as such.
Past performance is not a reliable indicator of future performance and/or results. Forward-looking scenarios or forecasts are not a guarantee of future performance. Actual results may differ materially from those anticipated.
Mitrade makes no representation or warranty as to the accuracy or completeness of the information provided and accepts no liability for any loss arising from reliance on such information.
Recommended Articles


