



Dow Jones Industrial Average slips as Iran severs talks and Oil surges
- The Dow eased back from last week's record highs after Iran suspended talks with the US and threatened to close both the Strait of Hormuz and the Bab-el-Mandeb Strait.
- Oil jumped close to 5% on the escalation, yet a firm bid across AI and chip names kept the broader tape from buckling.
- A heavy data week looms, headlined by Friday's monthly jobs report, with a hot manufacturing survey already on the board.
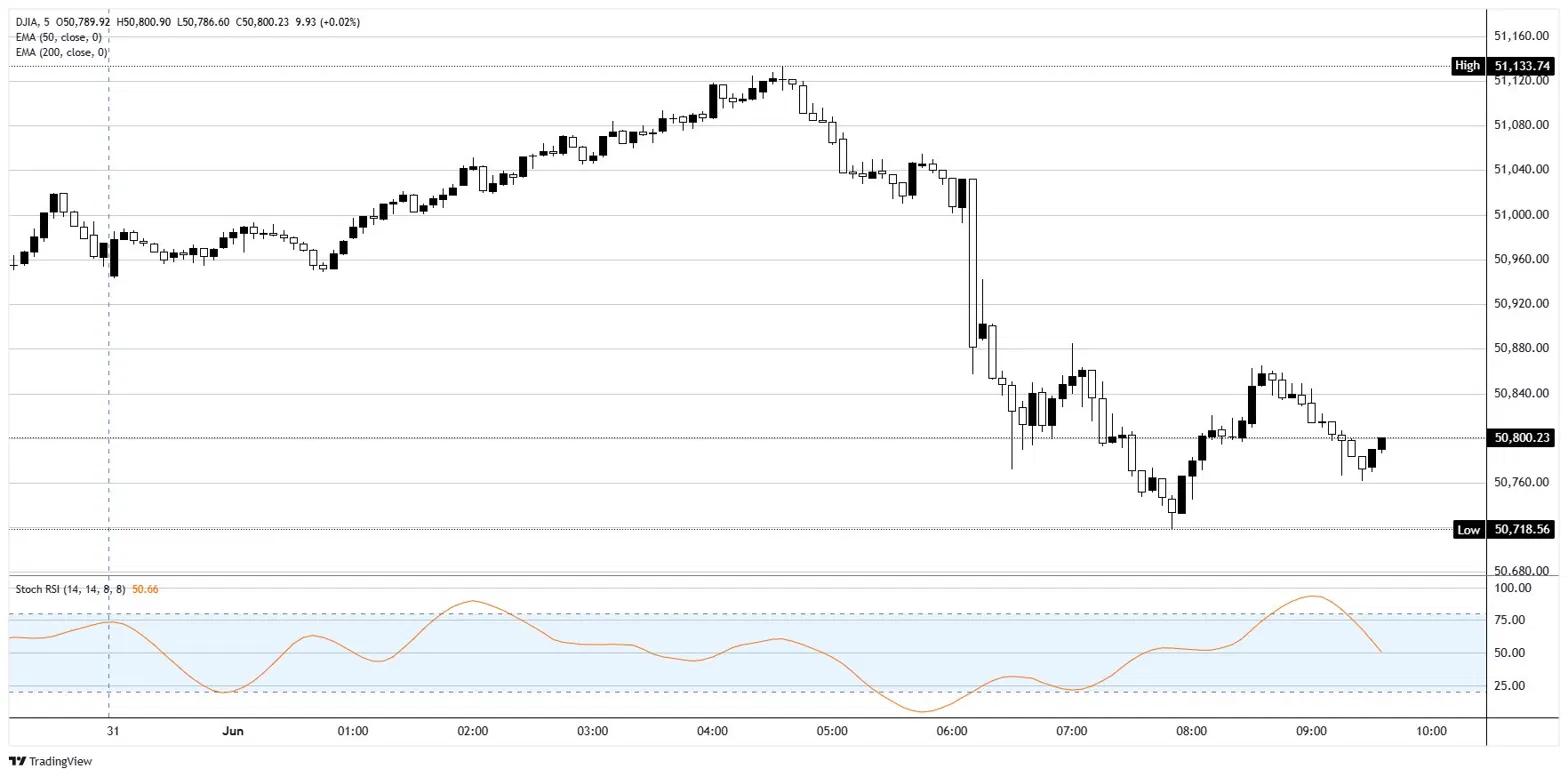
The Dow Jones Industrial Average traded around 0.4% lower Monday, shedding roughly 200 points to sit near 50,800 after pulling back from the record-area highs above 51,100 set last week. The S&P 500 was only marginally lower and the Nasdaq Composite hovered close to flat, a split that tells the day's real story: a serious geopolitical escalation met a market that mostly refused to flinch. Iran tearing up the diplomatic track and pointing at the world's two most important Oil chokepoints sent crude sharply higher, but with AI and semiconductor names doing the heavy lifting, equities are once again treating Middle East risk as background noise.
Iran tears up the script
Iran's state-linked Tasnim outlet said Monday that Tehran has stopped passing messages to the US through intermediaries and intends to fully close the Strait of Hormuz while activating the Bab-el-Mandeb Strait, demanding Israel halt operations in Lebanon and Gaza first. The threat lands after Iran reportedly fired ballistic missiles at US forces in Kuwait overnight, a reminder that the fragile ceasefire is fraying rather than firming. Roughly a fifth of global Oil moved through Hormuz before the war, and both routes are central to energy and trade flows, so the market response was immediate as crude surged close to 5%. For an index sitting at record highs, the muted equity reaction looks less like calm and more like complacency, exactly the kind of setup JPMorgan's Jamie Dimon flagged last week when he warned that risk is being underpriced.
Tech does the heavy lifting
Nvidia (NVDA) climbed around 4% to 5% after unveiling a new AI laptop chip at the Computex conference in Taipei, reigniting the same AI trade that has carried Wall Street to records through the entire Iran conflict. Microsoft (MSFT) added more than 2%, while IBM (IBM) and Micron (MU) each rose more than 5%. That strength is why the Nasdaq barely moved and the S&P 500 held up despite energy-driven selling elsewhere, and it is the main reason the Dow's loss stayed shallow. The pattern is familiar by now: every time geopolitics threatens to break the rally, the AI bid shows up to absorb the blow.
Berkshire goes shopping
The day's standout corporate story came from Berkshire Hathaway (BRK.B), which agreed to buy homebuilder Taylor Morrison (TMHC) in an all-cash deal worth about $6.8 billion, a premium of roughly 24% to Friday's close. Taylor Morrison jumped more than 20% on the news. It is the largest acquisition since Greg Abel took over as chief executive, and a clear signal that Berkshire sees value in US housing even with borrowing costs elevated and the Federal Reserve (Fed) leaning the wrong way for rate-sensitive sectors.
The Dollar and bonds say what stocks won't
The cleaner read on risk came from outside equities. The US Dollar firmed around 0.3% as money moved toward safety, and Treasury yields pushed higher as the Oil spike revived inflation worries. That combination matters because markets are now pricing the Fed to raise rates rather than cut them, a sharp reversal from the cuts traders expected at the start of the year, with new Chair Kevin Warsh inheriting an inflation problem the Iran war keeps feeding. Higher yields and a stronger Dollar dragged on metals, with Gold and Silver both lower, while Bitcoin slid toward $70K on a tenth straight day of exchange-traded fund outflows. Risk-off in everything except the stock index people watch most.
A loaded data week
Even before Friday, the calendar is stacked. The Institute for Supply Management (ISM) Manufacturing Purchasing Managers Index (PMI) for May printed at 54 at 14:00 GMT, beating the 53 consensus and accelerating from April, a sign factory activity is firming rather than fading. Prices paid cooled to 82.1, below both the prior month and forecasts, but stayed elevated enough to keep the inflation narrative alive. From here the docket only gets heavier: Job Openings and Labor Turnover Survey (JOLTS) data Tuesday, ADP payrolls and ISM Services Wednesday, jobless claims Thursday, and the main event, Nonfarm Payrolls (NFP), on Friday at 12:30 GMT. Consensus looks for just 85K jobs, a sharp step down from the prior 115K, alongside average hourly earnings that will be read closely for wage pressure. With geopolitics boiling and the Fed leaning hawkish, a market this close to record highs is walking into the data with very little margin for error.
Dow Jones 5-minute chart
Dow Jones FAQs
The Dow Jones Industrial Average, one of the oldest stock market indices in the world, is compiled of the 30 most traded stocks in the US. The index is price-weighted rather than weighted by capitalization. It is calculated by summing the prices of the constituent stocks and dividing them by a factor, currently 0.152. The index was founded by Charles Dow, who also founded the Wall Street Journal. In later years it has been criticized for not being broadly representative enough because it only tracks 30 conglomerates, unlike broader indices such as the S&P 500.
Many different factors drive the Dow Jones Industrial Average (DJIA). The aggregate performance of the component companies revealed in quarterly company earnings reports is the main one. US and global macroeconomic data also contributes as it impacts on investor sentiment. The level of interest rates, set by the Federal Reserve (Fed), also influences the DJIA as it affects the cost of credit, on which many corporations are heavily reliant. Therefore, inflation can be a major driver as well as other metrics which impact the Fed decisions.
Dow Theory is a method for identifying the primary trend of the stock market developed by Charles Dow. A key step is to compare the direction of the Dow Jones Industrial Average (DJIA) and the Dow Jones Transportation Average (DJTA) and only follow trends where both are moving in the same direction. Volume is a confirmatory criteria. The theory uses elements of peak and trough analysis. Dow’s theory posits three trend phases: accumulation, when smart money starts buying or selling; public participation, when the wider public joins in; and distribution, when the smart money exits.
There are a number of ways to trade the DJIA. One is to use ETFs which allow investors to trade the DJIA as a single security, rather than having to buy shares in all 30 constituent companies. A leading example is the SPDR Dow Jones Industrial Average ETF (DIA). DJIA futures contracts enable traders to speculate on the future value of the index and Options provide the right, but not the obligation, to buy or sell the index at a predetermined price in the future. Mutual funds enable investors to buy a share of a diversified portfolio of DJIA stocks thus providing exposure to the overall index.
Nothing in this material constitutes investment advice, personal recommendation, investment research, an offer, or a solicitation to buy or sell any financial instrument. The content has been prepared without consideration of your individual investment objectives, financial situation, or needs, and should not be treated as such.
Past performance is not a reliable indicator of future performance and/or results. Forward-looking scenarios or forecasts are not a guarantee of future performance. Actual results may differ materially from those anticipated.
Mitrade makes no representation or warranty as to the accuracy or completeness of the information provided and accepts no liability for any loss arising from reliance on such information.
Recommended Articles


