


Gold nears $4,500 as geopolitical fears trump rising yields, US Dollar
- Gold and Silver hit fresh records as developments in Venezuela and Trump’s rhetoric heighten geopolitical uncertainty.
- Steady US PMIs reinforce expectations for lower rates, supporting Bullion despite rising Treasury yields.
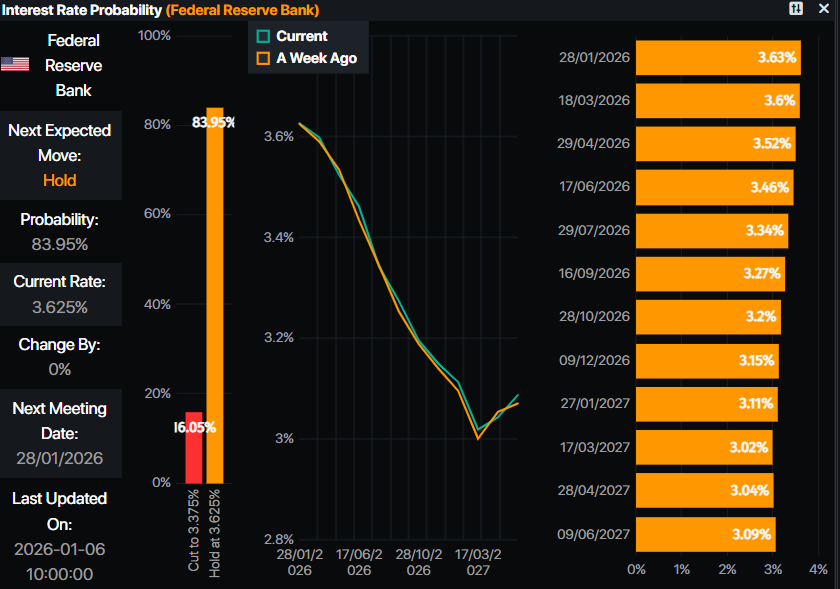
- Markets price nearly 56 bps of Fed cuts by end-2026 ahead of key US labor data.
Gold price (XAU/USD) rallies on Tuesday for the fourth straight day, shy of reclaiming the $4,500 figure even though US Treasury yields rise along with the Greenback, which is also gaining 0.20%. At the time of writing, XAU/USD trades at $4,487, up nearly 1%.
Bullion extends gains as Venezuela tensions fuel haven demand despite firmer yields and US Dollar strength
Precious metals traders continued to push Gold and Silver toward record high levels amid geopolitical uncertainty. The capture of the Venezuelan President Nicolas Maduro and US President Donald Trump's verbal threats of extending those kinds of operations to other Latin American countries keep investors anxious, which has turned to Bullion’s haven appeal.
Recently revealed economic data in the United States prompted investors to buy the yellow metal following the release of nearly unchanged Purchasing Managers Indices (PMI) computed by S&P Global.
US business activity remains solid, yet it justifies the need for lower interest rates, according to Fed Governor Stephen Miran, who recently crossed the wires. Contrary to his opinion, Richmond Fed President Thomas Barkin stated that the Fed funds rate is within neutral levels, which neither stimulates nor restrains economic activity.
Despite this, traders have priced in nearly 56 basis points of rate cuts by the Federal Reserve towards the end of 2026, according to Prime Market Terminal Data.
The US economic docket will feature US ADP Employment Change figures for December, along with ISM Services PMI for the same period, and JOLTS Job Openings for November.
Daily digest market movers: Gold ignores US Dollar strength
- December’s S&P Global Services PMI showed that business activity is losing momentum in the US. The index eased from 54.1 to 52.5 while the Composite PMI dipped to 52.7 from 54.2.
- Richmond Fed President Thomas Barkin said future rate decisions will need to be “finely tuned,” given the competing risks to the labor market and inflation objectives. He added that the current policy rate sits within the neutral range and emphasized the need to monitor both sides of the Fed’s dual mandate.
- Earlier, Fed Governor Stephen Miran struck a dovish tone, saying the central bank is likely to adjust rates lower as incoming data point toward the need for easing. Miran added that he expects conditions to warrant up to 100 basis points of rate cuts in 2026.
- The US Dollar Index (DXY), which tracks the buck’s value against six other currencies, posted gains of 0.25% at 98.61, but failed to cap Gold gains.
- Also, rising US Treasury yields have not prevented Bullion from surging higher. The US 10-year T-note yield rises two basis points to 4.179%. US real yields, which correlate inversely with Gold prices, are also up nearly one and a half basis points at 1.919%.
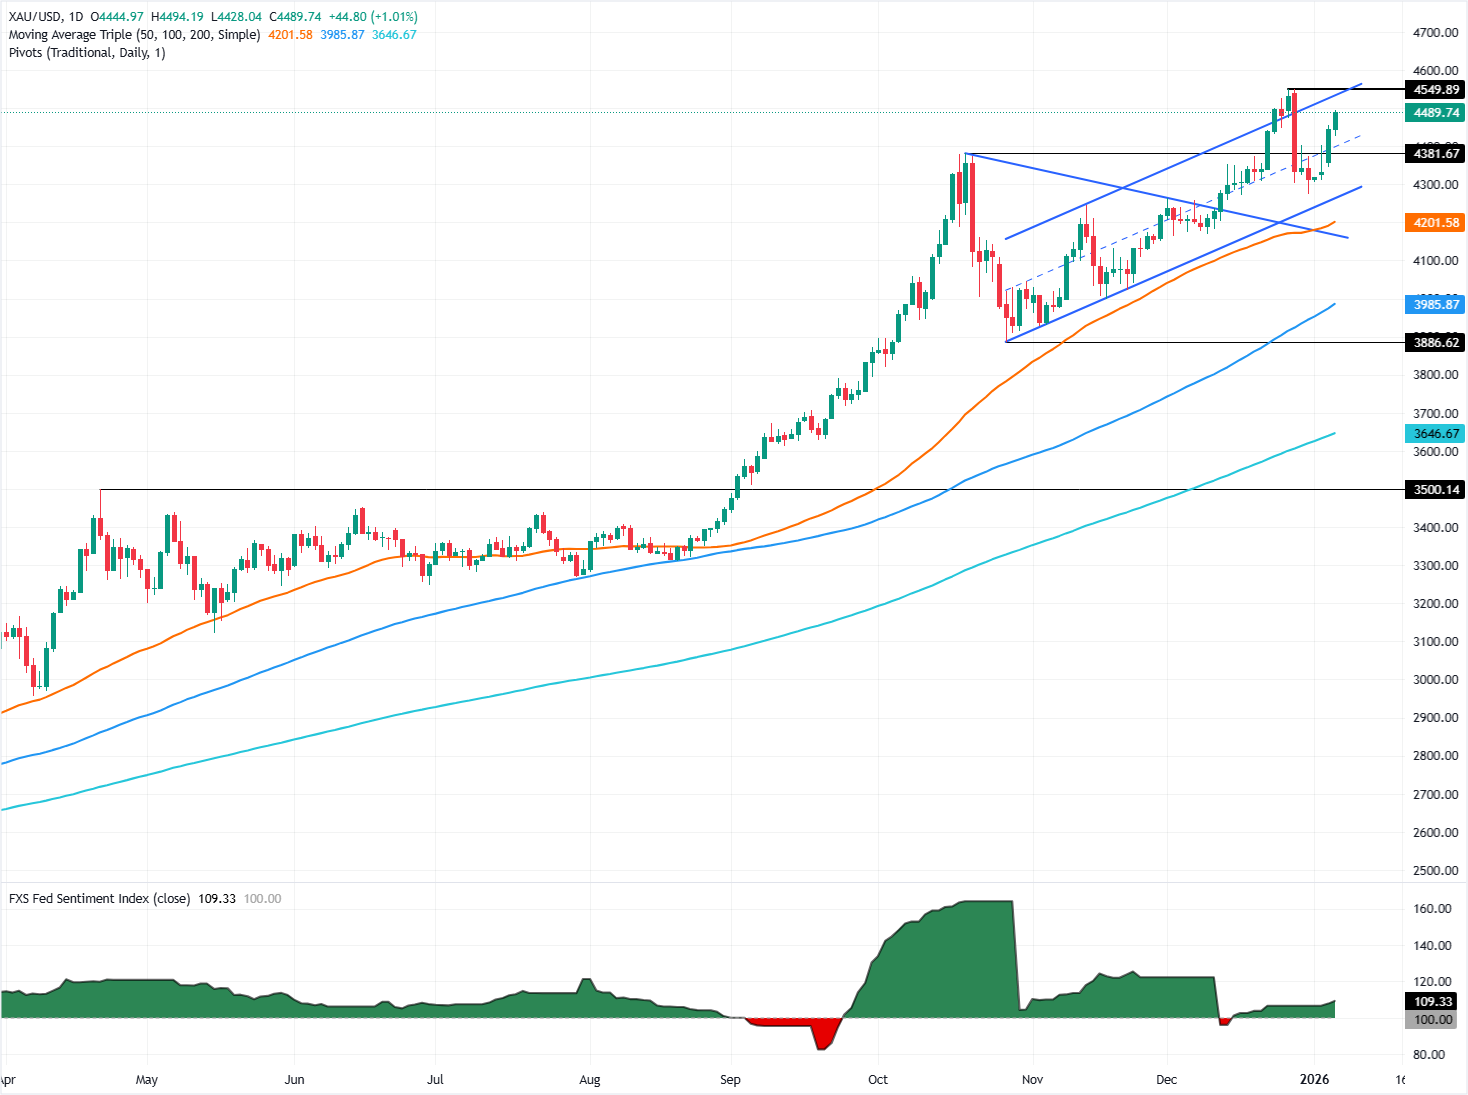
Technical analysis: Gold price on its way towards $4,500
The technical picture shows Gold’s uptrend intact, approaching the $4,500 figure, with strong bullish momentum supporting the move. The Relative Strength Index (RSI) is approaching overbought territory, an indication that further upside is seen.
The first key resistance level is the previously mentioned $4,500 mark. Once cleared, the next stop would be the record high of $4,549, reached last December.
On the other hand, if XAU/USD trips below $4,450, this clears the path towards $4,400. A breach of the latter will expose the 20-day SMA at $4,381 ahead of $4,350.
Gold FAQs
Gold has played a key role in human’s history as it has been widely used as a store of value and medium of exchange. Currently, apart from its shine and usage for jewelry, the precious metal is widely seen as a safe-haven asset, meaning that it is considered a good investment during turbulent times. Gold is also widely seen as a hedge against inflation and against depreciating currencies as it doesn’t rely on any specific issuer or government.
Central banks are the biggest Gold holders. In their aim to support their currencies in turbulent times, central banks tend to diversify their reserves and buy Gold to improve the perceived strength of the economy and the currency. High Gold reserves can be a source of trust for a country’s solvency. Central banks added 1,136 tonnes of Gold worth around $70 billion to their reserves in 2022, according to data from the World Gold Council. This is the highest yearly purchase since records began. Central banks from emerging economies such as China, India and Turkey are quickly increasing their Gold reserves.
Gold has an inverse correlation with the US Dollar and US Treasuries, which are both major reserve and safe-haven assets. When the Dollar depreciates, Gold tends to rise, enabling investors and central banks to diversify their assets in turbulent times. Gold is also inversely correlated with risk assets. A rally in the stock market tends to weaken Gold price, while sell-offs in riskier markets tend to favor the precious metal.
The price can move due to a wide range of factors. Geopolitical instability or fears of a deep recession can quickly make Gold price escalate due to its safe-haven status. As a yield-less asset, Gold tends to rise with lower interest rates, while higher cost of money usually weighs down on the yellow metal. Still, most moves depend on how the US Dollar (USD) behaves as the asset is priced in dollars (XAU/USD). A strong Dollar tends to keep the price of Gold controlled, whereas a weaker Dollar is likely to push Gold prices up.
Nothing in this material constitutes investment advice, personal recommendation, investment research, an offer, or a solicitation to buy or sell any financial instrument. The content has been prepared without consideration of your individual investment objectives, financial situation, or needs, and should not be treated as such.
Past performance is not a reliable indicator of future performance and/or results. Forward-looking scenarios or forecasts are not a guarantee of future performance. Actual results may differ materially from those anticipated.
Mitrade makes no representation or warranty as to the accuracy or completeness of the information provided and accepts no liability for any loss arising from reliance on such information.
Recommended Articles


