



Bitcoin Price Forecast: BTC rebounds slightly as consolidation range keeps direction unclear
- Bitcoin recovers slightly, trading above $63,800 on Thursday after posting four consecutive days of losses.
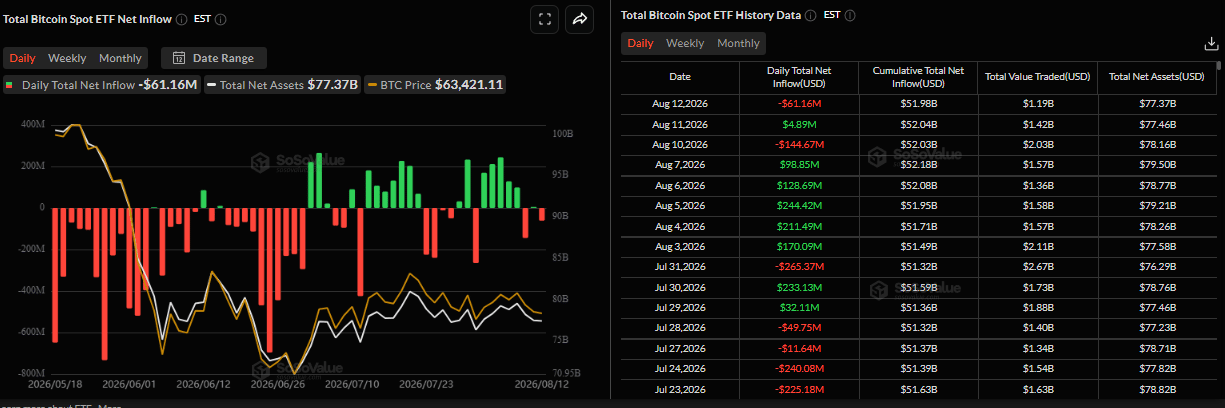
- US-listed spot BTC ETFs recorded a mild outflow of $61.16 million on Wednesday, indicating cautious institutional sentiment.
- BTC extends its consolidation since mid-July as neutral momentum indicators point to a lack of clear directional bias.
Bitcoin (BTC) rebounds mildly, trading above $63,800 at the time of writing on Thursday after four consecutive days of losses. BTC has been trading sideways since mid-July, while cautious institutional flows and neutral momentum indicators suggest traders remain hesitant, pointing to a lack of clear directional bias.
Cautious institutional demand
Institutional demand for Bitcoin shows cautious sentiment. SoSoValue data shows that spot BTC ETF recorded an outflow of $61.16 million on Wednesday, following a mild inflow on Tuesday and an outflow on Monday. This mixed flow so far this week suggests that institutional investors remain hesitant to increase their exposure amid ongoing market uncertainty.
Why do rising Oil prices shape BTC’s near-term outlook?
The initial positive reaction to moderating US consumer inflation in July has faded as investors turn their attention to rising Oil prices again, with West Texas Intermediate (WTI) up over 5.5% so far this week and BTC down 1.82% during the same period.
If energy costs remain higher, it could make it harder for inflation to continue easing, potentially limiting expectations for Federal Reserve (Fed) rate cuts and pressuring BTC in the near term.
On the macroeconomic front, the US Bureau of Labor Statistics reported on Wednesday that the headline US Consumer Price Index (CPI) eased in line with market expectations, to 3.4% YoY in July from 3.5% previously. Adding to this, the core CPI gauge, which excludes volatile food and energy prices, rose 0.2% and 2.5% on a monthly and yearly basis, respectively, matching consensus estimates.
Combined with last Friday’s weaker-than-expected Nonfarm Payrolls (NFP) report, the data gives the Fed more room to hold interest rates steady in September, which could provide some support to risk assets such as BTC.
However, rising Oil prices remain a key risk to this outlook. Uncertainty between the US-Iran peace deal and escalating attacks by Iran-backed Houthis on vessels around the Red Sea and Bab el-Mandeb Strait have also increased war-risk premiums and raised concerns about potential disruptions to global energy supplies. This continues to fuel inflation fears, dampening risk appetite and weighing on BTC.
In an exclusive interview, Simon-Peter Massabni, Head of Business Development at XS.com, told FXStreet, “The absence of a clear horizon for the path of the Middle East war, whether toward full-scale war or peace, contributes to keeping Bitcoin in its sideways path, with no major movement up or down. There is no horizon for reaching an agreement regarding the Strait of Hormuz and settling the war, while on the other hand we see signs suggesting that the United States is temporarily refraining from escalation. Meanwhile, the continued rise in energy prices and upside risks for inflation, followed by US and Japanese bond yields remaining high, contribute to limiting funding for leveraged positions in the futures market, which leads to a lack of strong momentum in price movement.”
Bitcoin technical outlook: Extending its consolidation since mid-July
Bitcoin price trades above $63,800 on Thursday, holding a bearish bias as it remains below the key Exponential Moving Averages (EMAs). Moreover, the Crypto King has been extending its consolidation since mid-July between $62,300 and $66,500.
Momentum remains neutral to slightly weak on the daily chart, with the Moving Average Convergence Divergence (MACD) histogram slightly negative and the Relative Strength Index (RSI) near the neutral 50 level at 48 on Thursday. Together, these indicators suggest muted momentum as BTC consolidates below key resistance levels, pointing to a lack of clear directional bias.
On the downside, initial support is seen at the horizontal floor at $62,300, a break of which would extend losses toward the yearly low at $57,800 set on July 1.
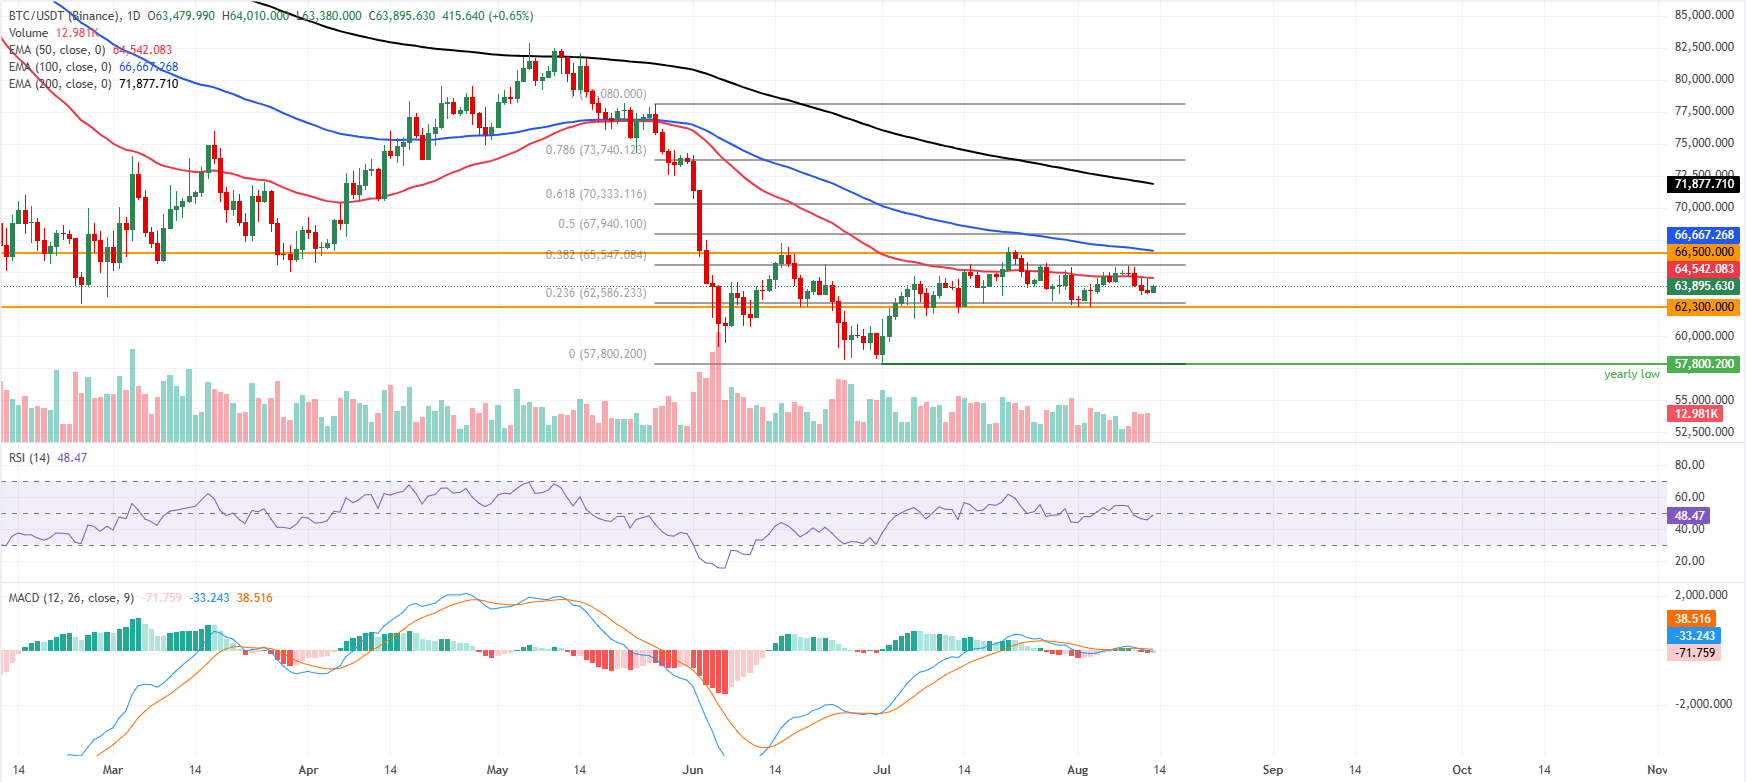
On the topside, immediate resistance is seen at the 50-day EMA at $64,542, followed by the 100-day EMA at $66,667, which roughly coincides with the horizontal resistance at $66,500. As long as BTC trades beneath the 50-day EMA and the $66,500–$66,667 zone, rallies are likely to be sold, with bears retaining control unless daily closes reclaim the 50-day EMA and then the 100-day EMA to ease the current pressure.
(The technical analysis of this story was written with the help of an AI tool. Know more.)
Bitcoin, altcoins, stablecoins FAQs
Bitcoin is the largest cryptocurrency by market capitalization, a virtual currency designed to serve as money. This form of payment cannot be controlled by any one person, group, or entity, which eliminates the need for third-party participation during financial transactions.
Altcoins are any cryptocurrency apart from Bitcoin, but some also regard Ethereum as a non-altcoin because it is from these two cryptocurrencies that forking happens. If this is true, then Litecoin is the first altcoin, forked from the Bitcoin protocol and, therefore, an “improved” version of it.
Stablecoins are cryptocurrencies designed to have a stable price, with their value backed by a reserve of the asset it represents. To achieve this, the value of any one stablecoin is pegged to a commodity or financial instrument, such as the US Dollar (USD), with its supply regulated by an algorithm or demand. The main goal of stablecoins is to provide an on/off-ramp for investors willing to trade and invest in cryptocurrencies. Stablecoins also allow investors to store value since cryptocurrencies, in general, are subject to volatility.
Bitcoin dominance is the ratio of Bitcoin's market capitalization to the total market capitalization of all cryptocurrencies combined. It provides a clear picture of Bitcoin’s interest among investors. A high BTC dominance typically happens before and during a bull run, in which investors resort to investing in relatively stable and high market capitalization cryptocurrency like Bitcoin. A drop in BTC dominance usually means that investors are moving their capital and/or profits to altcoins in a quest for higher returns, which usually triggers an explosion of altcoin rallies.
Nothing in this material constitutes investment advice, personal recommendation, investment research, an offer, or a solicitation to buy or sell any financial instrument. The content has been prepared without consideration of your individual investment objectives, financial situation, or needs, and should not be treated as such.
Past performance is not a reliable indicator of future performance and/or results. Forward-looking scenarios or forecasts are not a guarantee of future performance. Actual results may differ materially from those anticipated.
Mitrade makes no representation or warranty as to the accuracy or completeness of the information provided and accepts no liability for any loss arising from reliance on such information.
Recommended Articles


